Downloaded 29 times
![Sheet 2
Ans.
x=linspace(-4,4,200); p=[1 3 4 2 6]; y=polyval(p,x);
plot(x,y)
r=roots(p)
r =
-1.7749 + 1.2310i
-1.7749 - 1.2310i
0.2749 + 1.1002i
0.2749 - 1.1002i
2.3 A function f (x) is given as
f(x)=x4
+3x3
+4x2
+2x+6
(a) Plot f (x) and (b) Find the roots of f (x)](https://image.slidesharecdn.com/sheet2-140421093327-phpapp02/75/Sheet-2-3-2048.jpg)
![Sheet 2
v=0:.001:.6;
i=1e-14*exp(v/(2*26e-3));
plot(v,i,'-B','linewidth',2)
xlabel('voltage (V)')
ylabel('current (A)')
title('Diode current')
2.5The voltage v and current I of a certain diode are related by the
expression
i =Isexp[ v/ (nVT )]
If Is = 1.0x10⁻¹⁴
A, n = 2.0 and VT = 26 mV, plot the currentversus
voltage curve of the diode for diode voltage between 0 and 0.6volts.](https://image.slidesharecdn.com/sheet2-140421093327-phpapp02/75/Sheet-2-5-2048.jpg)
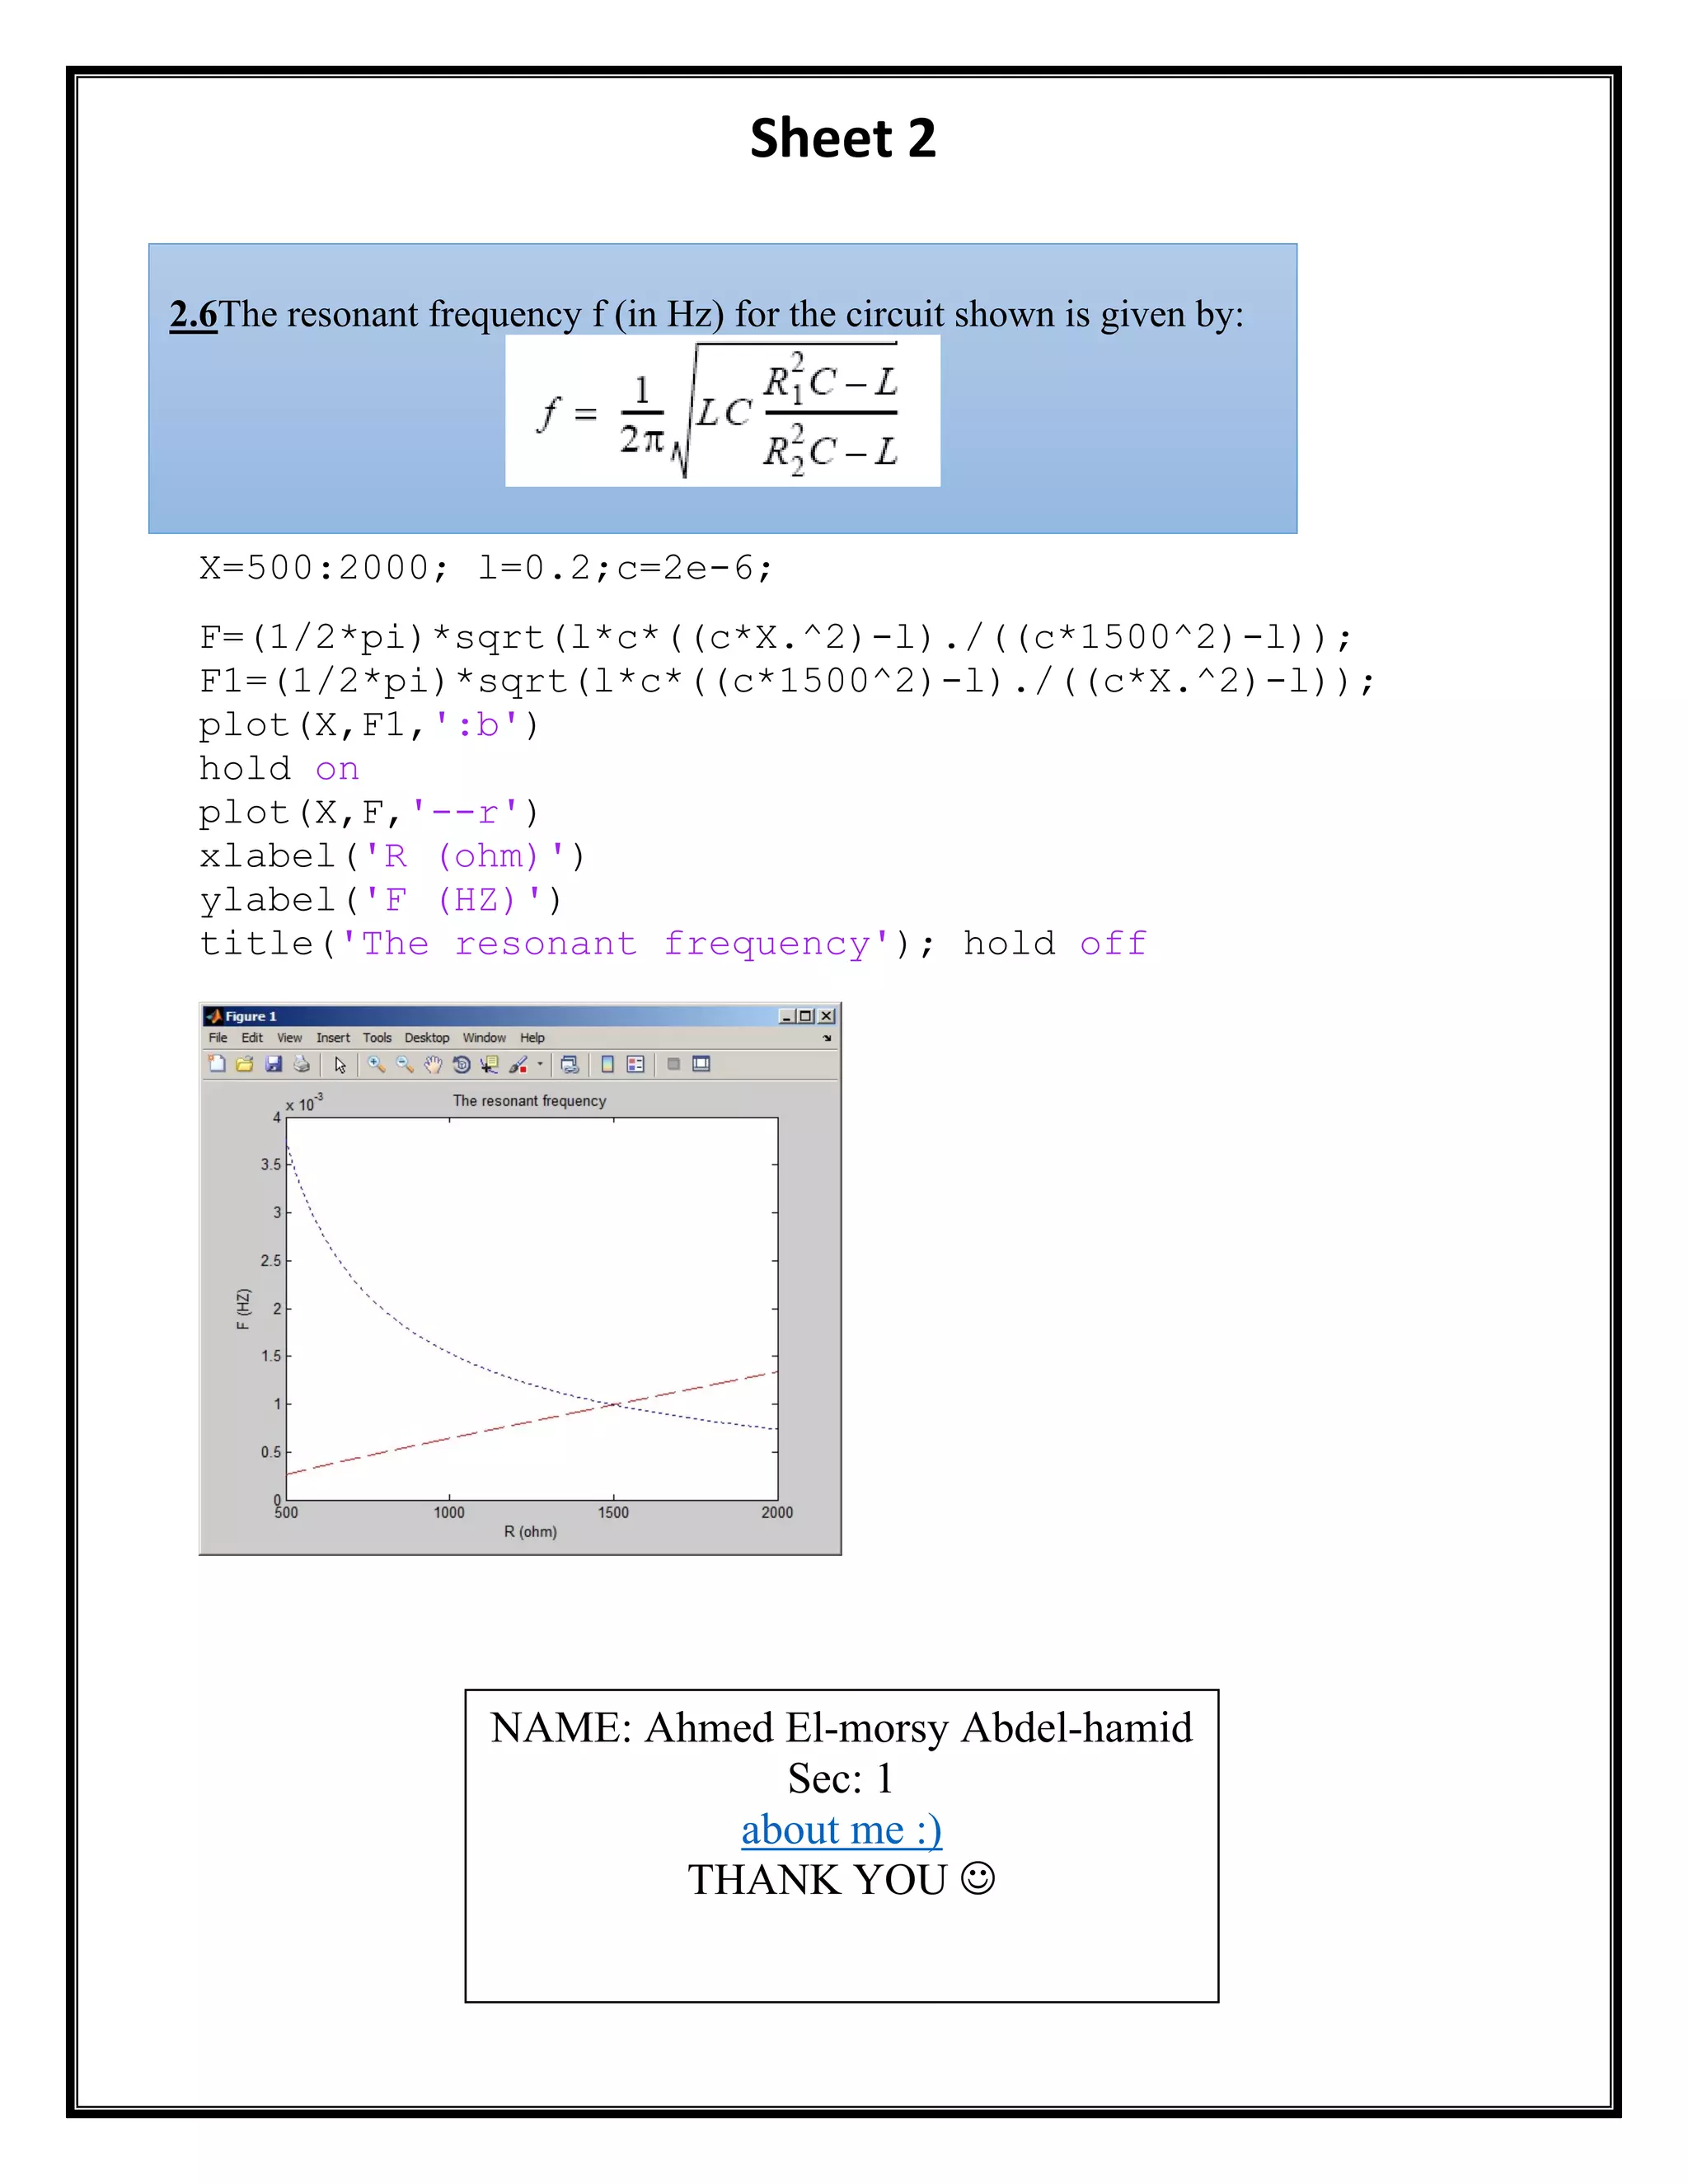

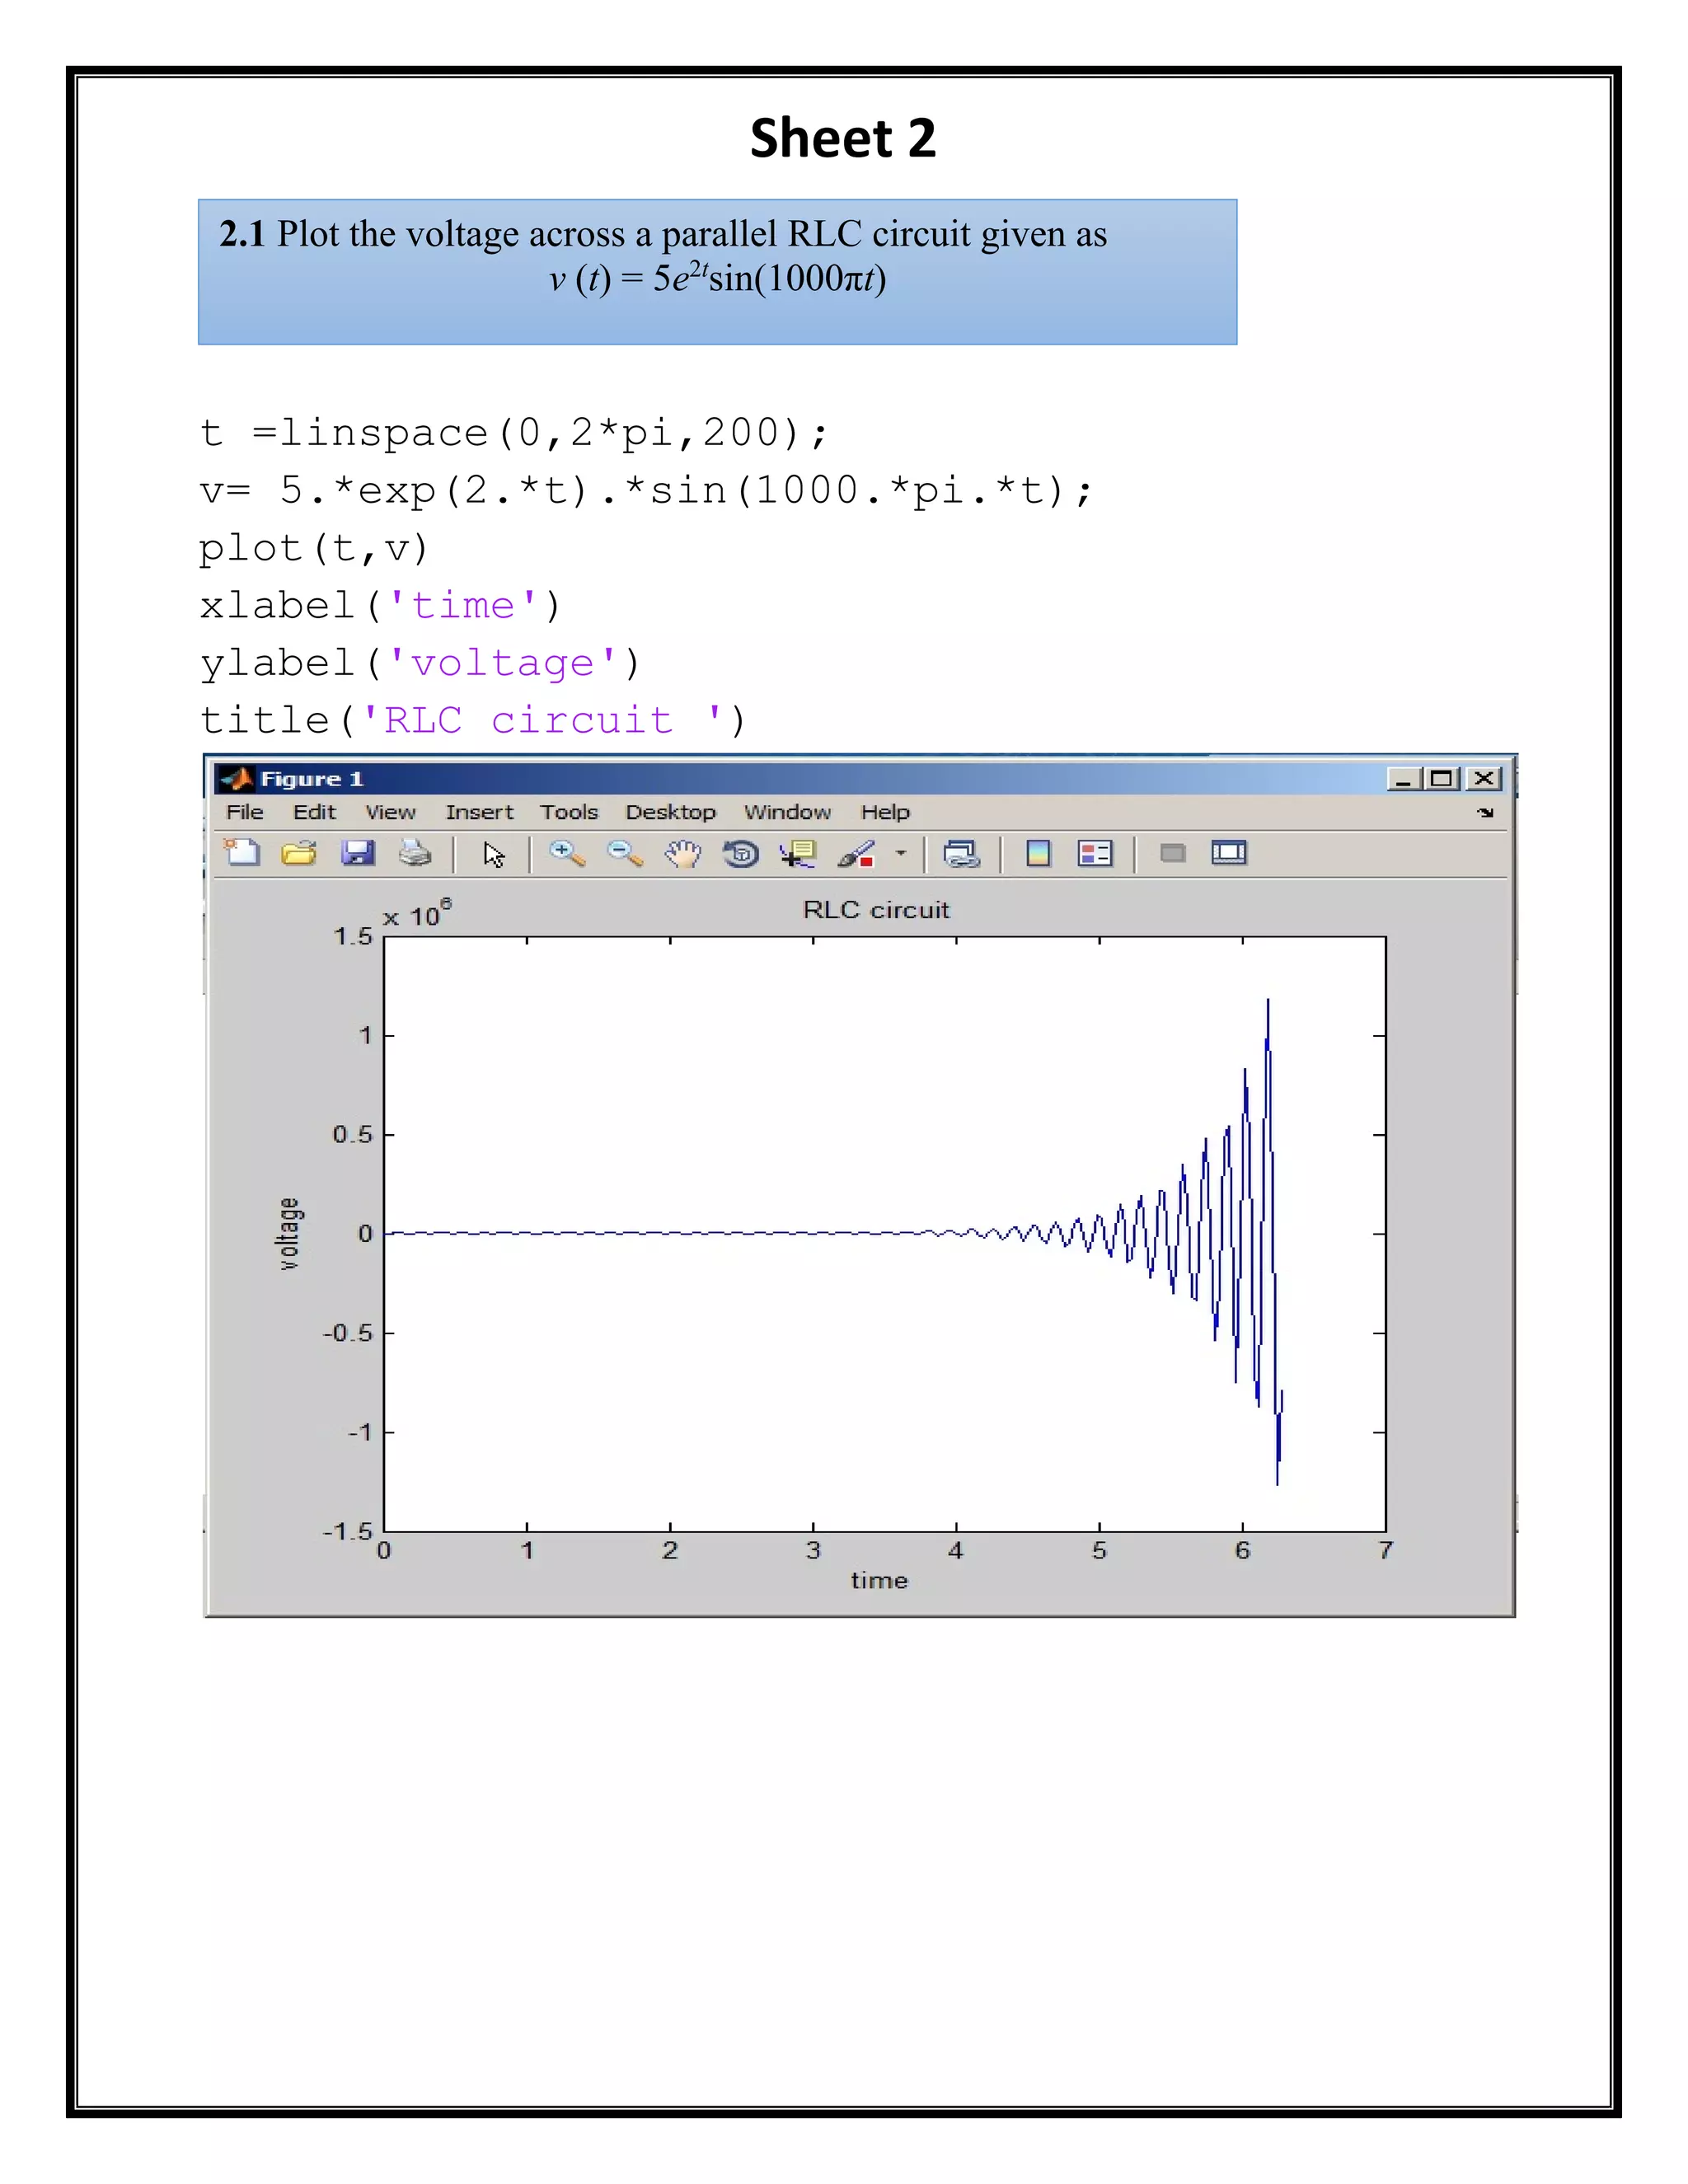
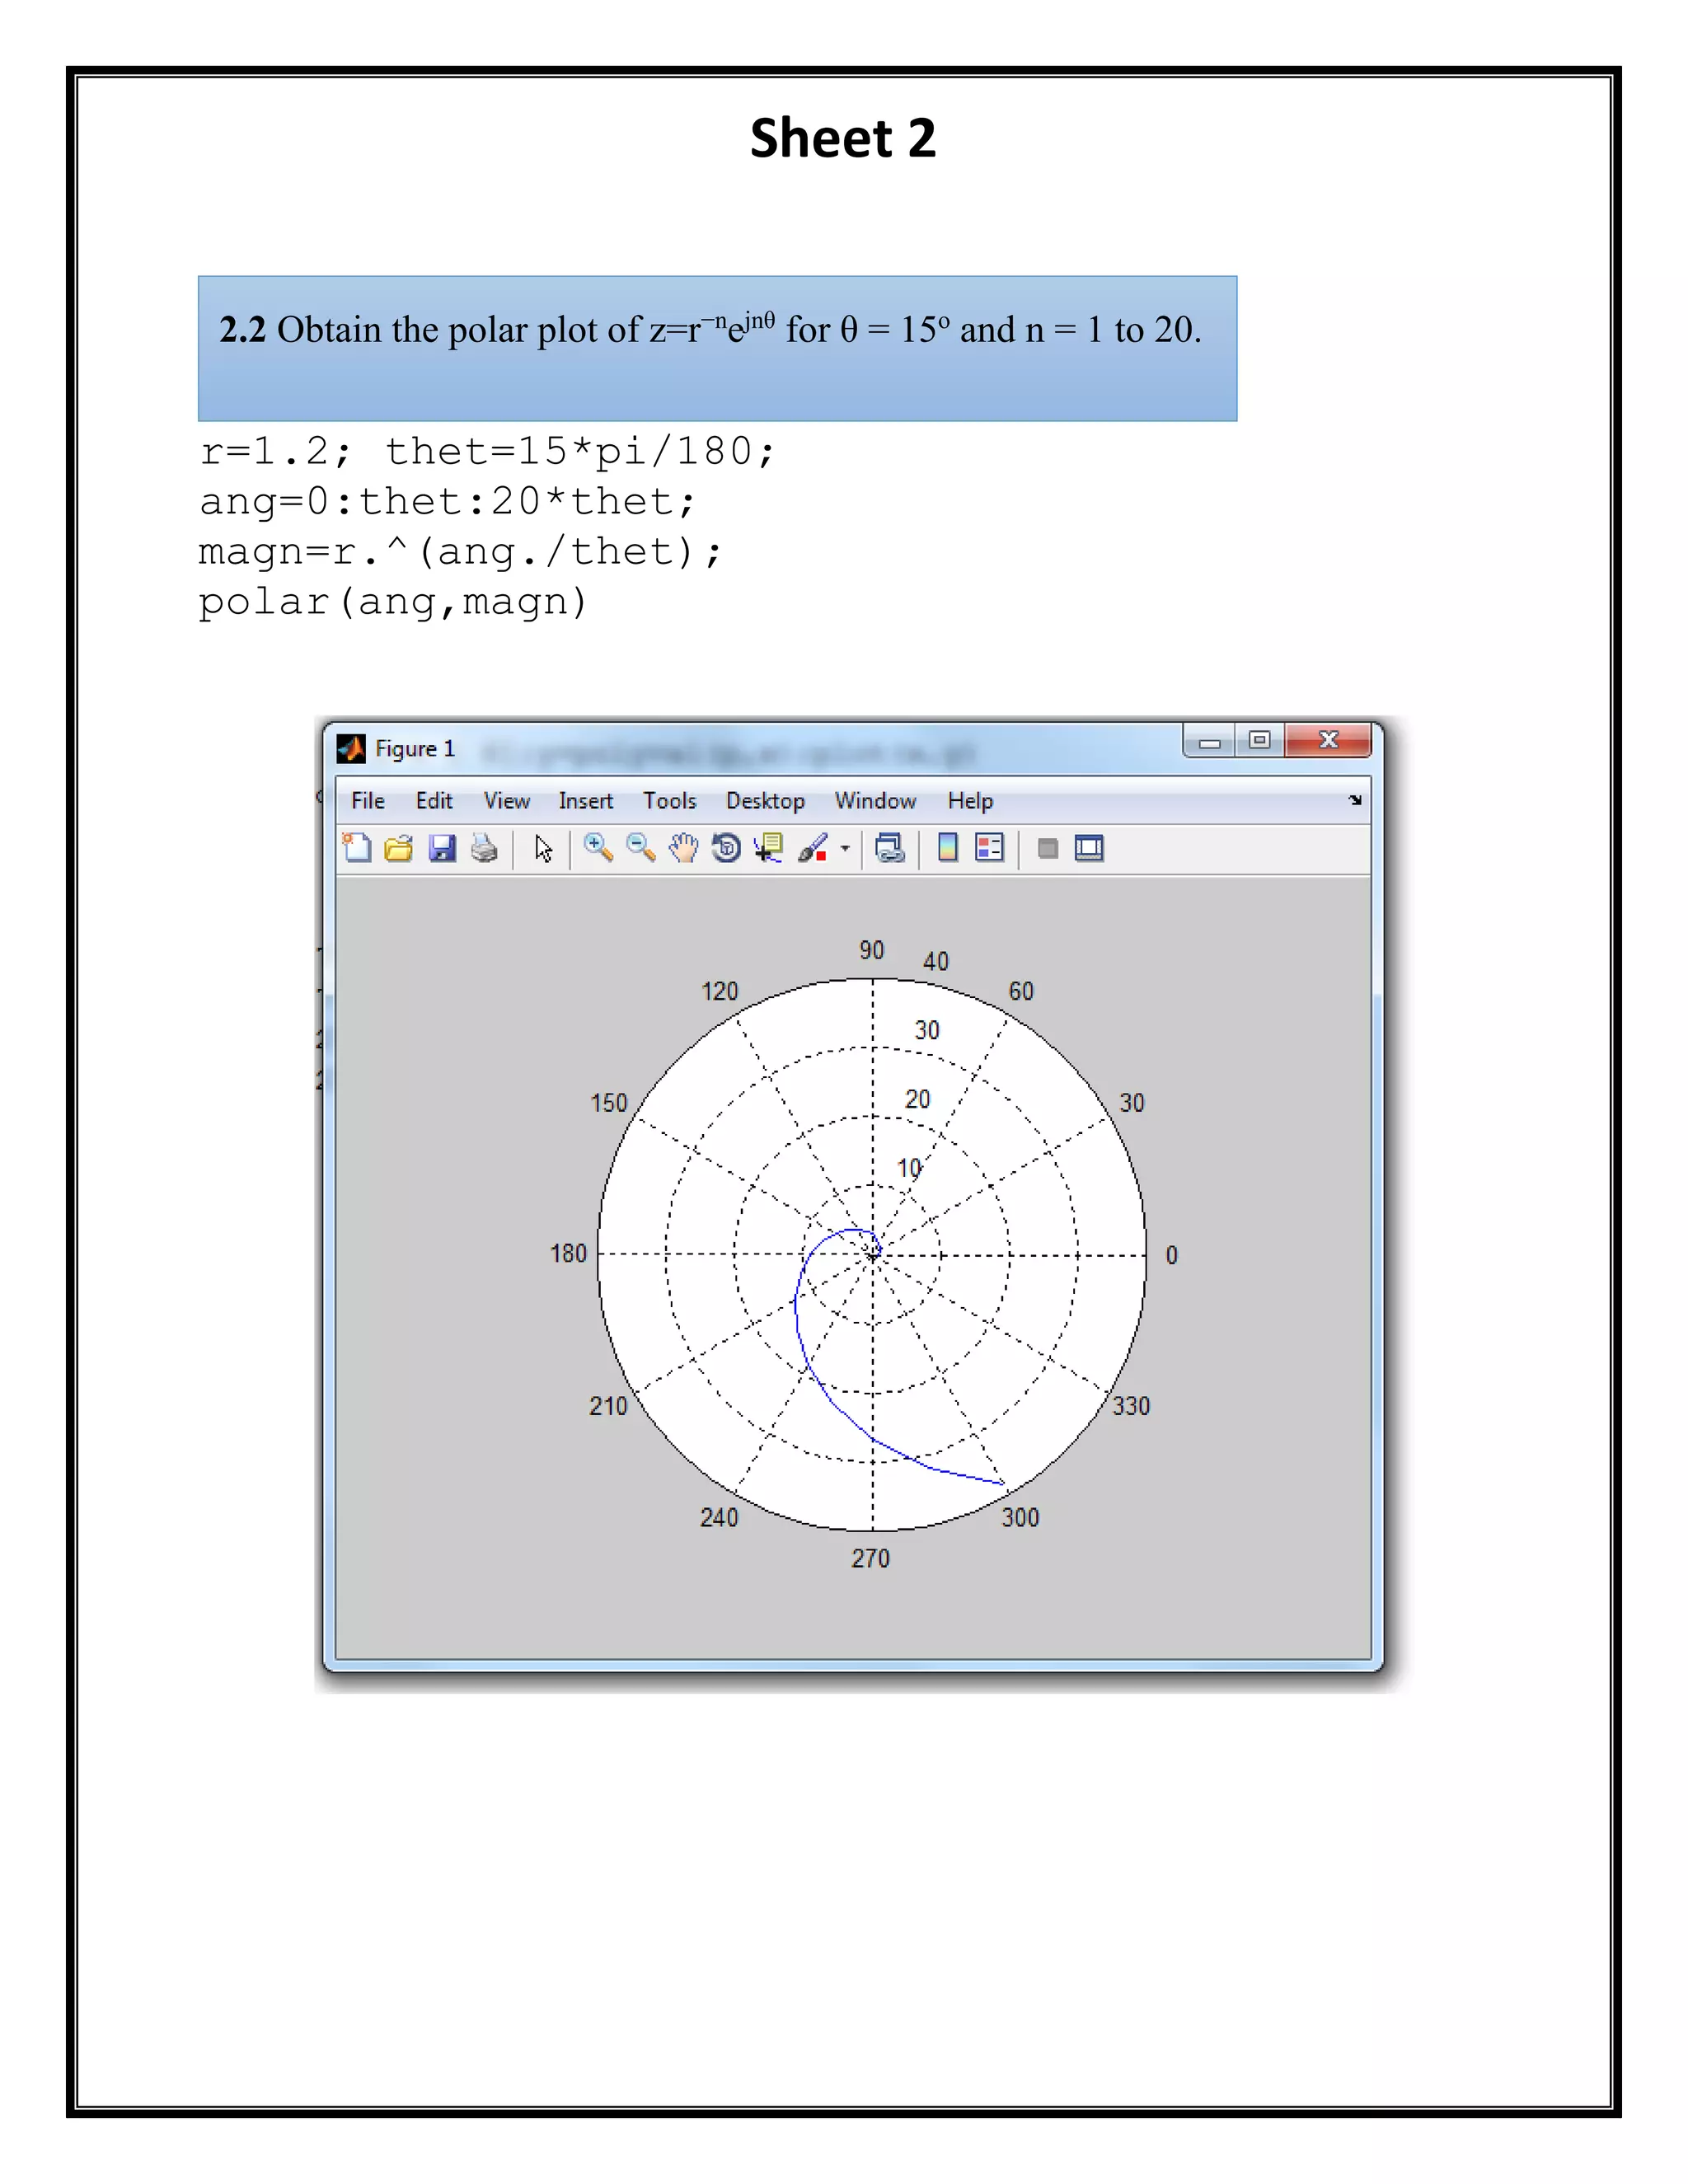
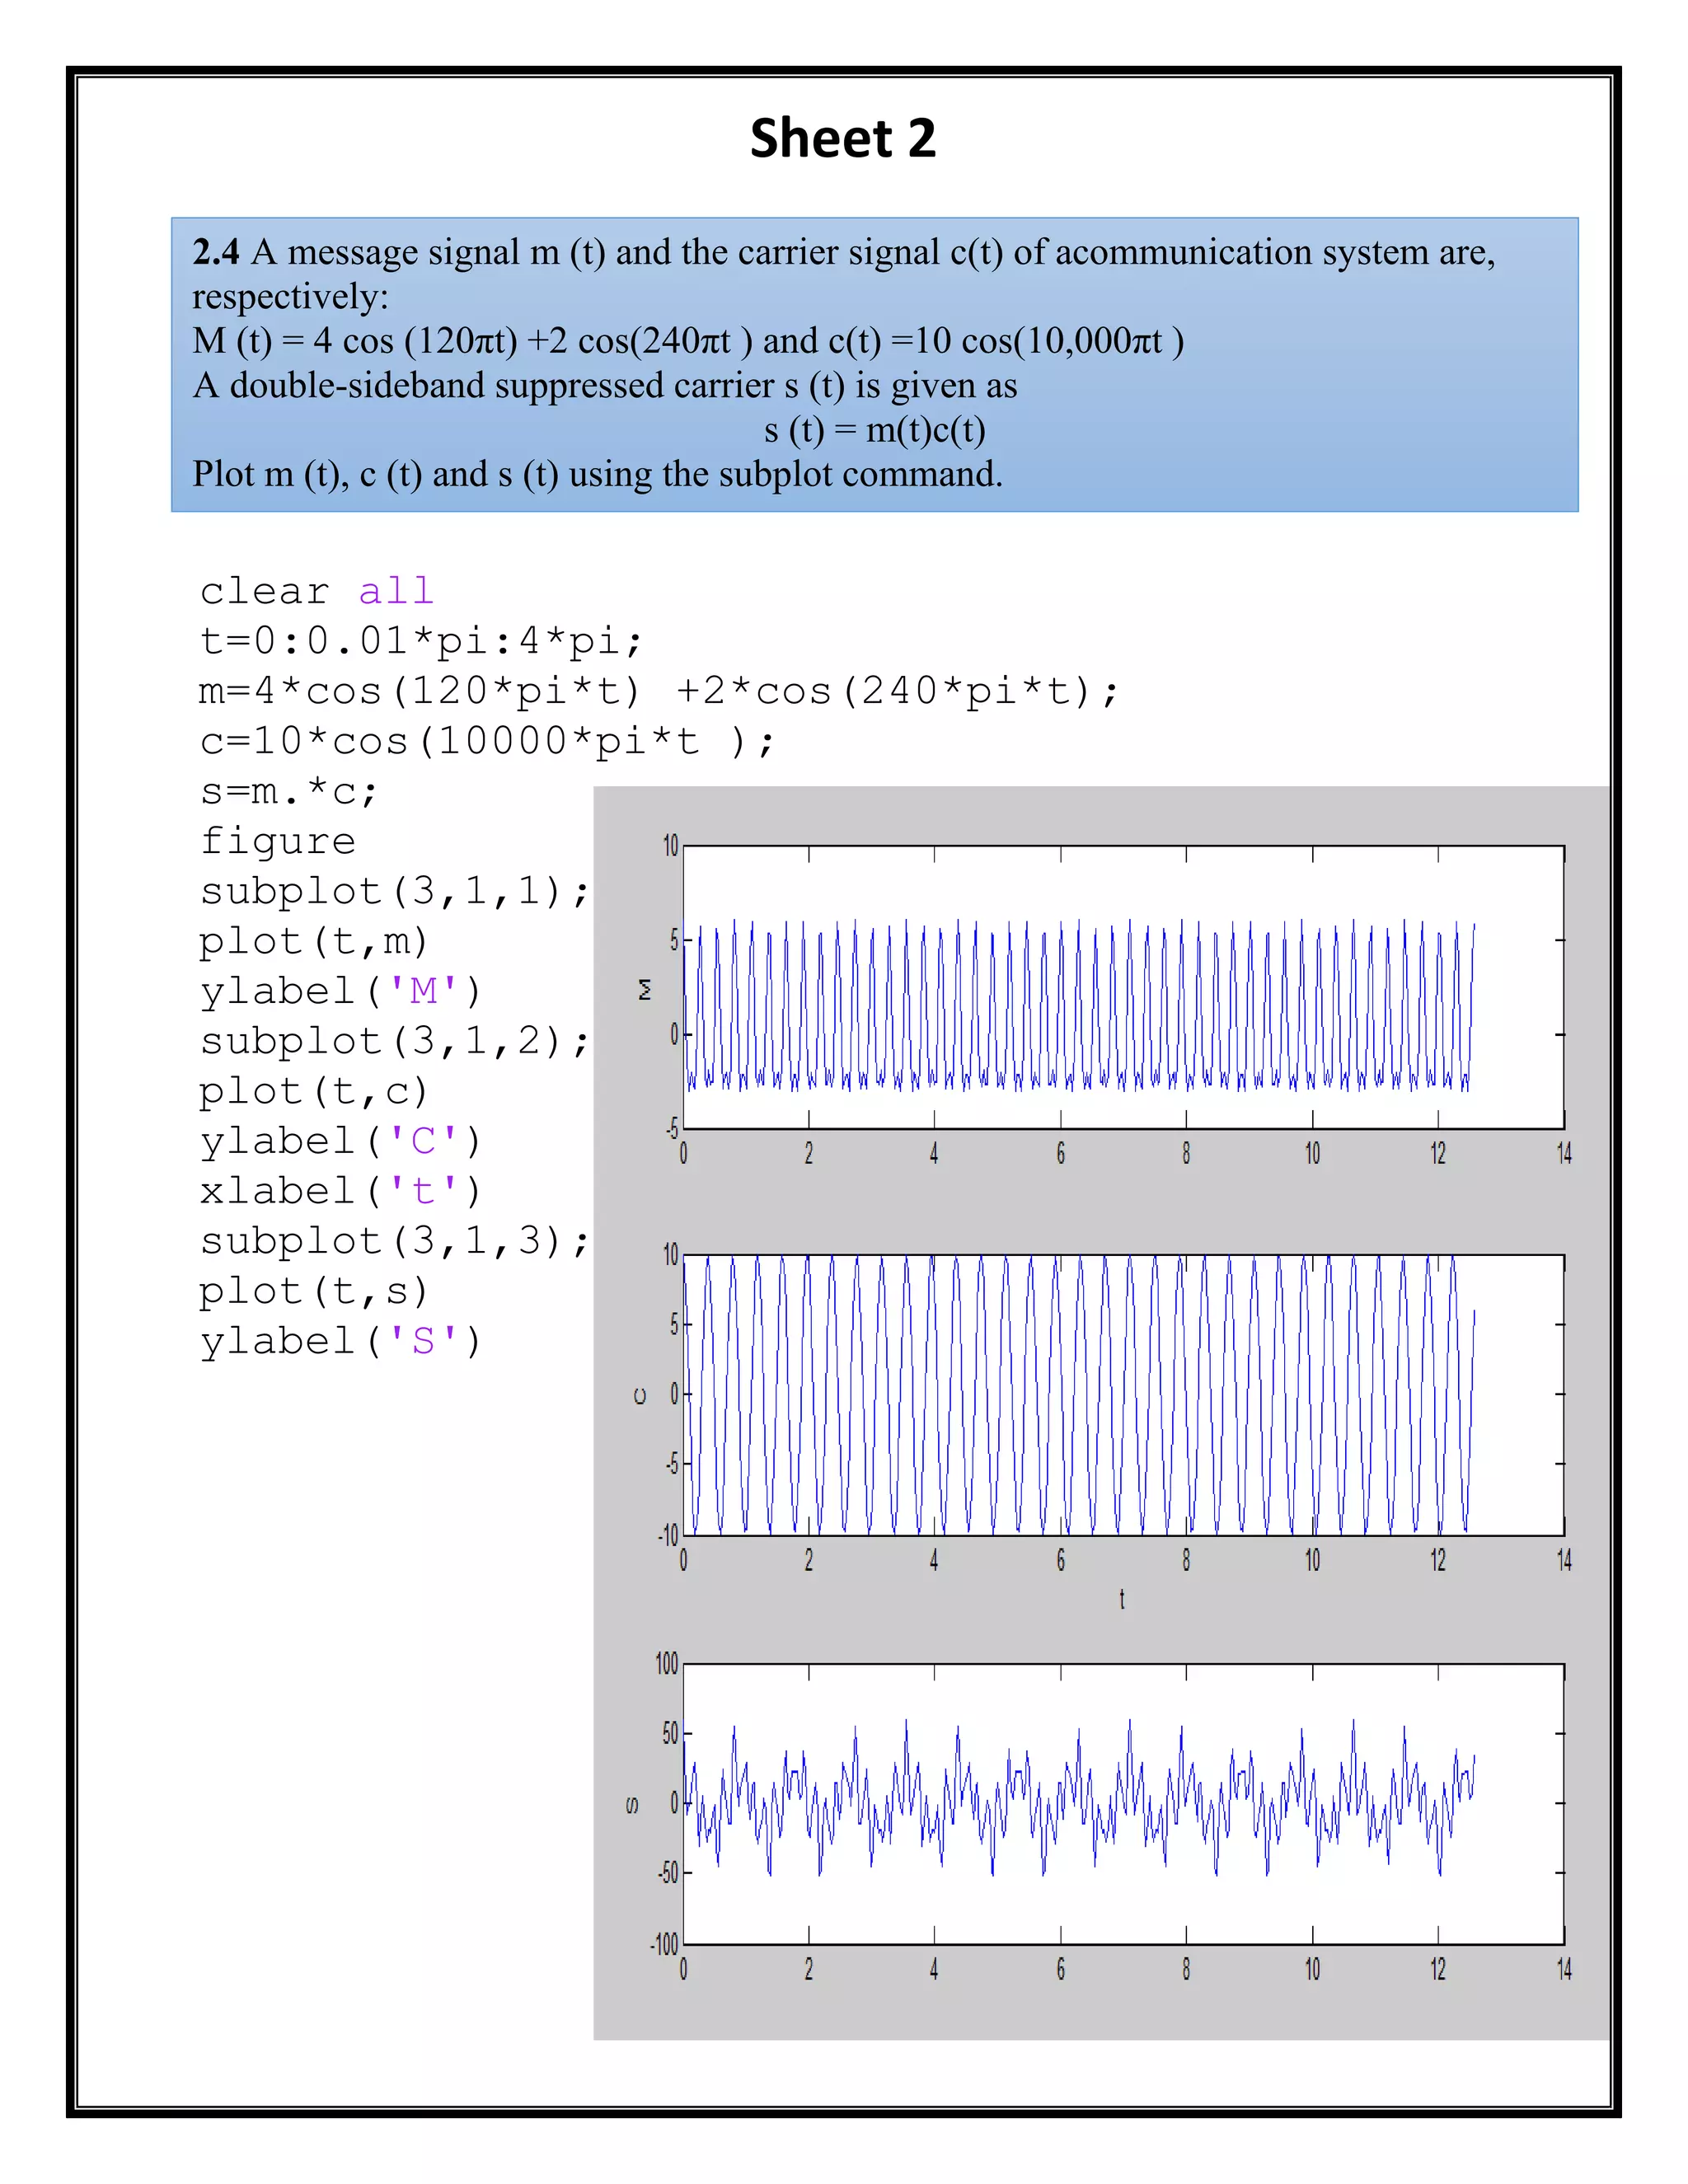
The document contains solutions to multiple physics problems involving circuits, signals, and diodes. It includes: 1) A plot of the voltage across a parallel RLC circuit over time. 2) A polar plot of z=r−n ejnθ for varying values of n and θ=15°. 3) A plot and root calculation of a 5th order polynomial function. 4) Plots of message, carrier, and modulated signals for an communication system. 5) A current-voltage plot of a diode with given parameter values. 6) Plots of resonant frequency equations for an RLC circuit over varying resistance values.