Downloaded 10 times


![Home
appliances
&
devices
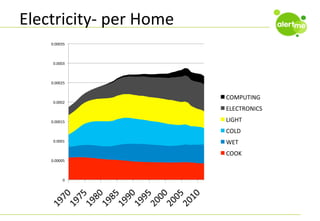
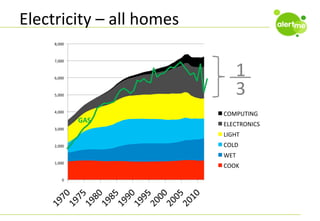
In
2009
the
average
household
owned
11
Cmes
more
consumer
electronics
items
than
they
had
in
1970,
and
three
and
a
half
Cmes
more
than
in
1990
[Av
home
has
41
appliances
today]](https://image.slidesharecdn.com/shcp13beart-131119070801-phpapp02/85/AlertMe-Beart-Smart-Homes-Cleanpower-2013-Cambridge-UK-via-CIR-www-hvm-uk-com-30-320.jpg)

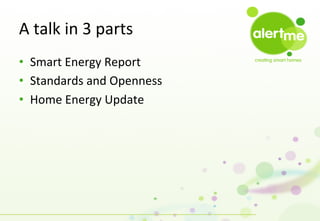
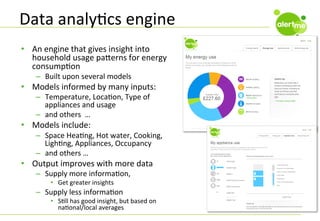
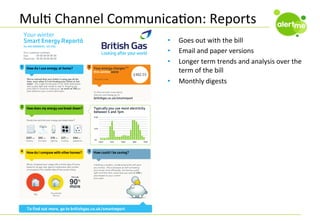
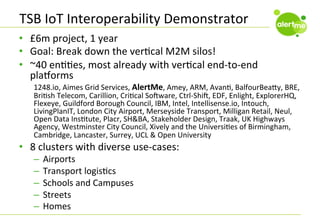
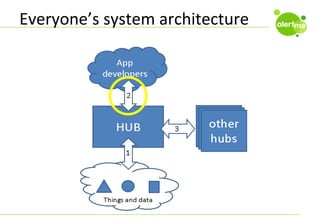
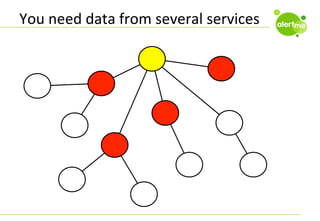
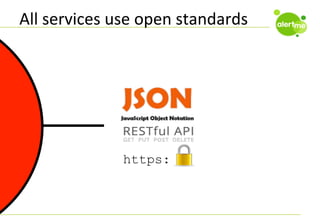
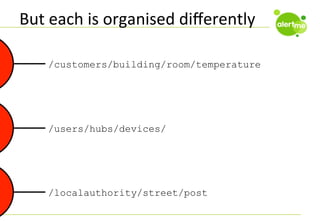
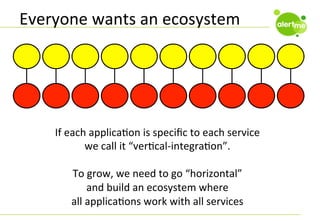
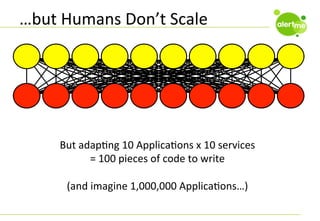
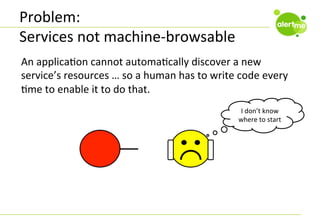
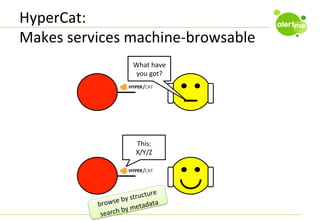
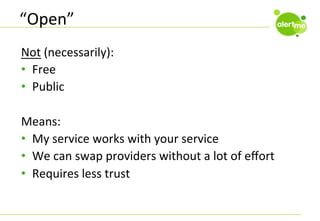
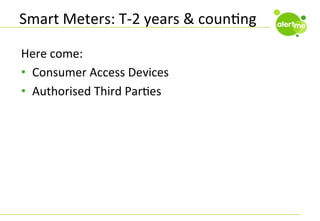
This document provides a summary of a talk on smart homes at scale given in three parts: 1. A smart energy report discussing a data analytics engine that provides insights into household energy usage patterns using various models informed by inputs like temperature, location, and appliance usage. 2. Standards and openness, emphasizing the need for open standards as markets mature to allow customer choice and ecosystem partnerships through projects like HyperCat, which makes services machine-browsable. 3. A home energy update noting that households now own far more electronic devices and appliances than in the past, and that smart meters are being rolled out widely in the next two years.


![[Pipeline Support Solutions] OCP Case Study](https://cdn.slidesharecdn.com/ss_thumbnails/ocp2012-130828080239-phpapp02-thumbnail.jpg?width=640&height=640&fit=bounds)


