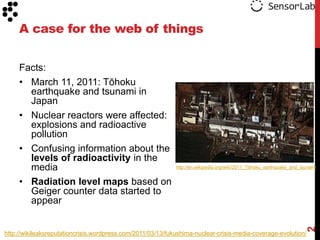
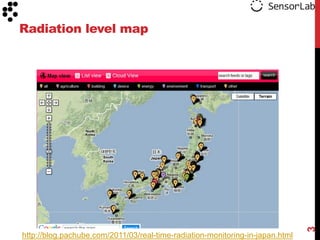
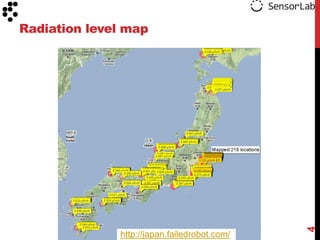
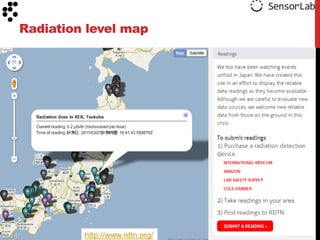
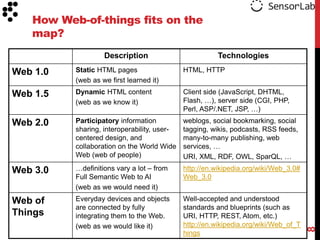
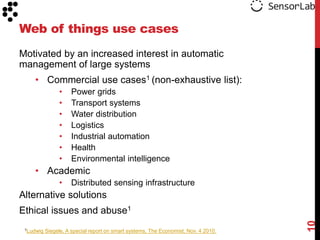
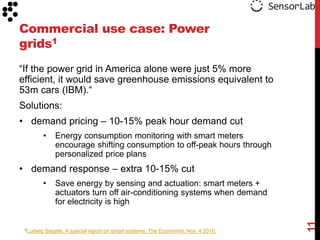
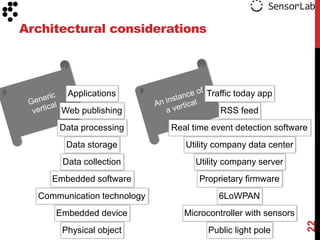
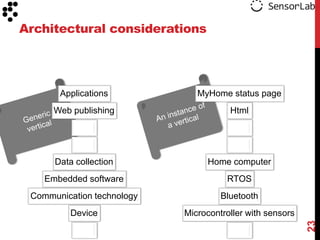
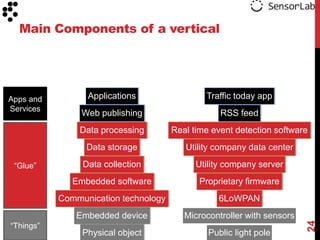
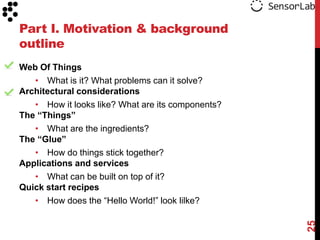
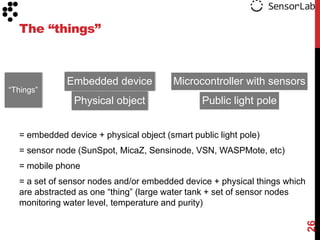
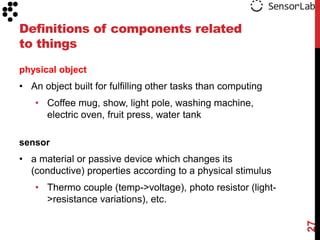
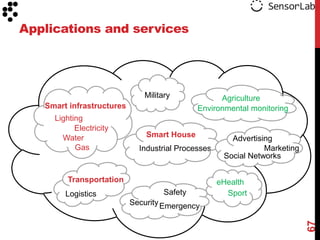
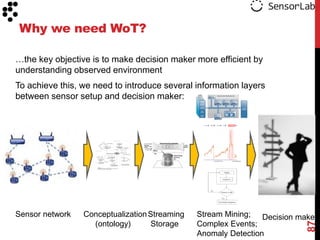
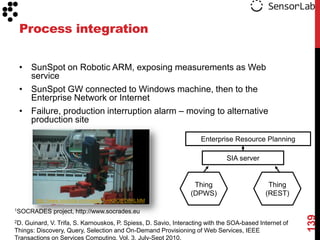
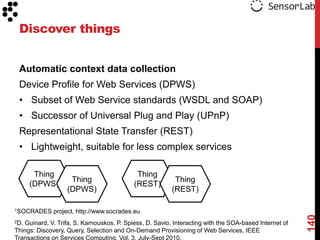
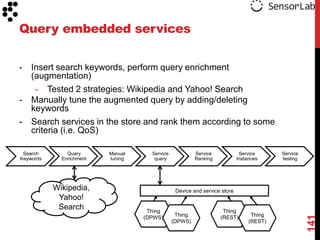
The document discusses the potential of a web of things (WoT) using sensor data. It provides examples of how a WoT was used after the 2011 Tōhoku earthquake and tsunami in Japan to share radiation level maps in real-time. The document outlines several potential commercial and academic uses of a WoT, including monitoring power grids, transportation systems, industrial automation, health, environment, and distributed sensor networks. It also discusses the main components, applications, and technologies that could enable a WoT, such as embedded devices, physical objects, communication standards, and data collection/processing services.
The Web of Things: Enabling the Physical World to the WebAndreas Kamilaris
A presentation about the practice of Web-enabling the physical world, by means of principles inspired from the Web of Things. This is an invited presentation of Prof. Andreas Pitsillides and Andreas Kamilaris at the University of Johannesburg, South Africa in April, 2012. In this presentation, the motivation, practice, historical background, exemplary applications, dangers and future challenges of the Web of Things are discussed.
The tutorial on the Web of Things discusses possible solutions to build the entire vertical system by identifying the relevant components, illustrating their functionality and integration, and showing the examples of existing tools and
systems. First, the tutorial covers architectural aspects and discusses the levels of abstraction for integrating the “things” into the Web. Next, the tutorial focuses on semantic technologies and analytic methods for leveraging services and applications on top of the “things”. State of the art technology and tools are showed through live demos. The tutorial concludes with a brief review of existing projects and an outline of research directions and challenges.
Vlad Trifa - Final PhD Thesis Defense at ETH ZurichVlad Trifa
The final defense of my phd thesis at ETH Zurich. The final report will be posted soon on my personal Web site (vladtrifa.com), once accepted by the school commission and submitted.
EVRYTHNG: Concepts, technologies and applications for connecting physical obj...EVRYTHNG
Check out the presentation from Co-Founder Dominique Guinard and Research Developer Iker Larizgoitia Abad, from the 14th International Conference on Web Engineering ICWE 2014.
Hypermedia-driven Socio-technical Networks for Goal-driven Discovery in the W...Andrei Ciortea
To cope with dynamic environments, Internet of Things (IoT) applications are expected to autonomously discover and interact with services at runtime in pursuit of design or user-specified goals. On the one hand, various paradigms and technologies are available to program goal-driven autonomous software agents, and on the other hand hypermedia-driven environments are central to the development of robust machine-to-machine applications. However, existing approaches for the development of hypermedia-driven environments fall short of meeting the needs of autonomous agents: they either severely restrict the agents’ autonomy, or their topological structure is either fragmented or inefficient to navigate at scale. In this paper, we explore the use of socio-technical networks, that is networks of people and things interrelated in a meaningful manner via typed relations, as an overlay for enhancing hypermedia-driven interaction in IoT environments. We present a proof of concept and discuss several classes of applications in which this model could prove useful.
In the Web of Things initiative, we propose to make smart things first-class citizens of the World Wide Web. This allows to apply widely used Web mechanisms (bookmarking, browsing,...) to things and to use physical devices just like any other service on the Web. In the talk, some of the prototypes that we have been building in our lab are presented. We also ask what will be the "next big thing" in connecting and mashing up real-time, real-world services.
The Internet of Things (IoT) is defined by embedded computing devices endowed with cross-network connectivity. This era of computing has huge potential for connected enterprises and consumers, and already has many successful use cases. IoT systems encompass many types of connectivity patterns, proprietary systems and network types. Just as the Web plays a significant role in providing an open, interoperable, easily deployable framework for today’s enterprise systems, it is not surprising the Web will provide similar benefits to IoT. New Web standards have allowed enterprises to extend their internal real-time systems over the firewall in a natural, unimpeded fashion to provide real-time, dynamic information to their customers and partners to ensure consistency and efficiency. These same Web standards can and should be applied to IoT systems to obtain advantages such as global reach, ease of deployment, economies of scale, ease of development, etc. We will discuss this evolution and explore the further impact of the Web on IoT.
Semantic Metadata to Support Device Interaction in Smart EnvironmentsSimon Mayer
Slides for a talk held at the Fourth International Workshop on the Web of Things (WoT 2013) on Sep 9th, 2013. For the full paper, see http://www.webofthings.org/wot/2013/program.php
Arkady Zaslavsky, Charith Perera, Dimitrios Georgakopoulos, Sensing as a Service and Big Data, Proceedings of the International Conference on Advances in Cloud Computing (ACC), Bangalore, India, July, 2012, Pages 21-29 (8)
Conference at Tongi University - Shanghai: Smart City for developing and eme...Isam Shahrour
The conference of professor Isam Shahrour presented the urban challenges of emerging and developing countries, the concept of the Smart City and how this concept could help in facing the challenges of these countries. It also presents the implementation of the Smart City concept through the construction of the SunRise Smart City demonstrator.
Slides from Mr. Georgios Tselentis, EC, DG CONNECT, Net Futures, Experimental Platforms.
Presented at CSC 2016, session2: Open Session on IoT Large Scale Pilots for Reference Zones in EU cities.
Preprint-WCMRI,IFERP,Singapore,28 October 2022.pdfChristo Ananth
Call for Papers- Special Session: World Conference on Multidisciplinary Research and Innovation (WCMRI-22), (Session 1: Information and Communication Technology), Singapore
Christo Ananth
Professor, Samarkand State University, Uzbekistan
Isam Shahrour conference at Shandong Agricultural University: Smart City for ...Isam Shahrour
This conference presented the world environmental challenges in particular the greenhouse emission, the global warming, the climate change and the air pollution, then the Smart City concept and how this concept could help in facing the environmental challenges.
6DE THEMA ANNEX III "NUTSDIENSTEN EN OVERHEIDSDIENSTEN"Maksim Sestic
Annex III definitie: Nutsvoorzieningen zoals riolering, afvalbeheer, energievoorziening, watervoorziening, bestuurlijke en maatschappelijke instanties van de overheid, zoals bestuurlijke overheden, civiele bescherming, scholen en ziekenhuizen.
Data-Driven Selling and The Value of Data In The Water IndustrySunit Mohindroo
Slides from Peter Gallant's talk at the Feb 18, 2014 Event: Going Beyond The Spreadsheet - A Lunch & Learn co-hosted by WatrHub Inc. and WaterTAP Ontario.
Lille Smart water demo site of the european project SmartWatr4Europe, Aquatec...Isam Shahrour
Presentation by Isam Shahrour of the “Lille Smart Water demo site Sunrise - European project SmartWater4Europe” at AQUATECH 2013,AMSTERDAM, November 2013.
In just a few years, the number of Internet-connected "things" (home appliances, smart energy meters, health monitors, sensors) is predicted to be orders of magnitude larger than the number of users and traditional computers. The Web of Things is a vision where everyday objects are seamlessly integrated into the World Wide Web (WWW) using well-known standards and blueprints (e.g. URIs, HTTP and REST). This hands-on lab (presented at JavaOne 2010) introduces participants to the motivation, key concepts and relevant technologies behind this vision. Lab attendees will use the Sun SPOT wireless device (www.sunspotworld.com) developed at Sun Labs to learn how physical resources (e.g. light sensor, LEDs) can be exposed as web resources and manipulated via HTTP commands.
Additional lab materials may be accessed at http://www.sunspotworld.com/S314730_Sun_SPOTs_Web_Of_Things/index.html.
Authros: Nguyen Quoc Viet Hung (1), Nguyen Thanh Tam (1), Zoltán Miklós (2), Karl Aberer (1),
Avigdor Gal (3), and Matthias Weidlich (4)
1 École Polytechnique Fédérale de Lausanne
2 Université de Rennes 1
3 Technion – Israel Institute of Technology
4 Imperial College London
by Irene Celino, Simone Contessa, Marta Corubolo, Daniele Dell’Aglio, Emanuele Della Valle, Stefano Fumeo and Thorsten Krüger
CEFRIEL – Politecnico di Milano – SIEMENS
by G. Larkou, J. Metochi, G. Chatzimilioudis and D. Zeinalipour-Yazti
Presented at: 1st IEEE International Workshop on Mobile Data Management Mining and Computing on Social Networks, collocated with IEEE MDM'13
The presentation was delivered by FORTH at the 3rd International Workshop on the role of Semantic Web in Provenance Management 2012 (SWPM2012) in Heraklion, Greece on 28th of May 2012.
Abstract:
Workflow systems can produce very large amounts of provenance information. In this paper we introduce provenance-based inference rules as a means to reduce the amount of provenance information that has to be stored, and to ease quality control (e.g., corrections). We motivate this kind of (provenance) inference and identify a number of basic inference rules over a conceptual model appropriate for representing provenance. The proposed inference rules concern the interplay between (i) actors and carried out activities, (ii) activities and devices that were used for such activities, and, (iii) the presence of information objects and physical things at events. However, since a knowledge base is not static but it changes over time for various reasons, we also study how we can satisfy change requests while supporting and respecting the aforementioned inference rules. Towards this end, we elaborate on the specification of the required change operations.
This paper was presented by Vassilis Papakonstantinou at the 17th ACM Symposium on Access Control Models and Technologies (ACM SACMAT 2012) in Newark, USA, June 20 - 22, 2012.
Abstract:
The Resource Description Framework (RDF) has become the defacto standard for representing information in the Semantic Web. Given the increasing amount of sensitive RDF data available on the Web, it becomes increasingly critical to guarantee secure access to this content. In this paper we advocate the use of an abstract access control model to ensure the selective exposure of RDF information. The model is defined by a set of abstract operators. Tokens are used to label RDF triples with access information. Abstract operators model RDF Schema inference rules and propagation of labels along the RDF Schema (RDFS) class and property hierarchies. In this way, the access label of a triple is a complex expression that involves the labels of the triples and the operators applied to obtain said label. Different applications can then adopt different concrete access policies that encode an assignment of the abstract tokens and operators to concrete (specific) values. Following this approach, changes in the interpretation of abstract tokens and operators can be easily implemented resulting in a very flexible mechanism that allows one to easily experiment with different concrete access policies (defined per context or user). To demonstrate the feasibility of the approach, we implemented our ideas on top of the MonetDB and PostgreSQL open source database systems. We conducted an initial set of experiments which showed that the overhead for using abstract expressions is roughly linear to the number of triples considered; performance is also affected by the characteristics of the dataset, such as the size and depth of class and property hierarchies as well as the considered concrete policy.
The talk was delivered by Martin Kersten from CWI, Netherland, at the workshop on "Global Scientific Data Infrastructures: The Findability Challenge", held in Taormina, Sicily, Italy, on May 10-11, 2012.
This talk was given by FORTH, Greece, at the European Data Forum (EDF) 2012 took place on June 6-7, 2012 in Copenhagen (Denmark) at the Copenhagen Business School (CBS).
Abstract:
Given the increasing amount of sensitive RDF data available on the Web, it becomes increasingly critical to guarantee secure access to this content. Access control is complicated when RDFS inference rules and other dependencies between access permissions of triples need to be considered; this is necessary, e.g., when we want to associate the access permissions of inferred triples with the ones that implied it. In this paper we advocate the use of abstract provenance models that are defined by means of abstract tokens operators to support fine grained access control for RDF graphs. The access label of a triple is a complex expression that encodes how said label was produced (i.e., the triples that contributed to its computation). This feature allows us to know exactly the effects of any possible change, thereby avoiding a complete recomputation of the labels when a change occurs. In addition, the same application can choose to enforce different access control policies or, different applications can enforce different policies on the same data, avoiding the recomputation of the label of a triple. Preliminary experiments have shown the applicability and benefits of our approach.
This talk has been given at the 13th International Conference on Principles of Knowledge Representation and Reasoning (KR 2012) to be held in Rome, Italy, June 10-14, 2012 by Ilias Tahmazidis (FORTH).
Abstract:
We are witnessing an explosion of available data from the Web, government authorities, scientific databases, sensors and more. Such datasets could benefit from the introduction of rule sets encoding commonly accepted rules or facts, application- or domain-specific rules, commonsense knowledge etc. This raises the question of whether, how, and to what extent knowledge representation methods are capable of handling the vast amounts of data for these applications. In this paper, we consider nonmonotonic reasoning, which has traditionally focused on rich knowledge structures. In particular, we consider defeasible logic, and analyze how parallelization, using the MapReduce framework, can be used to reason with defeasible rules over huge data sets. Our experimental results demonstrate that defeasible reasoning with billions of data is performant, and has the potential to scale to trillions of facts.
The presentation was delivered during the 1st International Conference on Health Information Science (HIS 2012) on April 9th, 2012 in Beijing, China.
Abstract:
In cytomics bookkeeping of the data generated during lab experiments is crucial. The current approach in cytomics is to conduct High-Throughput Screening (HTS) experiments so that cells can be tested under many different experimental conditions. Given the large amount of different conditions and the readout of the conditions through images, it is clear that the HTS approach requires a proper data management system to reduce the time needed for experiments and the chance of man-made errors. As different types of data exist, the experimental conditions need to be linked to the images produced by the HTS experiments with their metadata and the results of further analysis. Moreover, HTS experiments never stand by themselves, as more experiments are lined up, the amount of data and computations needed to analyze these increases rapidly. To that end cytomic experiments call for automated and systematic solutions that provide convenient and robust features for scientists to manage and analyze their data. In this paper, we propose a platform for managing and analyzing HTS images resulting from cytomics screens taking the automated HTS workflow as a starting point. This platform seamlessly integrates the whole HTS workflow into a single system. The platform relies on a modern relational database system to store user data and process user requests, while providing a convenient web interface to end-users. By implementing this platform, the overall workload of HTS experiments, from experiment design to data analysis, is reduced significantly. Additionally, the platform provides the potential for data integration to accomplish genotype-to-phenotype modeling studies.
Key Trends Shaping the Future of Infrastructure.pdfCheryl Hung
Keynote at DIGIT West Expo, Glasgow on 29 May 2024.
Cheryl Hung, ochery.com
Sr Director, Infrastructure Ecosystem, Arm.
The key trends across hardware, cloud and open-source; exploring how these areas are likely to mature and develop over the short and long-term, and then considering how organisations can position themselves to adapt and thrive.
"Impact of front-end architecture on development cost", Viktor TurskyiFwdays
I have heard many times that architecture is not important for the front-end. Also, many times I have seen how developers implement features on the front-end just following the standard rules for a framework and think that this is enough to successfully launch the project, and then the project fails. How to prevent this and what approach to choose? I have launched dozens of complex projects and during the talk we will analyze which approaches have worked for me and which have not.
Smart TV Buyer Insights Survey 2024 by 91mobiles.pdf91mobiles
91mobiles recently conducted a Smart TV Buyer Insights Survey in which we asked over 3,000 respondents about the TV they own, aspects they look at on a new TV, and their TV buying preferences.
Transcript: Selling digital books in 2024: Insights from industry leaders - T...BookNet Canada
The publishing industry has been selling digital audiobooks and ebooks for over a decade and has found its groove. What’s changed? What has stayed the same? Where do we go from here? Join a group of leading sales peers from across the industry for a conversation about the lessons learned since the popularization of digital books, best practices, digital book supply chain management, and more.
Link to video recording: https://bnctechforum.ca/sessions/selling-digital-books-in-2024-insights-from-industry-leaders/
Presented by BookNet Canada on May 28, 2024, with support from the Department of Canadian Heritage.
The Art of the Pitch: WordPress Relationships and SalesLaura Byrne
Clients don’t know what they don’t know. What web solutions are right for them? How does WordPress come into the picture? How do you make sure you understand scope and timeline? What do you do if sometime changes?
All these questions and more will be explored as we talk about matching clients’ needs with what your agency offers without pulling teeth or pulling your hair out. Practical tips, and strategies for successful relationship building that leads to closing the deal.
Slack (or Teams) Automation for Bonterra Impact Management (fka Social Soluti...Jeffrey Haguewood
Sidekick Solutions uses Bonterra Impact Management (fka Social Solutions Apricot) and automation solutions to integrate data for business workflows.
We believe integration and automation are essential to user experience and the promise of efficient work through technology. Automation is the critical ingredient to realizing that full vision. We develop integration products and services for Bonterra Case Management software to support the deployment of automations for a variety of use cases.
This video focuses on the notifications, alerts, and approval requests using Slack for Bonterra Impact Management. The solutions covered in this webinar can also be deployed for Microsoft Teams.
Interested in deploying notification automations for Bonterra Impact Management? Contact us at sales@sidekicksolutionsllc.com to discuss next steps.
Software Delivery At the Speed of AI: Inflectra Invests In AI-Powered QualityInflectra
In this insightful webinar, Inflectra explores how artificial intelligence (AI) is transforming software development and testing. Discover how AI-powered tools are revolutionizing every stage of the software development lifecycle (SDLC), from design and prototyping to testing, deployment, and monitoring.
Learn about:
• The Future of Testing: How AI is shifting testing towards verification, analysis, and higher-level skills, while reducing repetitive tasks.
• Test Automation: How AI-powered test case generation, optimization, and self-healing tests are making testing more efficient and effective.
• Visual Testing: Explore the emerging capabilities of AI in visual testing and how it's set to revolutionize UI verification.
• Inflectra's AI Solutions: See demonstrations of Inflectra's cutting-edge AI tools like the ChatGPT plugin and Azure Open AI platform, designed to streamline your testing process.
Whether you're a developer, tester, or QA professional, this webinar will give you valuable insights into how AI is shaping the future of software delivery.
JMeter webinar - integration with InfluxDB and GrafanaRTTS
Watch this recorded webinar about real-time monitoring of application performance. See how to integrate Apache JMeter, the open-source leader in performance testing, with InfluxDB, the open-source time-series database, and Grafana, the open-source analytics and visualization application.
In this webinar, we will review the benefits of leveraging InfluxDB and Grafana when executing load tests and demonstrate how these tools are used to visualize performance metrics.
Length: 30 minutes
Session Overview
-------------------------------------------
During this webinar, we will cover the following topics while demonstrating the integrations of JMeter, InfluxDB and Grafana:
- What out-of-the-box solutions are available for real-time monitoring JMeter tests?
- What are the benefits of integrating InfluxDB and Grafana into the load testing stack?
- Which features are provided by Grafana?
- Demonstration of InfluxDB and Grafana using a practice web application
To view the webinar recording, go to:
https://www.rttsweb.com/jmeter-integration-webinar
Kubernetes & AI - Beauty and the Beast !?! @KCD Istanbul 2024Tobias Schneck
As AI technology is pushing into IT I was wondering myself, as an “infrastructure container kubernetes guy”, how get this fancy AI technology get managed from an infrastructure operational view? Is it possible to apply our lovely cloud native principals as well? What benefit’s both technologies could bring to each other?
Let me take this questions and provide you a short journey through existing deployment models and use cases for AI software. On practical examples, we discuss what cloud/on-premise strategy we may need for applying it to our own infrastructure to get it to work from an enterprise perspective. I want to give an overview about infrastructure requirements and technologies, what could be beneficial or limiting your AI use cases in an enterprise environment. An interactive Demo will give you some insides, what approaches I got already working for real.
GDG Cloud Southlake #33: Boule & Rebala: Effective AppSec in SDLC using Deplo...James Anderson
Effective Application Security in Software Delivery lifecycle using Deployment Firewall and DBOM
The modern software delivery process (or the CI/CD process) includes many tools, distributed teams, open-source code, and cloud platforms. Constant focus on speed to release software to market, along with the traditional slow and manual security checks has caused gaps in continuous security as an important piece in the software supply chain. Today organizations feel more susceptible to external and internal cyber threats due to the vast attack surface in their applications supply chain and the lack of end-to-end governance and risk management.
The software team must secure its software delivery process to avoid vulnerability and security breaches. This needs to be achieved with existing tool chains and without extensive rework of the delivery processes. This talk will present strategies and techniques for providing visibility into the true risk of the existing vulnerabilities, preventing the introduction of security issues in the software, resolving vulnerabilities in production environments quickly, and capturing the deployment bill of materials (DBOM).
Speakers:
Bob Boule
Robert Boule is a technology enthusiast with PASSION for technology and making things work along with a knack for helping others understand how things work. He comes with around 20 years of solution engineering experience in application security, software continuous delivery, and SaaS platforms. He is known for his dynamic presentations in CI/CD and application security integrated in software delivery lifecycle.
Gopinath Rebala
Gopinath Rebala is the CTO of OpsMx, where he has overall responsibility for the machine learning and data processing architectures for Secure Software Delivery. Gopi also has a strong connection with our customers, leading design and architecture for strategic implementations. Gopi is a frequent speaker and well-known leader in continuous delivery and integrating security into software delivery.
State of ICS and IoT Cyber Threat Landscape Report 2024 previewPrayukth K V
The IoT and OT threat landscape report has been prepared by the Threat Research Team at Sectrio using data from Sectrio, cyber threat intelligence farming facilities spread across over 85 cities around the world. In addition, Sectrio also runs AI-based advanced threat and payload engagement facilities that serve as sinks to attract and engage sophisticated threat actors, and newer malware including new variants and latent threats that are at an earlier stage of development.
The latest edition of the OT/ICS and IoT security Threat Landscape Report 2024 also covers:
State of global ICS asset and network exposure
Sectoral targets and attacks as well as the cost of ransom
Global APT activity, AI usage, actor and tactic profiles, and implications
Rise in volumes of AI-powered cyberattacks
Major cyber events in 2024
Malware and malicious payload trends
Cyberattack types and targets
Vulnerability exploit attempts on CVEs
Attacks on counties – USA
Expansion of bot farms – how, where, and why
In-depth analysis of the cyber threat landscape across North America, South America, Europe, APAC, and the Middle East
Why are attacks on smart factories rising?
Cyber risk predictions
Axis of attacks – Europe
Systemic attacks in the Middle East
Download the full report from here:
https://sectrio.com/resources/ot-threat-landscape-reports/sectrio-releases-ot-ics-and-iot-security-threat-landscape-report-2024/
Let's dive deeper into the world of ODC! Ricardo Alves (OutSystems) will join us to tell all about the new Data Fabric. After that, Sezen de Bruijn (OutSystems) will get into the details on how to best design a sturdy architecture within ODC.
Essentials of Automations: Optimizing FME Workflows with ParametersSafe Software
Are you looking to streamline your workflows and boost your projects’ efficiency? Do you find yourself searching for ways to add flexibility and control over your FME workflows? If so, you’re in the right place.
Join us for an insightful dive into the world of FME parameters, a critical element in optimizing workflow efficiency. This webinar marks the beginning of our three-part “Essentials of Automation” series. This first webinar is designed to equip you with the knowledge and skills to utilize parameters effectively: enhancing the flexibility, maintainability, and user control of your FME projects.
Here’s what you’ll gain:
- Essentials of FME Parameters: Understand the pivotal role of parameters, including Reader/Writer, Transformer, User, and FME Flow categories. Discover how they are the key to unlocking automation and optimization within your workflows.
- Practical Applications in FME Form: Delve into key user parameter types including choice, connections, and file URLs. Allow users to control how a workflow runs, making your workflows more reusable. Learn to import values and deliver the best user experience for your workflows while enhancing accuracy.
- Optimization Strategies in FME Flow: Explore the creation and strategic deployment of parameters in FME Flow, including the use of deployment and geometry parameters, to maximize workflow efficiency.
- Pro Tips for Success: Gain insights on parameterizing connections and leveraging new features like Conditional Visibility for clarity and simplicity.
We’ll wrap up with a glimpse into future webinars, followed by a Q&A session to address your specific questions surrounding this topic.
Don’t miss this opportunity to elevate your FME expertise and drive your projects to new heights of efficiency.
Essentials of Automations: Optimizing FME Workflows with Parameters
The Web of Things
1. The web of things
CAROLINA FORTUNA AND MARKO GROBELNIK
CAROLINA.FORTUNA@IJS.SI MARKO.GROBELNIK@IJS.SI
JOŽEF STEFAN INSTITUTE, LJUBLJANA, SLOVENIA
HTTP://SENSORLAB.IJS.SI
2. A case for the web of things
Facts:
• March 11, 2011: Tōhoku
earthquake and tsunami in
Japan
• Nuclear reactors were affected:
explosions and radioactive
pollution
• Confusing information about the
levels of radioactivity in the
media http://en.wikipedia.org/wiki/2011_Tōhoku_earthquake_and_tsunami
• Radiation level maps based on
Geiger counter data started to
appear
2
http://wikileaksreputationcrisis.wordpress.com/2011/03/13/fukushima-nuclear-crisis-media-coverage-evolution/
6. Outline
Part I. Motivation & background
Part II. Technology and tools for exploiting the WoT
Part III. Demos, tools & research directions
6
7. Part I. Motivation & background
outline
Web Of Things
• What is it? What problems can it solve?
Architectural considerations
• How it looks like? What are its components?
The “Things”
• What are the ingredients?
The “Glue”
• How do things stick together?
Applications and services
• What can be built on top of it?
Quick start recipes
• How does the “Hello World!” look like?
7
8. How Web-of-things fits on the
map?
Description Technologies
Web 1.0 Static HTML pages HTML, HTTP
(web as we first learned it)
Web 1.5 Dynamic HTML content Client side (JavaScript, DHTML,
(web as we know it) Flash, …), server side (CGI, PHP,
Perl, ASP/.NET, JSP, …)
Web 2.0 Participatory information weblogs, social bookmarking, social
sharing, interoperability, user- tagging, wikis, podcasts, RSS feeds,
centered design, and many-to-many publishing, web
collaboration on the World Wide services, …
Web (web of people) URI, XML, RDF, OWL, SparQL, …
Web 3.0 …definitions vary a lot – from http://en.wikipedia.org/wiki/Web_3.0#
Full Semantic Web to AI Web_3.0
(web as we would need it)
Web of Everyday devices and objects Well-accepted and understood
are connected by fully standards and blueprints (such as
Things integrating them to the Web. URI, HTTP, REST, Atom, etc.)
(web as we would like it) http://en.wikipedia.org/wiki/Web_of_T
8
hings
9. Transition towards machine
generated information
Past:
“manual input of information by 500 million or a billion
users”1
Future:
“new information can be created automatically without
human data entry… the next generation of sensor
networks can monitor our environment and deliver
relevant information – automatically.1
9
1Pete Hartwell, How a Physically Aware Internet Will Change the World, Mashable, October 13, 2010.
10. Web of things use cases
Motivated by an increased interest in automatic
management of large systems
• Commercial use cases1 (non-exhaustive list):
• Power grids
• Transport systems
• Water distribution
• Logistics
• Industrial automation
• Health
• Environmental intelligence
• Academic
• Distributed sensing infrastructure
Alternative solutions
Ethical issues and abuse1
10
1Ludwig Siegele, A special report on smart systems, The Economist, Nov. 4 2010.
11. Commercial use case: Power
grids1
“If the power grid in America alone were just 5% more
efficient, it would save greenhouse emissions equivalent to
53m cars (IBM).“
Solutions:
• demand pricing – 10-15% peak hour demand cut
• Energy consumption monitoring with smart meters
encourage shifting consumption to off-peak hours through
personalized price plans
• demand response – extra 10-15% cut
• Save energy by sensing and actuation: smart meters +
actuators turn off air-conditioning systems when demand
for electricity is high
11
1Ludwig Siegele, A special report on smart systems, The Economist, Nov. 4 2010.
12. Commercial use case: Transport
systems1
“In 2007 its congested roads cost the country 4.2 billion working
hours and 10.6 billion litres of wasted petrol (Texas Transportation
Institute)” 1
Solutions:
• Charging for city centers and busy roads
• London, Stockholm, Singapore, etc.
• Green wave
• Adjustment of traffic lights to suit the flow of vehicles
• Automatic parking guidance
• Singapore is developing a parking-guidance system (cars
looking for somewhere to park are now a big cause of
congestion).
• Real-time dynamic pricing
• Singapore
12
1Ludwig Siegele, A special report on smart systems, The Economist, Nov. 4 2010.
13. Commercial use case: Water
distribution1
Utilities around the world lose between 25% and 50% of
treated water to leaks (Lux Research).
Solutions:
• Renew infrastructure
• London, UK, Thames Water was losing daily nearly
900m litres of treated water and had to fix 240 leaks
due to aging infrastructure1.
• Install sensors for monitoring the pipe system
• Automatically detect leaks fast (instead of customers
calling and reporting leaks). London, Singapore, etc.
• Automate the management and maintenance process
• Automatic scheduling of work crews and automatic
alerts (i.e. text messages to affected customers)
13
1Ludwig Siegele, A special report on smart systems, The Economist, Nov. 4 2010.
14. Commercial use case: Logistics
Cargo loss due to theft or damage is significant, estimates that the
global financial impact of cargo loss exceeds $50 billion annually
(The National Cargo Security Council)1. The cost is eventually
passed to the customers.
Solutions:
• Automatic track and trace
• Tag and trace their wares all along the supply chain
(RFIDs and sensors) - and consumers to check where they
come from (i.e. FoodLogiQ, SenseAware)2
• Event detection and mitigation
• Detect events that affect the cargo (i.e. delay, inappropriate
transport conditions) and minimize damage (i.e. re-route)
14
1 Tom Hayes, The Full Cost of Cargo Losses
2Ludwig Siegele, A special report on smart systems, The Economist, Nov. 4 2010.
15. Commercial use case:
Industrial automation
The integration gap between the production and business processes comes at a
high cost, especially in multi-site enterprises.
Solutions:
• Automatic monitoring of the production process
• Monitor the devices on the production floor (i.e. robotic arm overheating)1
• Automatic event detection and notification
• Process the measurements, detect anomalies and notify the business
process (i.e. production at site interrupted, relocate)
• Productivity comparison
• Machines equipped with sensors allow productivity comparison based on
sensed data (i.e. Heidelberger Druckmaschinen)2
• Dynamic production optimization
• 5% increase in paper production by automatically adjusting the shape and
intensity of the flames that heat the kilns for the lime used to coat paper2
15
1SOCRADES project, http://www.socrades.eu/
2Ludwig Siegele, A special report on smart systems, The Economist, Nov. 4 2010.
16. Commercial use case: Health
In health care, sensors and data links offer possibilities for monitoring
a patient‟s behavior and symptoms in real time and at relatively low
cost.1
Solutions:
• Patient monitoring
• When suffering from chronic illnesses can be outfitted with
sensors to continuously monitor their conditions as they go
about their daily activities.
• Asthma, diabetes, heart-failure
• Extended healthcare for elders
• Needs to extend from hospital to home care to ensure cost
efficient provisioning and improve quality of living (ambient
assisted living).
• Fall detection, emergency call, user localization, hazard
monitoring (toxic gases, water, fire)
• Fitness monitoring for personalized fitness scenario
16
17. Commercial use case:
Environmental intelligence
Data from large number of sensors deployed in
infrastructure (such as roads) or over other area of interest
(such as agriculture fields) can give decision makers a real-
time awareness on the observed phenomena and events.
Solutions:
• Remote monitoring of cultures, soil moisture, insect
infestations or disease infections
• Irrigation and pesticide spraying in precision agriculture
• Livestock monitoring for maximizing production (meat,
milk, eggs) and achieve higher reproduction rates
17
18. Academic: Distributed sensing
infrastructure
Scientists defines their hypothesis, collect the necessary
data and then try to validate the hypothesis. Manually
collected data is generally expensive to get1 while access to
large datasets is generally restricted by the owners.
Solution:
• Deploy sensors in small and medium size testbeds
• On a riverbed, volcano, mountain, etc.
• Build an open data publishing and sharing platform which
can federate the testbeds
• Share your data with others so that also others share it
with you
18
1MattWelsh, Sensor Network for the Sciences, Communications of the ACM, November 2010, Vol.
53, No. 11.
19. Use Cases: Alternative solutions
Several of the previously mentioned use cases can be
solved by other approaches, crowdsourcing being on
the of most obvious.
Roadify, Waze are using real time traffic information
reported by participants in traffic may solve traffic
congestion problems
• Human “sensor” reporting and consuming via
handheld terminals
• Costs and benefits will determine the best
solution.
19
20. Use Cases: Ethical issues and
abuse1
• For every technology created for a noble purpose,
less noble applications can be found and vice-versa.
• Smart systems may be used for privacy invading
applications, for restricting the liberty of people, for
creating chaos, misinformation, false alarms, etc.
20
1Ludwig Siegele, A special report on smart systems, The Economist, Nov. 4 2010.
21. Part I. Motivation & background
outline
Web Of Things
• What is it? What problems can it solve?
Architectural considerations
• How it looks like? What are its components?
The “Things”
• What are the ingredients?
The “Glue”
• How do things stick together?
Applications and services
• What can be built on top of it?
Quick start recipes
• How does the “Hello World!” look lilke?
21
22. Architectural considerations
Applications Traffic today app
Web publishing RSS feed
Data processing Real time event detection software
Data storage Utility company data center
Data collection Utility company server
Embedded software Proprietary firmware
Communication technology 6LoWPAN
Embedded device Microcontroller with sensors
22
Physical object Public light pole
23. Architectural considerations
Applications MyHome status page
Web publishing Html
Data collection Home computer
Embedded software RTOS
Communication technology Bluetooth
Device Microcontroller with sensors
23
24. Main Components of a vertical
Apps and Applications Traffic today app
Services
Web publishing RSS feed
Data processing Real time event detection software
Data storage Utility company data center
“Glue” Data collection Utility company server
Embedded software Proprietary firmware
Communication technology 6LoWPAN
Embedded device Microcontroller with sensors
24
“Things”
Physical object Public light pole
25. Part I. Motivation & background
outline
Web Of Things
• What is it? What problems can it solve?
Architectural considerations
• How it looks like? What are its components?
The “Things”
• What are the ingredients?
The “Glue”
• How do things stick together?
Applications and services
• What can be built on top of it?
Quick start recipes
• How does the “Hello World!” look lilke?
25
26. The “things”
Embedded device Microcontroller with sensors
“Things”
Physical object Public light pole
= embedded device + physical object (smart public light pole)
= sensor node (SunSpot, MicaZ, Sensinode, VSN, WASPMote, etc)
= mobile phone
= a set of sensor nodes and/or embedded device + physical things which
are abstracted as one “thing” (large water tank + set of sensor nodes
monitoring water level, temperature and purity)
26
27. Definitions of components related
to things
physical object
• An object built for fulfilling other tasks than computing
• Coffee mug, show, light pole, washing machine,
electric oven, fruit press, water tank
sensor
• a material or passive device which changes its
(conductive) properties according to a physical stimulus
• Thermo couple (temp->voltage), photo resistor (light-
>resistance variations), etc.
27
28. Definitions of components related
to things
embedded system
• A simple or complex system built into a physical device to perform
dedicated functions and enhance the functionality through
computation. It features actuators and/or sensors.
• Microprocessor, microcontroller, DSP, FPGA or PLC based
system built into a variety devices, including washing
machines, electric ovens, industrial robots etc.
sensor node
• A computing and communicating device equipped with sensors
and possibly actuators whose functionality revolves around
measuring, reporting and possibly actuating. It can be standalone
or embedded into physical objects.
• Typically a device composed of microcontroller, power supply,
communication interface and sensors/actuators.
28
29. Sensor nodes and their structure
= Sensors + Microcontroller + Communication Module
+ Power Source
Power Source
Comm. Module
CPU & Memory
Sensor (Actuator)
Classification:
• adapted/augmented general-purpose computers
• embedded sensor modules
29
• system on chip (SoC) solutions
30. Common types of sensors found
in the literature
photodiode speaker
seismic ultrasonic vibration
1% motion 1% sound 1%
button switch 1% 1%
2%
pressure LCD 2%
2% 2% irDA
temperature
2%
21%
ECG
2% camera
N axis 4%
N axis
magnetometer
accelerometer
4%
13%
microphone
4%
light
acoustic / RGB 10%
sound LED
GPS
5% 8%
5%
30
humidity
6%
31. Existing solutions for sensor
nodes
Solutions developed in research community or by groups of
enthusiasts.
• Combine HW components from different produces (for radio, it seems that TI chips
are used in vast majority of ‚products„).
• open-source experimental software such as Contiki OS, TinyOS (& NesC), Nano-
RK, FreakZ stack (except for Arduino/Libelium where OEM radio is used whilst
crowdsourcing is happening on the level of easy microcontroller programming.
• open source development tools are usually used.
Commercial solutions from particular producers (TI, Atmel,
Microchip,…)
• composed of components sold by produces themselves.
• development kits can usually be used with proprietary integrated
development environments and allow compiling of certified stacks (most
often Zigbee).
Modules assembled by companies trying to sell software
solutions
• Sun is in this case promoting the use of Java for sensor networks
• Sensinode is selling one of the 6LoWPAN ports.
31
32. Examples of the three categories
of solutions
• FreakLabs Chibi
• Memsic (ex. Crossbow) MICAz/ MICA2, IRIS,
TelosB, eKo kit
• CMU FireFly
• GINA
• Arduino/Libelium (XBee)
• TI eZ430-RF2500
• Microchip PICDEM Z
• Atmel RZ600
• Ember InSight
• Jennic JN5148
• SunSPOT
• Sensinode NanoSensor
32
33. Versatile Sensor Node
Built at JSI, used for some of the demos presented in
Part 3 of the tutorial.
Modular platform for WSN (VSCore + VSRadio +
VSApplication + VSPower = VSN)
• High processing power and low energy consumption
• Sensor node & gateway (multi-tier / IP) capability
• Battery, solar or external power supply
• Re-configurable radio
33
In collaboration with ISOTEL d.o.o.
34. Versatile Sensor Node modules
VSCore
• Analog and digital sensor/actuator interfaces
• Possibility to use operating system (real-time, event-driven)
• Multiple expansion options
• Open C/C++ code libraries
• Onboard memory
VSRadio
• 300-900 MHz, 2.4 GHz radio
interface (all ISM bands)
• ZigBee, 6LoWPAN and other
IEEE 802.15.4 based solutions
VSExpansion
• Bluetooth, Wi-Fi, Ethernet,
GSM/GPRS
• Sensors/actuators
34
• PoE
35. Why WSNs are different?
• WSNs are destined to wide variety of applications.
• Asymmetric, highly directional information flow (data
fusion).
• Energy is highly constrained.
• WSN may have huge amount of nodes.
• Application run-time is extremely long.
• Data aggregation (and network control) may be
centralized, decentralized or hierarchical.
• Measurements reporting can be periodical, triggered by
external event or on request by sink node.
35
36. Sensor nodes vs computing
devices
Diminishing
maintenance costs:
• Integrating sensors
into personal
computing devices
such as
phones/laptops
• Efficient remote
configuration and
management
• Disposable
36
Personal devices Sensor nodes
38. Part I. Motivation & background
outline
Web Of Things
• What is it? What problems can it solve?
Architectural considerations
• How it looks like? What are its components?
The “Things”
• What are the ingredients?
The “Glue”
• How do things stick together?
Applications and services
• What can be built on top of it?
Quick start recipes
• How does the “Hello World!” look lilke?
38
39. The “glue”
The communication System level programming
(macro-programming)
• The communication medium
• distributed/centralized
• The network storage and retrieval
Node centric programming • content management
• operating system
• virtual machine
Data processing Real time event detection software
Data storage Utility company data center
“Glue” Data collection Utility company server
Embedded software Proprietary firmware
39
Communication technology 6LoWPAN
40. Communication medium
Wireless and/or Wired
point-to-point or point-to-
multipoint
D
B, C and D in the coverage
range of A
• When A sends a
message, B, C and D
receive it A
A, B in the range of C
• When C sends a
B
message, only A and B
receive it
C
40
41. Communication medium
Wireless
• Mostly performed in unlicensed bands according to open
standards
• Standard: IEEE 802.15.4 - Low Rate WPAN
• 868/915 MHz bands with transfer rates of 20 and 40 kbit/s, 2450 MHz
band with a rate of 250 kbit/s
• Technology: ZigBee, WirelessHART
• Standard: ISO/IEC 18000-7 (standard for active RFID)
• 433 MHz unlicensed spectrum with transfer rates of 200 kbit/s
• Technology: Dash7
• Standard: IEEE 802.15.1 – High Rate WPAN
• 2.40 GHz bands with transfer rates of 1-24 Mbit/s
• Technology: Bluetooth (BT 3.0 Low Energy Mode)
• Standard: IEEE 802.11x – WLAN
• 2.4, 3.6 and 5 GHz with transfer rates 15-150 Mbit/s
• Technology: Wi-Fi
41
42. Communication medium
Wireless
• Sometimes in licensed bands
• Standard: 3GPP – WMAN, WWAN cellular
communication
• 950 MHz, 1.8 and 2.1 GHz bands with data rate ranging
from 20 Kbit/s to 7.2 Mbit/s, depending on the release
• Technology: GPRS, HSPA
42
43. Communication medium
Wireless
• Sometimes according to proprietary standards and
protocols
• Z-Wave – for home automation
• 900 MHz band (partly overlaps with 900 MHz cellular) with data
rates of 9.6 Kbit/s or 40 Kbit/s
• ANT – for sportsmen and outdoor activity monitoring, owned
by Garmin
• 2.4 GHz and 1 Mbit/s data rates
• Wavenis – for M2M periodic low data rate communication
• 868 MHz, 915 MHz, 433 MHz with data rates from 4.8 Kbits/s to
100 Kbits/s
• most Wavenis applications communicate at 19.2 kbits/s.
• MiWi, SimpliciTI, Digi xxx, …
43
44. Communication medium
Wired
• Standard: IEEE 1901 - Power Line Communications
(PLC) standard used for transmitting data on a
conductor also used for electric power transmission
• Frequencies and data rates vary, >100 MHz, data rates of
up to 500 Mbit/s
• Technology: HomePlug
• Standard: ITU G.hn – PLC for home grids
• 100-200 MHz with data rate up to 1 Mbit/s
• Technology: HomePNA
• Standard: IEEE 802.3 – High speed LAN
• 10 Mbit/s – 100 Gbit/s
• Technology: Ethernet
44
45. Communication medium
Implementation of the technologies
• Traditionally HW
• Mostly HW + some SW
• Trend towards HW + mostly software
Communication
Protocol Stack Implementation
Standard
IEEE 802.15.4 “Implementation of IEEE 802.15.4 protocol stack for Linux”
ZigBee
Z-Stack, Open-ZB, FreakZ, Microchip Stack
IEEE 802.11 smxWiFi
“WirelessHART- Implementation and Evaluation on Wireless Sensors”,
WirelessHART “WirelessHART: Applying Wireless Technology in Real-Time Industrial Process
Control”
ISA100.11a NISA100.11a
45
Bluetooth TinyBT, Axis OpenBT, BlueZ, Affix
46. The network
The connections are
logical (typically multiple
physical hops). D
C can communicate with D
via A
A
C can communicate with D
via A or via C and A
B
C
46
47. The network
The network (or OSI Layer 3 abstraction) provides an
abstraction of the physical world.
• Devices which are not physically “connected” via the
communication medium can “talk” to each other
• At the network layer, only the devices and the links
between them can be seen, the communication medium
is hidden
• Communication protocol
• defines the functions that have to be implemented and services that
have to be provided by the parties involved in the information
exchange.
• In computer and sensor networks, protocols are organized as a stack
and the number of layers in the stack is standard specific.
47
48. The network
Global network level standard: IPv4 (towards IPv6)
Also a version for low power devices exists: 6LoWPAN.
It is unlikely that all things will eventually use a version of IP
• We foresee island of things implementing some kind of network
layer protocol
• Centralized: a central sink node collects all the data coming from
the “things” of the network
• Decentralized: Data aggregation is performed locally at each
“things” using only the measurements coming from neighbouring
“things”
• Hierarchical: Nodes are divided in hierarchical levels. Data move
from the lower levels (sensor nodes) to the higher ones (sink
nodes)
• The islands will be connected at higher levels of
abstraction
48
49. The network
Implementation of the technologies
• SW
• On the microcontroller on the communication interface
(system on chip (SoC) and CPU+ OEM radio devices)
• On the device‟s CPU (Microcontroller + PHY/MAC Radio
devices)
• Stand alone protocol stack vs compatible/integrated
with the OS
Communication
Protocol Stack Implementation
Standard
ZigBee
Z-Stack, Open-ZB, FreakZ, Microchip Stack
49
6LoWPAN NanoStack2.0, Mantus, μIPv6, BLIP
50. Node centric abstractions
• Operating System (OS)
• abstracts task synchronization and memory
management among others from the
programmer
• Virtual Machine (VM)
• another level of abstraction which further hides
hardware specific issues from the programmer,
for instance abstracting while loops with listeners
50
51. Embedded Operating system
• OS running on devices with restricted
functionality
• In the case of sensor nodes, there devices
typically also have limited processing capability
• Restricted to narrow applications
• industrial controllers, robots, networking gear,
gaming consoles, metering, sensor nodes…
• Architecture and purpose of embedded OS
changes as the hardware capabilities change
(i.e. mobile phones)
51
52. Embedded Operating system
Abstracts the hardware configuration, task
synchronization and memory management
•Example: web service with one while(1){
sensor and one actuator if(got_request()){
•Data from the sensor can be parse_request();
requested if(got_data_request())
•Actuator can be commanded send_data();
•Without an OS, all the program states if(got_command())
have to be manually prepared actuate();
}
Check request
if(time_for_measurement())
read_sensor();
Check Parse
measurement time }
Actuate
Read sensor
52
Send data
53. Embedded Operating system
Abstracts the hardware configuration, task
synchronization and memory management
while(1){
•What happens if the actuate function takes if(got_request()){
too much time? parse_request();
•The system won‟t respond to requests if(got_data_request())
send_data();
Example code: if(got_command())
void actuate(){ actuate()
actuate();
actuate_start(); }
delay(1000); if(time_for_measurement())
send_command1(); read_sensor();
delay(1000); }
Check request
send_command2();
delay(1000); Check Parse
measurement time
send_command3(); Actuate
}
53
Read sensor Send data
54. Embedded Operating system
Abstracts the hardware configuration, task
synchronization and memory management
•What happens if the actuate function takes
too much time?
•The system won‟t respond to requests
•Workaround is possible, but it needs a
Check request
lot of effort and it‟s error-prone
Parse
void actuate(){
actuate_start();
delay(1000); Set actuate
send_command1(); Check Check actuate Send data
delay(1000); measurement time
send_command2(); Actuate start
delay(1000); Read sensor Send command1
send_command3();
54
} Send command2
55. Embedded Operating system
Abstracts the hardware configuration, task
synchronization and memory management
•With an OS, switching between tasks is
simple Wait for request
PROCESS_THREAD(actuate){ Parse
while(1){ Send data
PROCESS_WAIT_EVENT();
actuate_init(); Wait for Send event
PROCESS_WAIT(1000); measurement time
send_command1(); Read sensor
PROCESS_WAIT(1000); Wait
send_command2();
PROCESS_WAIT(1000); Send command3 Actuate start
send_command3();
} Send command2
55
Send command1
}
56. Embedded OS Classification by
scheduling model
Event driven model (Contiki, TinyOS, SOS)
• No locking - only one event running at a time
• One stack – reused for every event handler
• Requires less memory
• Synchronous vs. asynchronous events
Thread driven model (FreeRTOS, eCOS, Nut/OS,
eCOS)
• Each thread has its own stack
• Thread stacks allocated at creation time
(Unused stack space wastes memory)
• Locking mechanisms - to prevent modifying
shared resources
56
57. Embedded OS classification by
system image
• Monolithic (TinyOS, FreeRTOS, eCOS, uC/OS-II, Nut/OS)
• One system image : (kernel) + modules + application
compiled together
• Efficient execution environment (optimization at
compilation)
• High energy costs for updating
• Modular (Contiki, SOS)
• Static image: (kernel) + loadable component images
• Lower execution efficiency (no global optimization at
compilation time)
• Updates are less expensive (smaller size) - energy and
time
57
59. Virtual machine
A virtual machine is a software implementation of a machine and
provides a level of abstraction over the physical machine.
VM for embedded systems
• Replace the operating system
• Add extra functionality to the operating system (memory management)
• Provide a friendlier application development environment
59
60. Classification of virtual machines
• System VM
• virtualize hardware resources and can run directly on
hardware.
• In embedded systems they implement functions of
the OS and completely replace it
• Squawk, .NET Micro
• Application (process) VM
• typically run on top of an OS as an application and
support a single process.
• Mate, Darjeeling, VM*, SwissQM, CVM, DVM
60
61. Virtual machine comparison
Multi
Name OS ASVM Platform Memory Supported PL
thread
1KB RAM 16KB ROM yes
Mate TinyOS no Rene2 and Mica TinyScript
7.5KB ROM, 600B RAM
With/without OS 300KB RAM 512MB of flash
.NET Micro No ? Imote2 yes C#
TinyOS memory
TinyOS, Contiki, Tnode,Tmote Sky,
Darjeeling No (?) 2K RAM Yes Java subset
FOS Fleck3/Fleck3B
With (Solaris,
Windows, MAC
SunSpots Core 80KB RAM
Squawk OS X, linux Yes ? yes Java mostly
Java Card 3.0 Libraries: 270 Kb flash
systems)
/without
Mica, ongoing work: Telos, 6kb code
VM* OS* yes XYZ, Stargate and handheld 200 bytes data no Java
devices (depends on the app req)
Subset of Java (37
33kb flash and 3kb SRAM(on
SwissQM TinyOS Yes Mica2 and tmote sky Yes instructions + 22
Mica2)
specific )
61
8 RAM
CVM Contiki
1344 ROM
62. Are virtual machines necessary?
• Trade-off between the resources needed and the
services they provide
• Advantage
• Reduce the distribution energy costs for software
updates
• VM code smaller than native machine code
• Simpler reprogramming process
• Disadvantage
• Additional overhead
• Increased time and memory requirements for execution
• Increased energy spent in interpreting the code
62
63. What happens with data?
Macro-programming abstractions
• Data, once generated, serve decision makers to
understand the observed environment
• To bring the data to decision maker, we need
several macro programming abstractions
• …this includes technologies like: conceptualization,
storage, stream mining, complex event detection,
anomaly detection
63
64. Macro-programming abstractions
• Semantic streams
• K. Whitehouse, F. Zhao, J. Liu, Semantic
Streams: a Framework for Composable
Semantic Interpretation of Sensor Data, 2005.
• TinyDB
• A Declarative Databse for Sensor Networks,
http://telegraph.cs.berkeley.edu/tinydb/
• Logical neighbourhoods
• L. Mottola, Programming Wireless Sensor
Networks: From Physical to Logical
Neighborhoods, PhD Thesis, 2009.
64
65. Part I. Motivation & background
outline
Web Of Things
• What is it? What problems can it solve?
Architectural considerations
• How it looks like? What are its components?
The “Things”
• What are the ingredients?
The “Glue”
• How do things stick together?
Applications and services
• What can be built on top of it?
Quick start recipes
• How does the “Hello World!” look lilke?
65
66. Apps and services
Apps and Applications Traffic today app
Services Web publishing RSS feed
Combine data, presentation or functionality from
several sources (mash-up) to create new services.
Things generate only part of the data sources
66
67. Applications and services
Military Agriculture
Smart infrastructures Environmental monitoring
Lighting
Electricity
Water Smart House Advertising
Gas Industrial Processes Marketing
Social Networks
Transportation eHealth
Logistics Safety Sport
Security Emergency
67
68. Part I. Motivation & background
outline
Web Of Things
• What is it? What problems can it solve?
Architectural considerations
• How it looks like? What are its components?
The “Things”
• What are the ingredients?
The “Glue”
• How do things stick together?
Applications and services
• What can be built on top of it?
Quick start recipes
• How does the “Hello World!” look like?
68
69. Programing the “things”
Complex and time consuming process
• tool chain: IDE, compiler, debugger
• microcontroller is programmed and executes the code
• radio chip is not programmed, but controlled by
microcontroller, usually via SPI which sets/reads
registers
• compiled code is loaded to the microcontroller using
bootloader or JTAG
• protocol stack may be precompiled and available
through API or available as library
• operating system (not needed for simple tasks)
• virtual machine (optional)
69
70. Decision process
Before starting, the following questions should be
answered:
What is the scope or application?
• Monitoring measurements?
What is the scenario?
• A thing with embedded web service?
• A set of things connected through a gateway?
What programming language?
• Options: C, nesC, Java. C#
What is the publishing infrastructure?
• None, custom, third party.
70
71. Embedded web service
What is the scope?
• Expose measurements as embedded web service.
What is the scenario?
Web
• SunSpot with embedded web service. Service
Thing
What programming language?
• Java.
What is the publishing infrastructure?
• None.
71
SunSpot, http://www.sunspotworld.com/
72. Embedded web service
Web
• this is the simplest scenario Service
• the easiest implementation SunSpot
assumes connecting the thing to an
IP enabled machine through which Non-IP
access to the embedded web
service can be provided from the Machine
(IP)
internet
• Request: IP
http://.../spot1/sensors/temperature
requests the resource User
“temperature” of the resource machine
“sensor” of “spot1”1 (IP)
1D. Guinard, V. Trifa, S. Karnouskos, P. Spiess, D. Savio, Interacting with GET http://IP:Port/service
72
the SOA-based Internet of Things: Discovery, Query, Selection and
On-Demand Provisioning of Web Services, IEEE Transactions on
Services Computing, Vol. 3, July-Sept 2010.
73. Publish measurements
What is the scope?
• Publish measurements on the web.
Web
What is the scenario? Service
• SunSpot. IP
• Pachube account, registered feed, API key.
What programming language? Thing
• Java.
What is the publishing infrastructure?
• Pachube.
SunSpot, http://www.sunspotworld.com/
73
Pachube, http://www.pachube.com/
74. Sunspot + Pachube
SunSpot
Non-IP Machine (IP
+ client
APP)
IP
Pachube
User IP
machine
SunSpot, http://www.sunspotworld.com/ (IP)
74
Pachube, http://www.pachube.com/
75. Publish measurements
What is the scope?
• Expose measurements as web service.
What is the scenario? Web
• Arduino Ethernet shield with board and Service
sensors. IP
• Pachube account, registered feed, API key.
What programming language?
Thing
• C.
What is the publishing infrastructure?
• Pachube.
Arduino, http://www.arduino.cc/ Pachube, http://www.pachube.com/
75
Pachube Client on Arduino, http://arduino.cc/en/Tutorial/PachubeCient
76. Arduino + Pachube
Arduino
Ethershield
IP
Pachube
User IP
machine
(IP)
76
Arduino, http://www.arduino.cc/ Pachube, http://www.pachube.com/
Pachube Client on Arduino, http://arduino.cc/en/Tutorial/PachubeCient
77. Publish measurements
What is the scope?
- Publish measurements on the web. Web
What is the scenario? Service
Machine
- SunSpot (and/or Arduino).
- GSN installation and adequate wrapper. (non-) IP
What programming language?
- Java (and/or C). Thing
What is the publishing infrastructure?
- GSN.
SunSpot, http://www.sunspotworld.com/
77
Global Sensor Network, http://apps.sourceforge.net/trac/gsn/
78. Thing + GSN
User
machine
(IP)
IP
Web
Service
Machine
(non-) IP
Arduino SunSpot
78
http://gsn.ijs.si/
79. How to start?
Do you want to work with “things” that are under your
direct control?
Things:
• Easy to use with a wide community support are
Arduino and SunSpot.
• Crossbow, Libellium, Sensinode, etc. are also
possible solutions but may require more effort.
• For very specific solutions you may need to go for
hardware design.
79
80. How to start?
Do you want to just publish the data?
Solutions:
• Pachube is straightforward but functionality is
limited. There are various types of fee based
accounts which offer additional functionality.
• GSN is free and can be customized, the code is
open source.
• Sensorpedia, Sensor.Network and other solutions
are still in early stages.
80
81. Summary
The concept of Web of Things was discussed
A list of relevant use cases and application areas
• Power grids
• Transport systems
• Water distribution
• Logistics
• Industrial automation
• Health
• Environmental intelligence
Architectural considerations and possible components of vertical
systems were discussed and the components classified in:
• The “Things”
• The “Glue”
• Apps & Services
81
82. Summary
A decision process for how to start setting up a Web of
Things system
• Programming things is time consuming
Quick start scenarios were presented in increasing
order of complexity
• Things with embedded web services
• Things to an existing data management
infrastructure
• Things to self deployed data management
infrastructure
82
83. Outline
Part I. Motivation & background
Part II. Technology and tools for exploiting the WoT
Part III. Demos, Tools & Research directions
83
84. Outline
Part II. Technology and tools for WoT data
Information infrastructure for “Web of Things”
Conceptualization of sensors domain
Stream Data Processing
Stream Mining
Complex Event Processing
Anomaly Detection
84
86. Why we need WoT?
…the key objective is to make decision maker more
efficient by understanding observed environment
Sensor network Decision maker
86
87. Why we need WoT?
…the key objective is to make decision maker more efficient by
understanding observed environment
To achieve this, we need to introduce several information layers
between sensor setup and decision maker:
Sensor network Conceptualization Streaming Stream Mining; Decision maker
87
(ontology) Storage Complex Events;
Anomaly Detection
88. Outline of this part of the talk
In this part we will review approaches on
• How to conceptualize sensor domain?
• How to store streaming data?
• How to perform mining on streaming data?
• How to detect complex events?
• How to detect anomalies?
88
91. Sensor ontologies
Several ontologies
are covering
sensor domain
• …most of them
only parts
W3C Semantic
Sensor Network
(SSN)
Ontology (next
slide) is an attempt
to cover complete
domain
http://lists.w3.org/Archives/Public/public-xg-ssn/2009Aug/att-0037/SSN-XG_StateOfArt.pdf
93. So, how does a value look like?
Having all the semantic infrastructure in place, how an
observed value is encoded in SSN?
The observed value
93
http://www.w3.org/2005/Incubator/ssn/wiki/Main_Page
95. Stream data processing
Applications that require real-time processing of high-
volume data steams are pushing the limits of
traditional data processing infrastructures
In the following slides we present requirements that a
system…
• …based on the paper “The 8 Requirements of
Real-Time Stream Processing” by Stonebraker,
Çetintemel, Zdonik; ACM SIGMOD Record Volume
34 Issue 4
95
96. Eight rules for stream processing
(1/2)
Rule 1: Keep the Data Moving
• Processing messages “in-stream”, without requirements
to store them; ideally the system should also use an
active (i.e., non-polling)
Rule 2: Query using SQL on Streams
• High-level SQL like language with built-in extensible
stream oriented primitives and operators
Rule 3: Handle Stream Imperfections
• Dealing with stream “imperfections”, including missing
and out-of-order data, which are commonly present in
real-world data streams
Rule 4: Generate Predictable Outcomes
96
http://www.complexevents.com/2006/06/30/the-eight-rules-of-real-time-stream-processing/
97. Eight rules for stream processing
(2/2)
Rule 5: Integrate Stored and Streaming Data
• Combining stored with live streaming data
Rule 6: Guarantee Data Safety and Availability
• Integrity of the data maintained at all times, despite
failures
Rule 7: Partition and Scale Applications Automatically
• Distribute its processing across multiple processors and
machines to achieve incremental scalability
Rule 8: Process and Respond Instantaneously
• Minimal-overhead execution engine to deliver real-time
response
97
http://www.complexevents.com/2006/06/30/the-eight-rules-of-real-time-stream-processing/
103. Complex Event Processing
Application Development
1. Defining event sources and event targets (sinks)
2. Creating an input adapter to read the events from
the source into the CEP server
3. Creating an output adapter to consume the
processed events for submission to the event
targets
4. Creating the query logic required to meet your
business objectives
1. binding the query to the adapters at runtime, and
2. to instantiate the query in the CEP server
103
http://msdn.microsoft.com/en-us/sqlserver/ee476990
104. Examples of Queries in
Microsoft StreamInsight (1/2)
Filtering of events
• from e in inputStream where e.value < 10 select e;
Calculations to introduce additional event properties
• from e in InputStream select new MeterWattage
{wattage=(double)e.Consumption / 10};
Grouping events
• from v in inputStream group v by v.i % 4 into eachGroup
from window in eachGroup.Snapshot() select new {
avgNumber = window.Avg(e => e.number) };
Aggregation
• from w in inputStream.Snapshot() select new { sum =
w.Sum(e => e.i), avg = w.Avg(e => e.f), count =
w.Count() };
104
http://msdn.microsoft.com/en-us/sqlserver/ee476990
105. Examples of Queries in Microsoft
StreamInsight (2/2)
Identifying top N candidates
• (from window in inputStream.Snapshot() from e in
window orderby e.f ascending, e.i descending select
e).Take(5);
Matching events from different streams
• from e1 in stream1 join e2 in stream2 on e1.i equals e2.i
select new { e1.i, e1.j, e2.j };
Combining events from different streams in one
• stream1.Union(stream2);
User defined functions
• from e in stream where e.value <
MyFunctions.valThreshold(e.Id) select e;
105
http://msdn.microsoft.com/en-us/sqlserver/ee476990
106. Event Models in Microsoft
StreamInsight
Event Kind Start Time End Time Payload (Power
Consumption)
Interval model INSERT 2009-07-15
09:13:33.31
2009-07-15
09:14:09.270
100
• Event has predefined
7
INSERT 2009-07-15 2009-07-15 200
09:14:09.27 09:14:22.253
duration 0
INSERT 2009-07-15 2009-07-15 100
Point model Event Kind
09:14:22.25
5 Start Time
09:15:04.987
End Time Payload
(Consumption)
• Event is occurrence INSERT 2009-07-15
09:13:33.317
2009-07-15
09:13:33.31
100
in a point in time INSERT 2009-07-15
7
2009-07-15 200
09:14:09.270 09:14:09.27
Edge model INSERT
0
Event Start 2009-07-15 100 Payload
2009-07-15 Time
Edge Type End Time
• Only start time Kind 09:14:22.255 09:14:22.25
INSERT Start t0 5 ∞ a
known upon arrival INSERT
INSERT
End
Start
t0
t1
t1
∞
a
b
to server; end-time is INSERT
INSERT
End
Start
t1
t3
t3
∞
b
c
updated later
106
http://msdn.microsoft.com/en-us/sqlserver/ee476990
108. What are anomalies?
108
http://www.dtc.umn.edu/publications/reports/2008_16.pdf
109. Anomaly detection
Key components associated
with an anomaly detection
technique
109
http://www.dtc.umn.edu/publications/reports/2008_16.pdf
110. Techniques to detect anomalies
Classification based
• A pre-trained classifier can distinguish between normal and
anomalous classes
Clustering based
• Normal data instances belong to large and dense clusters,
while anomalies either belong to small or sparse clusters
Nearest neighbor approaches
• Normal data instances occur in dense neighborhoods,
while anomalies occur far from their closest neighbors
Statistical approaches
• Normal data instances occur in high probability regions of a
stochastic model, while anomalies occur in the low
probability regions
Information theoretic approaches
• Anomalies in data induce irregularities in the information
content of the data set
Spectral methods
• Normal instances appear in a lower dimensional subspace,
110
anomalies in the rest (noise)
http://www.dtc.umn.edu/publications/reports/2008_16.pdf
111. The key to a successful anomaly
detection is proper feature
engineering!
Anomalies are
detectable if data
instances are
represented in an
informative feature
space Contextual anomaly t2 in a temperature
time series. Note that the temperature at
time t1 is same as that at time t2 but
occurs in a different context and hence is
not considered as an anomaly.
111
http://www.dtc.umn.edu/publications/reports/2008_16.pdf
112. Application: Telecommunication
Network Monitoring
Alarms Server
Telecom
Network Alarms
Alarms Live feed of data Explorer
(~25 000 ~10-100/sec
devices) Server
Alarms Explorer Server implements
three real-time scenarios on the
alarms stream:
1. Root-Cause-Analysis – finding
which device is responsible for
occasional “flood” of alarms
2. Short-Term Fault Prediction –
predict which device will fail in next
15mins
3. Long-Term Anomaly Detection – Operator Big board display
detect unusual trends in the network
113. Outline
Part I. Motivation & background
Part II. Technology and tools for exploiting the WoT
Part III. Demos, Tools & Research directions
113
114. Outline
Part III. Demos, Tools & Research directions
Use cases
• What systems and prototypes exist?
Open problems
• Are there unsolved problems?
Summary
• What was this tutorial about?
List of sources for further studies
• Where to start digging?
114
115. Targeted Application areas
Military Agriculture
Smart infrastructures Environmental monitoring
Lighting
Electricity
Water Smart House Advertising
Gas Industrial Processes Marketing
Social Networks
Transportation eHealth
Logistics Safety Sport
Security Emergency
115
116. Use cases
• We look at some the use cases identified in the first
part of the tutorial
• Environmental intelligence
• Industrial automation
• Water distribution
• Logistics
• Others
• Discuss existing implementations for each
116
118. Environmental intelligence
Data from large number of sensors deployed in
infrastructure (such as roads) or over other area of interest
(such as agriculture fields) can give decision makers a real-
time awareness on the observed phenomena and events.
Solutions:
• Remote monitoring of cultures, soil moisture, insect
infestations or disease infections
• Irrigation and pesticide spraying in precision agriculture
• Livestock monitoring for maximizing production (meat,
milk, eggs) and achieve higher reproduction rates
118
119. Hierarchical WSN for
Environmental Monitoring
Temperature and humidity monitoring
ZigBee based local sensor networks
GSM/GPRS interconnection with
control center
Proprietary Hardware
Joomla extension WEB interface
• Customized data export (Chart, Table,
GoogleMaps, XML, Database)
Sensor node
Gateway node
Internet Cellular network
base station
119
Control centre
(web server + data
base) User Sensor node
120. Remote Sensing via Unmanned
Aerial Vehicle
RC controlled airplane
• glider + electric motor
• size = 268×118 cm
• weight = 1.8 kg
• payload weight < 0.4 kg
Multispectral camera
Online video transmission
Duplex communication
Ad-hoc sensor data retrieval
Autopilot
• GPS + compass + 3-axes
accelerometer
• Ground station
120
121. Environmental monitoring testbed
• Location: Slovenia, Europe (project started August 2010)
• The “things”: public light poles + VSN sensor nodes
• Sensors: temperature, humidity, pressure, illuminance, etc.
• Actuator: dim the intensity of the light (pulse width modulation)
121
123. Environmental intelligence:
SemSense system architecture
123
A. Moraru, M. Vucnik, M. Porcius, C. Fortuna, M. Mohorcic, D. Mladenic, Exposing Real
World Information for the Web of Things, IIWeb (WWW2011), Hyderabad, India.
124. Environmental intelligence:
SemSense implementation details
Scenario
• architecture for collecting real world data from a physical system of
sensors and publishing it on the Web
Implementation:
• Versatile Sensor Nodes (VSN) platform are “things”
• Self-Identification Protocol
• Custom protocol for collecting meta-data and data
• MySQL database for storage of data and meta-data
• Meta-data semantic enrichment component
• RDF representation
• Semantic Sensor Network (SSN) ontology, Basic GeoWGS84
Vocabulary, GeoNames and FOAF as vocabulary
• Linking to Linked Opened Data Cloud
• D2R for mapping the database schema
124
A. Moraru, M. Vucnik, M. Porcius, C. Fortuna, M. Mohorcic, D. Mladenic, Exposing Real
World Information for the Web of Things, IIWeb (WWW2011), Hyderabad, India.
127. Sensor search and ranking
The goal of the search
• retrieve and rank a list of sensors based on the
user‟s request
• Input:
• keyword query
• geographic location (given by latitude and longitude
coordinates)
• distance (interpreted as a radius around the location)
• Output:
• list of ranked sensors
127
L. Dali, A. Moraru, D. Mladenic , Using Personalized PageRank for Keyword Based
Sensor Retrieval, SemSearch (WWW2011), Hyderabad, India.
128. Sensor Search Example
Performing the proposed ranking results in obtaining more platforms
closer to the area of interest
• we consider relevant also sensors located on the same platform or those that are
in the same deployment
128
L. Dali, A. Moraru, D. Mladenic , Using Personalized PageRank for Keyword Based
Sensor Retrieval, SemSearch (WWW2011), Hyderabad, India.
129. Automatic tagging of sensor meta-
data
129
A. Moraru, C. Fortuna, and D. Mladenic, Using Semantic Annotation for Knowledge Extraction from
Geographically Distributed and Heterogeneous Sensor Data, SensorKDD 2010.
130. Automatic tagging of sensor meta-
data
Collect sensor description and data
• Automatic tagging
Use some of the existing rules and introduce new
ones to perform reasoning using Cyc
Possible Applications
• Complex searching, with multiple constraints
• Location, sensed features, tags
• Energy consumption monitoring combined with
price plans for energy and costs saving
130
A. Moraru, C. Fortuna, and D. Mladenic, Using Semantic Annotation for Knowledge Extraction from
Geographically Distributed and Heterogeneous Sensor Data, SensorKDD 2010.
138. Industrial automation
The integration gap between the production and business processes comes
at a high cost, especially in multi-site enterprises.
Solutions:
• Automatic monitoring of the production process
• Monitor the devices on the production floor (i.e. robotic arm
overwarming)1
• Automatic event detection and notification
• Process the measurements, detect anomalies and notify the
business process (i.e. production at site interrupted, relocate)
• Productivity comparison
• Machines equipped with sensors allow productivity comparison
based on sensed data (i.e. Heidelberger Druckmaschinen)2
• Dynamic production optimization
• 5% increase in paper production by automatically adjusting the
shape and intensity of the flames that heat the kilns for the lime used
to coat paper2
138
1SOCRADES project, http://www.socrades.eu/
2Ludwig Siegele, A special report on smart systems, The Economist, Nov. 4 2010.
139. Process integration
• SunSpot on Robotic ARM, exposing measurements as Web
service
• SunSpot GW connected to Windows machine, then to the
Enterprise Network or Internet
• Failure, production interruption alarm – moving to alternative
production site
Enterprise Resource Planning
SIA server
Thing Thing
(DPWS) (REST)
http://www.youtube.com/watch?v=K8OtFD6RLMM
1SOCRADES project, http://www.socrades.eu
139
2D.Guinard, V. Trifa, S. Karnouskos, P. Spiess, D. Savio, Interacting with the SOA-based Internet of
Things: Discovery, Query, Selection and On-Demand Provisioning of Web Services, IEEE
Transactions on Services Computing, Vol. 3, July-Sept 2010.
140. Discover things
Automatic context data collection
Device Profile for Web Services (DPWS)
• Subset of Web Service standards (WSDL and SOAP)
• Successor of Universal Plug and Play (UPnP)
Representational State Transfer (REST)
• Lightweight, suitable for less complex services
Thing Thing
Thing Thing
(DPWS) (REST)
(DPWS) (REST)
1SOCRADES project, http://www.socrades.eu
140
2D.Guinard, V. Trifa, S. Karnouskos, P. Spiess, D. Savio, Interacting with the SOA-based Internet of
Things: Discovery, Query, Selection and On-Demand Provisioning of Web Services, IEEE
Transactions on Services Computing, Vol. 3, July-Sept 2010.
141. Query embedded services
- Insert search keywords, perform query enrichment
(augmentation)
- Tested 2 strategies: Wikipedia and Yahoo! Search
- Manually tune the augmented query by adding/deleting
keywords
- Search services in the store and rank them according to some
criteria (i.e. QoS)
Search Query Manual Service Service Service Service
Keywords Enrichment tuning query Ranking Instances testing
Wikipedia, Device and service store
Yahoo!
Search Thing Thing
Thing Thing
141
(DPWS) (REST)
(DPWS) (REST)
143. Water distribution
Utilities around the world lose between 25% and 50% of
treated water to leaks (Lux Research).
WaterWiSe in Singapore
• develop generic wireless sensor network capabilities
to enable real time monitoring of a water distribution
network.
• three main applications:
• On-line monitoring of hydraulic parameters within a
large urban water distribution system.
• Integrated monitoring of hydraulic and water quality
parameters.
• Remote detection of leaks and prediction of pipe burst
events.
143
http://aqueduct.nus.edu.sg/waterwise/
146. Logistics
Cargo loss due to theft or damage is significant, estimates that the
global financial impact of cargo loss exceeds $50 billion annually
(The National Cargo Security Council)1. The cost is eventually
passed to the customers.
Solutions:
• Automatic track and trace
• tag and trace their wares all along the supply chain (RFIDs
and sensors) - and consumers to check where they come
from (i.e. FoodLogiQ, SenseAware)2
• Event detection and mitigation
• Detect events that affect the cargo (i.e. delay, inappropriate
transport conditions) and minimize damage (i.e. re-route)
146
1 Tom Hayes, The Full Cost of Cargo Losses
2Ludwig Siegele, A special report on smart systems, The Economist, Nov. 4 2010.
147. Logistics
- SenseAware
- temperature readings
- shipment‟s exact location
- shipment is opened or if the
contents have been exposed to
light
- real-time alerts and analytics
between trusted parties
regarding the above vital signs of
a shipment
147
http://www.senseaware.com/
151. Intelligent building
Berkley: Motescope*
- Soda Hall, the Computer
Science building
- Permanent testbeds for
research, development
and testing
- 78 Mica2DOT nodes
151
*According to web site visited on Oct 2010.
152. University campus
CMU: SensorAndrew*
- campus-wide testbed
- Firefly nodes
- Unknown scale
152
* According to web site on Oct 2010 and
tech report from 2008.
153. Smart city
MIT: Senseable City Lab*
- Sensor nodes built into the wheels of bikes
- Unknown number
153
*Neil Savage, Cycling through Data, Communications of the ACM, Sept 2010.
154. Smart infrastructure
Harward, BBN: CitySense*
- 100 wireless sensors deployed across a city
- Sensor nodes are embedded PC, 802.11a/b/g
interface, and various sensors for monitoring
weather conditions and air pollutants
- open testbed
154
* According to web site visited on Oct 2010, last modified in 2008.
155. Federation of Sensor deployments
Pachube*
- 3700 sensor nodes, over 9400 data streams (April 2010)
- Sensor data and meta-data
- Open to upload/download
Sensorpedia*
- Similar to Pachube, limited testing Beta
Global Sensor Network*
- Framework for federated testbeds
- Used in the Swiss Experiment
155
* According to web site visited on Oct 2010.
156. Outline
Part III. Demos, Tools & Research directions
Use cases
• What systems and prototypes exist?
Open problems
• Are there unsolved problems?
Summary
• What was this tutorial about?
List of sources for further studies
• Where to start digging?
156
157. Current state and open problems
in WSN area
WSN is
• Well developed field with many degrees of freedom
• Complex, large-scale, resource constrained systems
• Focus is on intra network communications
Efficient management and maintenance of the “things”
• Remote reconfiguration of parameters
• Remote software updates
• Real implementations solving real problems, particularly large scale
(see next slide)
157
158. Myths & lessons regarding WSNs
Myth #1: Nodes are deployed randomly.
Myth #2: Sensor nodes are cheap and tiny.
Myth #3: The network is dense.
Lesson #1: It‟s all about the data.
Lesson #2: Computer scientists and domain scientists
need common ground.
Lesson #3: Don‟t forget about the base station!
158
M. Welsh, Sensor Networks for the Sciences, Communications of the
ACM, Nov. 2010.
159. Challenges with respect to
conceptualization
WoT covers a long pipeline of technologies from
sensors to high level services
• ...current ontologies are covering just parts of the
space and are not interlinked
• ...ideally, sensor network domain should be linked to
general common-sense ontologies and further to
domain specific service ontologies
159
160. Challenges with respect to
analytics & CEP
• Traditional mining and analytic techniques are not
ready for the scale and complexity coming from
large sensor setups
• ...in particular:
• connection to background knowledge
(ontologies) for enrichment of sensor data for
expressive feature representations needed for
analytic techniques
• "complex events" are in the context of WoT much
more complex compared to traditional "complex
events" research
160
• real-time response on complex events appearing
161. Outline
Part III. Demos, Tools & Research directions
Use cases
• What systems and prototypes exist?
Open problems
• Are there unsolved problems?
Summary
• What was this tutorial about?
List of sources for further studies
• Where to start digging?
161
162. Summary
The tutorial had 3 parts:
1. Motivation & background
• Problems that the Web of Things can solve
• Components and complexity of the system, from “Things” to
Apps and Services
• Quick start recipes
2. Technology and tools for exploiting the WoT
• Semantic aspects
• Analytic aspects
• Services
3. Demos, Tools & Research directions
• Overview of existing setups and tools used for their
implementation
• Research directions
162
163. Outline
Part III. Demos, Tools & Research directions
Use cases
• What systems and prototypes exist?
Open problems
• Are there unsolved problems?
Summary
• What was this tutorial about?
List of sources for further studies
• Where to start digging?
163
164. Relevant Conferences
• WWW - International World Wide Web Conferences
• ICML – International Conference of Machine Learning
• NIPS – Neural Information Processing Systems Apps and
• KDD – ACM Knowledge Discovery in Databases Services
• ICWS - IEEE International Conference on Web Services
• ISWC – International Semantic Web Conference
• IPSN – Information Processing in Sensor Networks
• Percom - IEEE Pervasive Computing and Communication
• SenSys - ACM Conference on Embedded Networked Sensor Systems “Glue”
• MobiSys - International Conference on Mobile Systems, Applications, and Services
• INSS – International Conference on Networked Sensing Systems
• DCOSS - International Conference on Distributed Computing in Sensor Systems
• iThings - IEEE International Conference on Internet of Things
164
165. Relevant Workshops
• WebOfThings - International
Workshop on the Web of Things
• SensorKDD - International
Workshop on Knowledge
Discovery from Sensor Data
• PURBA - Workshop on Pervasive
Urban Applications
• Urban-IOT – the Urban Internet of
Things Workshop
• Web Enabled Objects -
International Workshop on Web-
Enabled Objects
• ….
165
169. Relevant blogs
• Web of Things Blog
• Wireless Sensor Network
Blog
• The Internet of Things
• Dust Networks – In the News
• ReadWriteWeb
169
170. Related Wikipedia Links
Data Stream Mining:
http://en.wikipedia.org/wiki/Data_stream_mining
Complex Event Processing:
http://en.wikipedia.org/wiki/Complex_Event_Processing
Real Time Computing: http://en.wikipedia.org/wiki/Real-
time_computing
Online Algorithms:
http://en.wikipedia.org/wiki/Online_algorithms
Worst Case Analysis:
http://en.wikipedia.org/wiki/Worst-case_execution_time
171. Related Wikipedia Links
Web of Things:
http://en.wikipedia.org/wiki/Web_of_Things
Internet of Things:
http://en.wikipedia.org/wiki/Internet_of_Things
Wireless Sensor Networks:
http://en.wikipedia.org/wiki/Wireless_Sensor_Networks
Major Appliance:
http://en.wikipedia.org/wiki/Household_appliances
RFID – Radio Frequency Identification:
http://en.wikipedia.org/wiki/RFID
172. Video Tutorials
State of the Art in Data Stream Mining: Joao
Gama, University of Porto
• http://videolectures.net/ecml07_gama_sad/
Data stream management and mining: Georges
Hebrail, Ecole Normale Superieure
• http://videolectures.net/mmdss07_hebrail_dsmm/
173. Outline
Part III. Demos, Tools & Research directions
Use cases
• What systems and prototypes exist?
Open problems
• Are there unsolved problems?
Summary
• What was this tutorial about?
List of sources for further studies
• Where to start digging?
173
175. Acknowledgements
We would like to thank Miha Smolnikar, Zoltan Padrah
and Alexandra Moraru for contributing some slides and
the SensorLab team for their support.
175