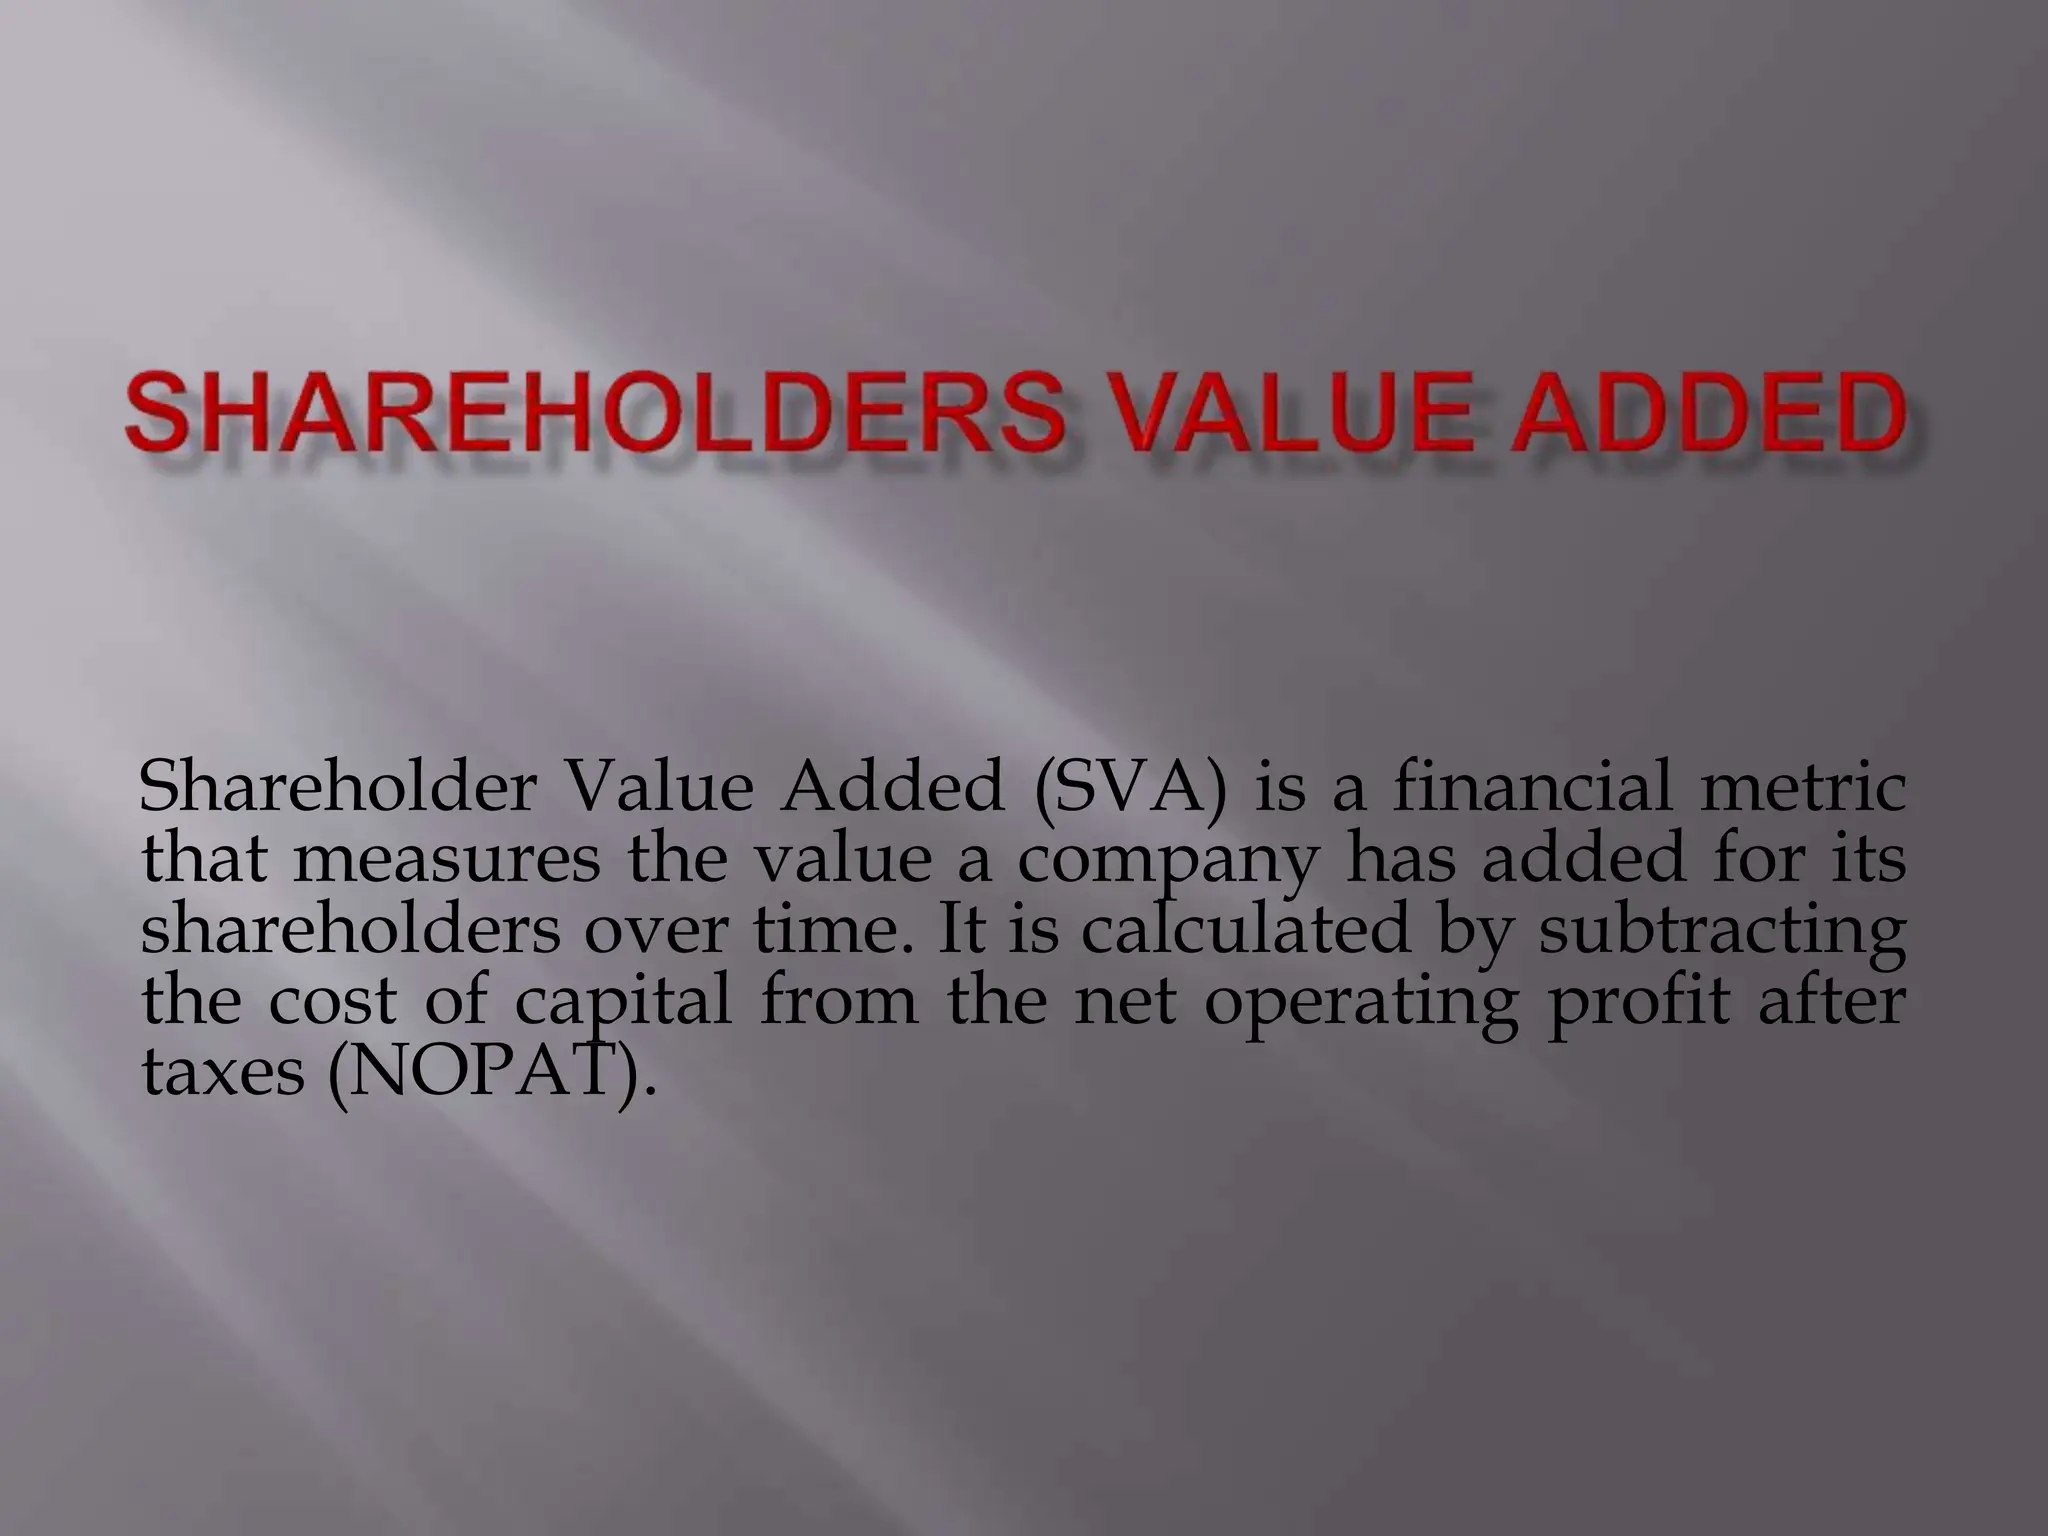
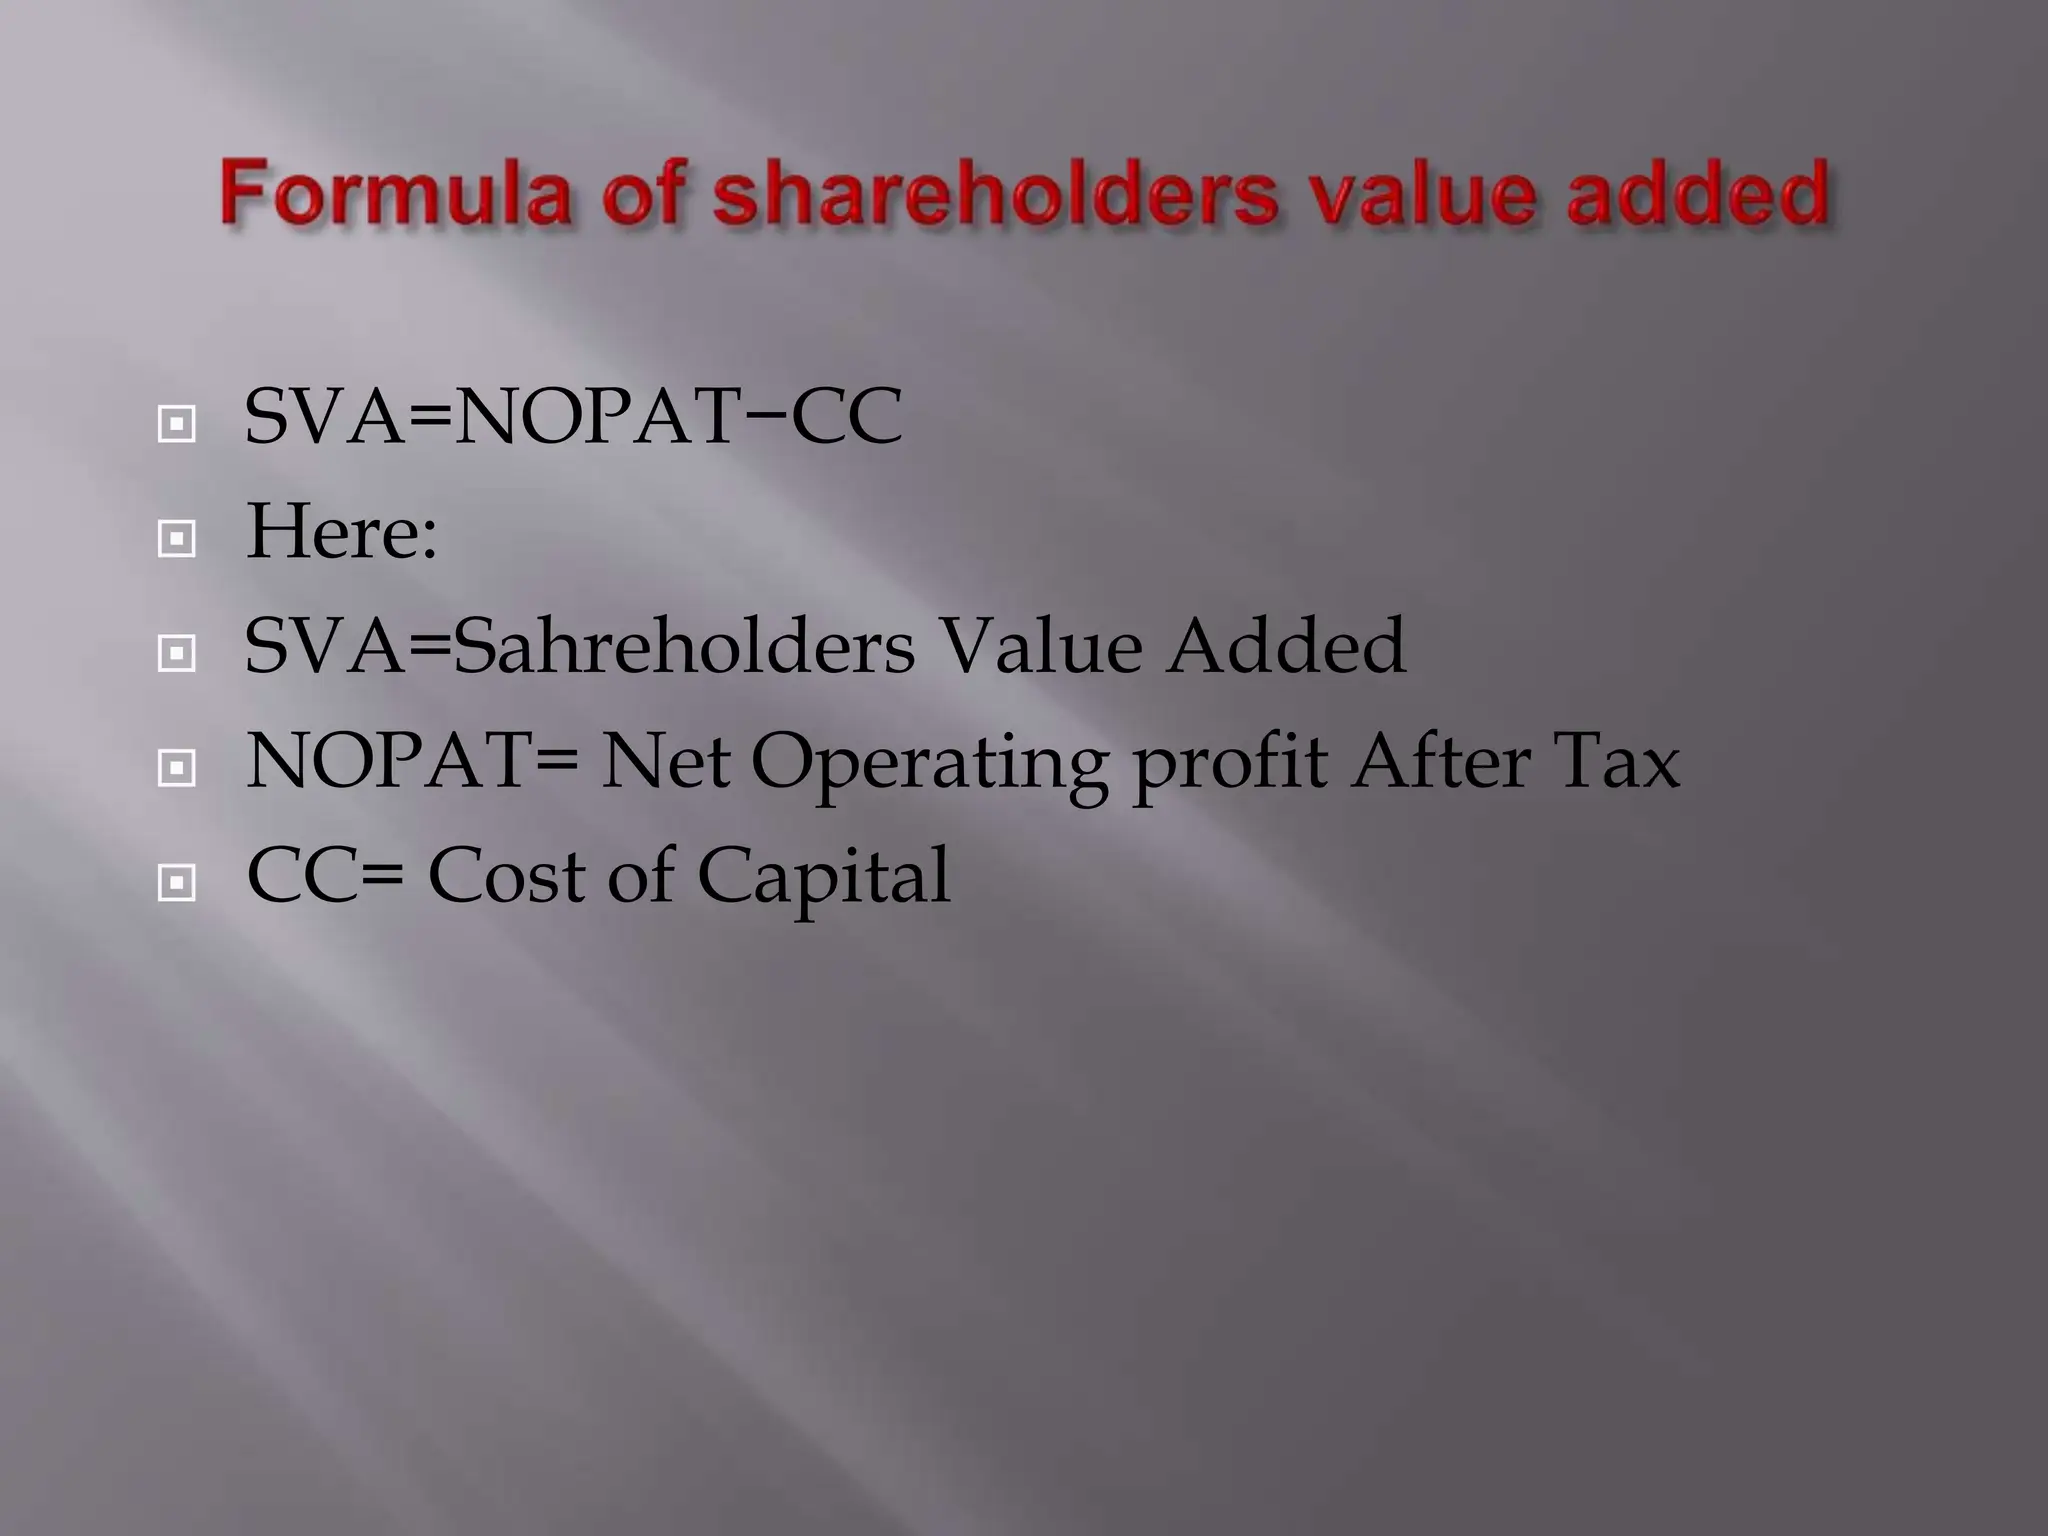
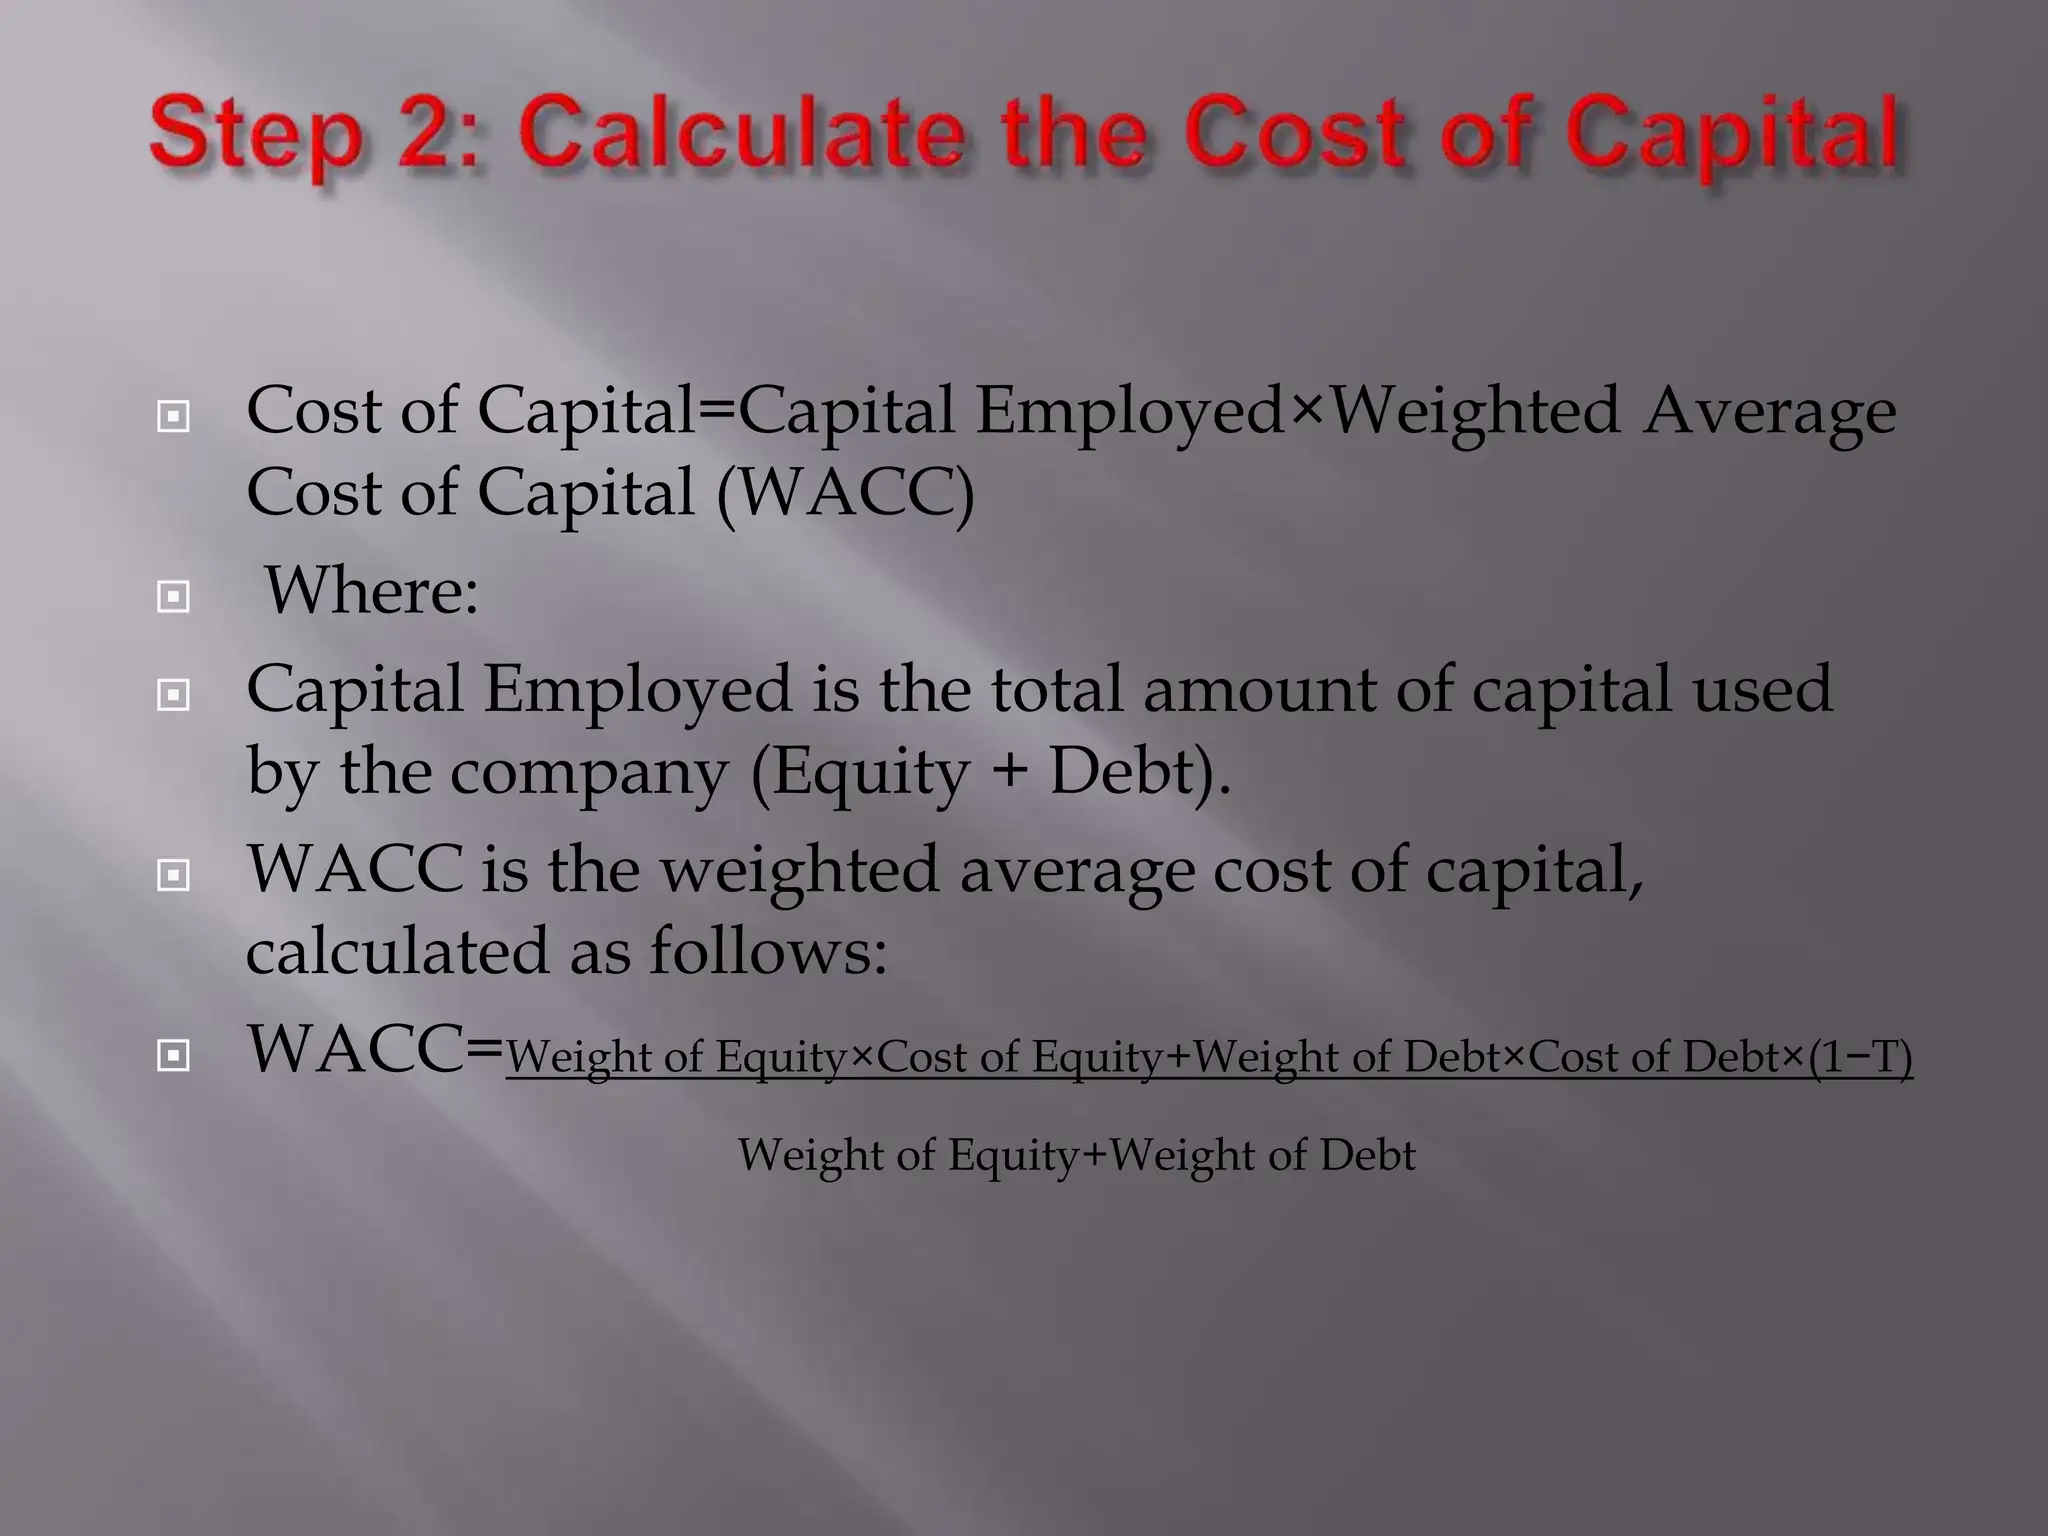
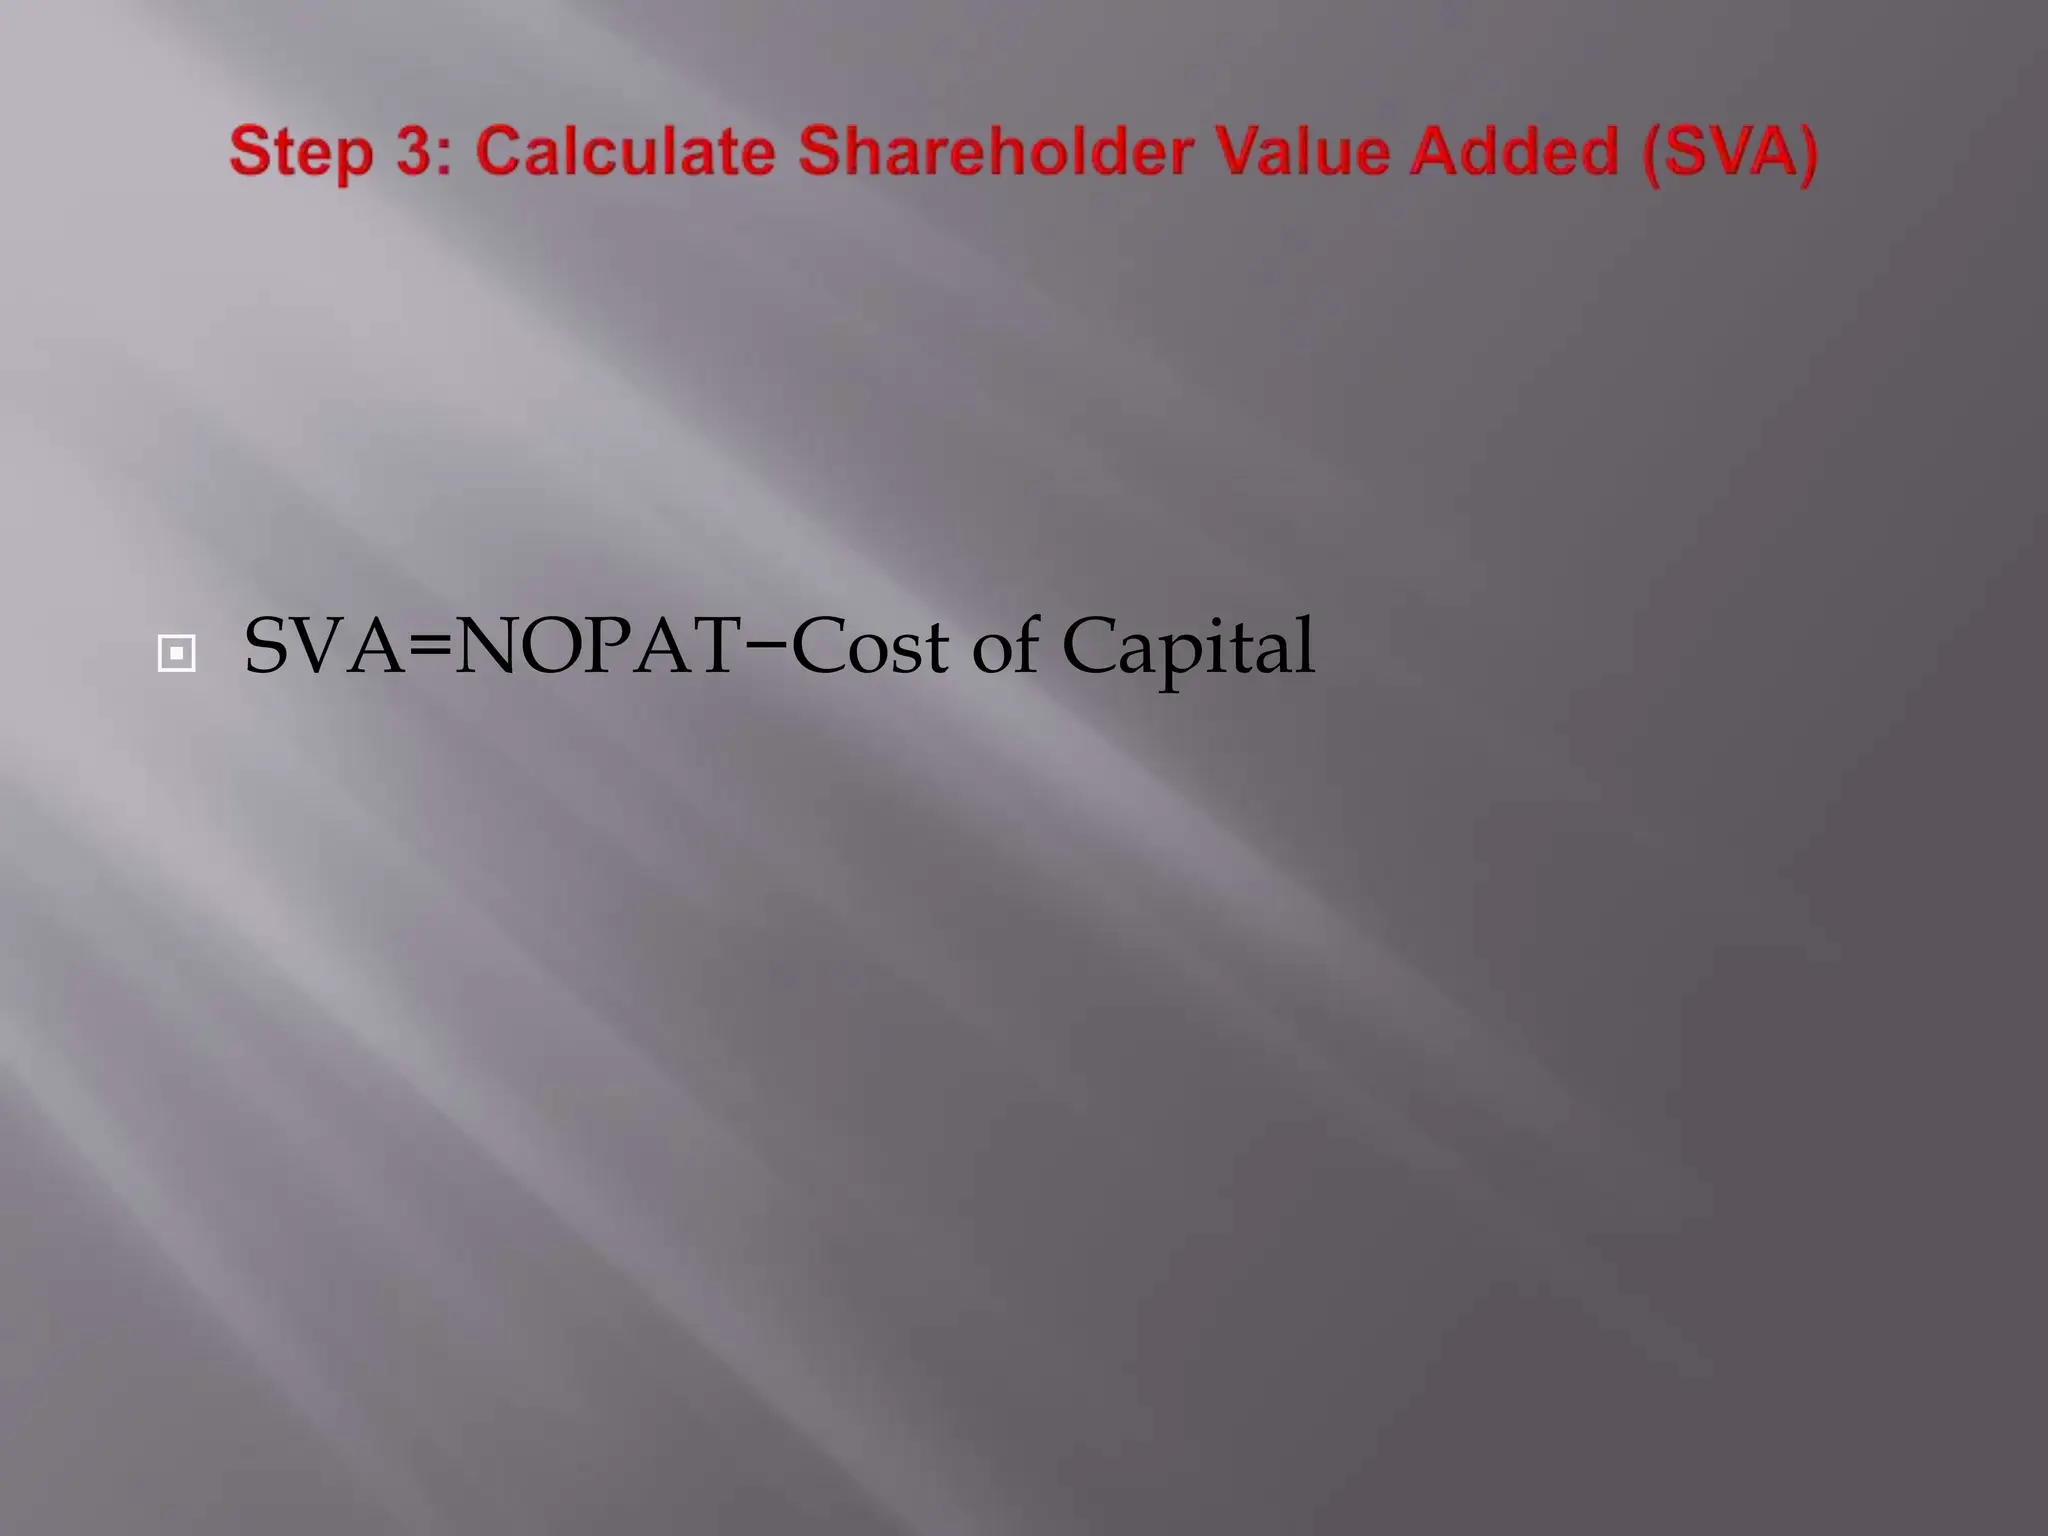
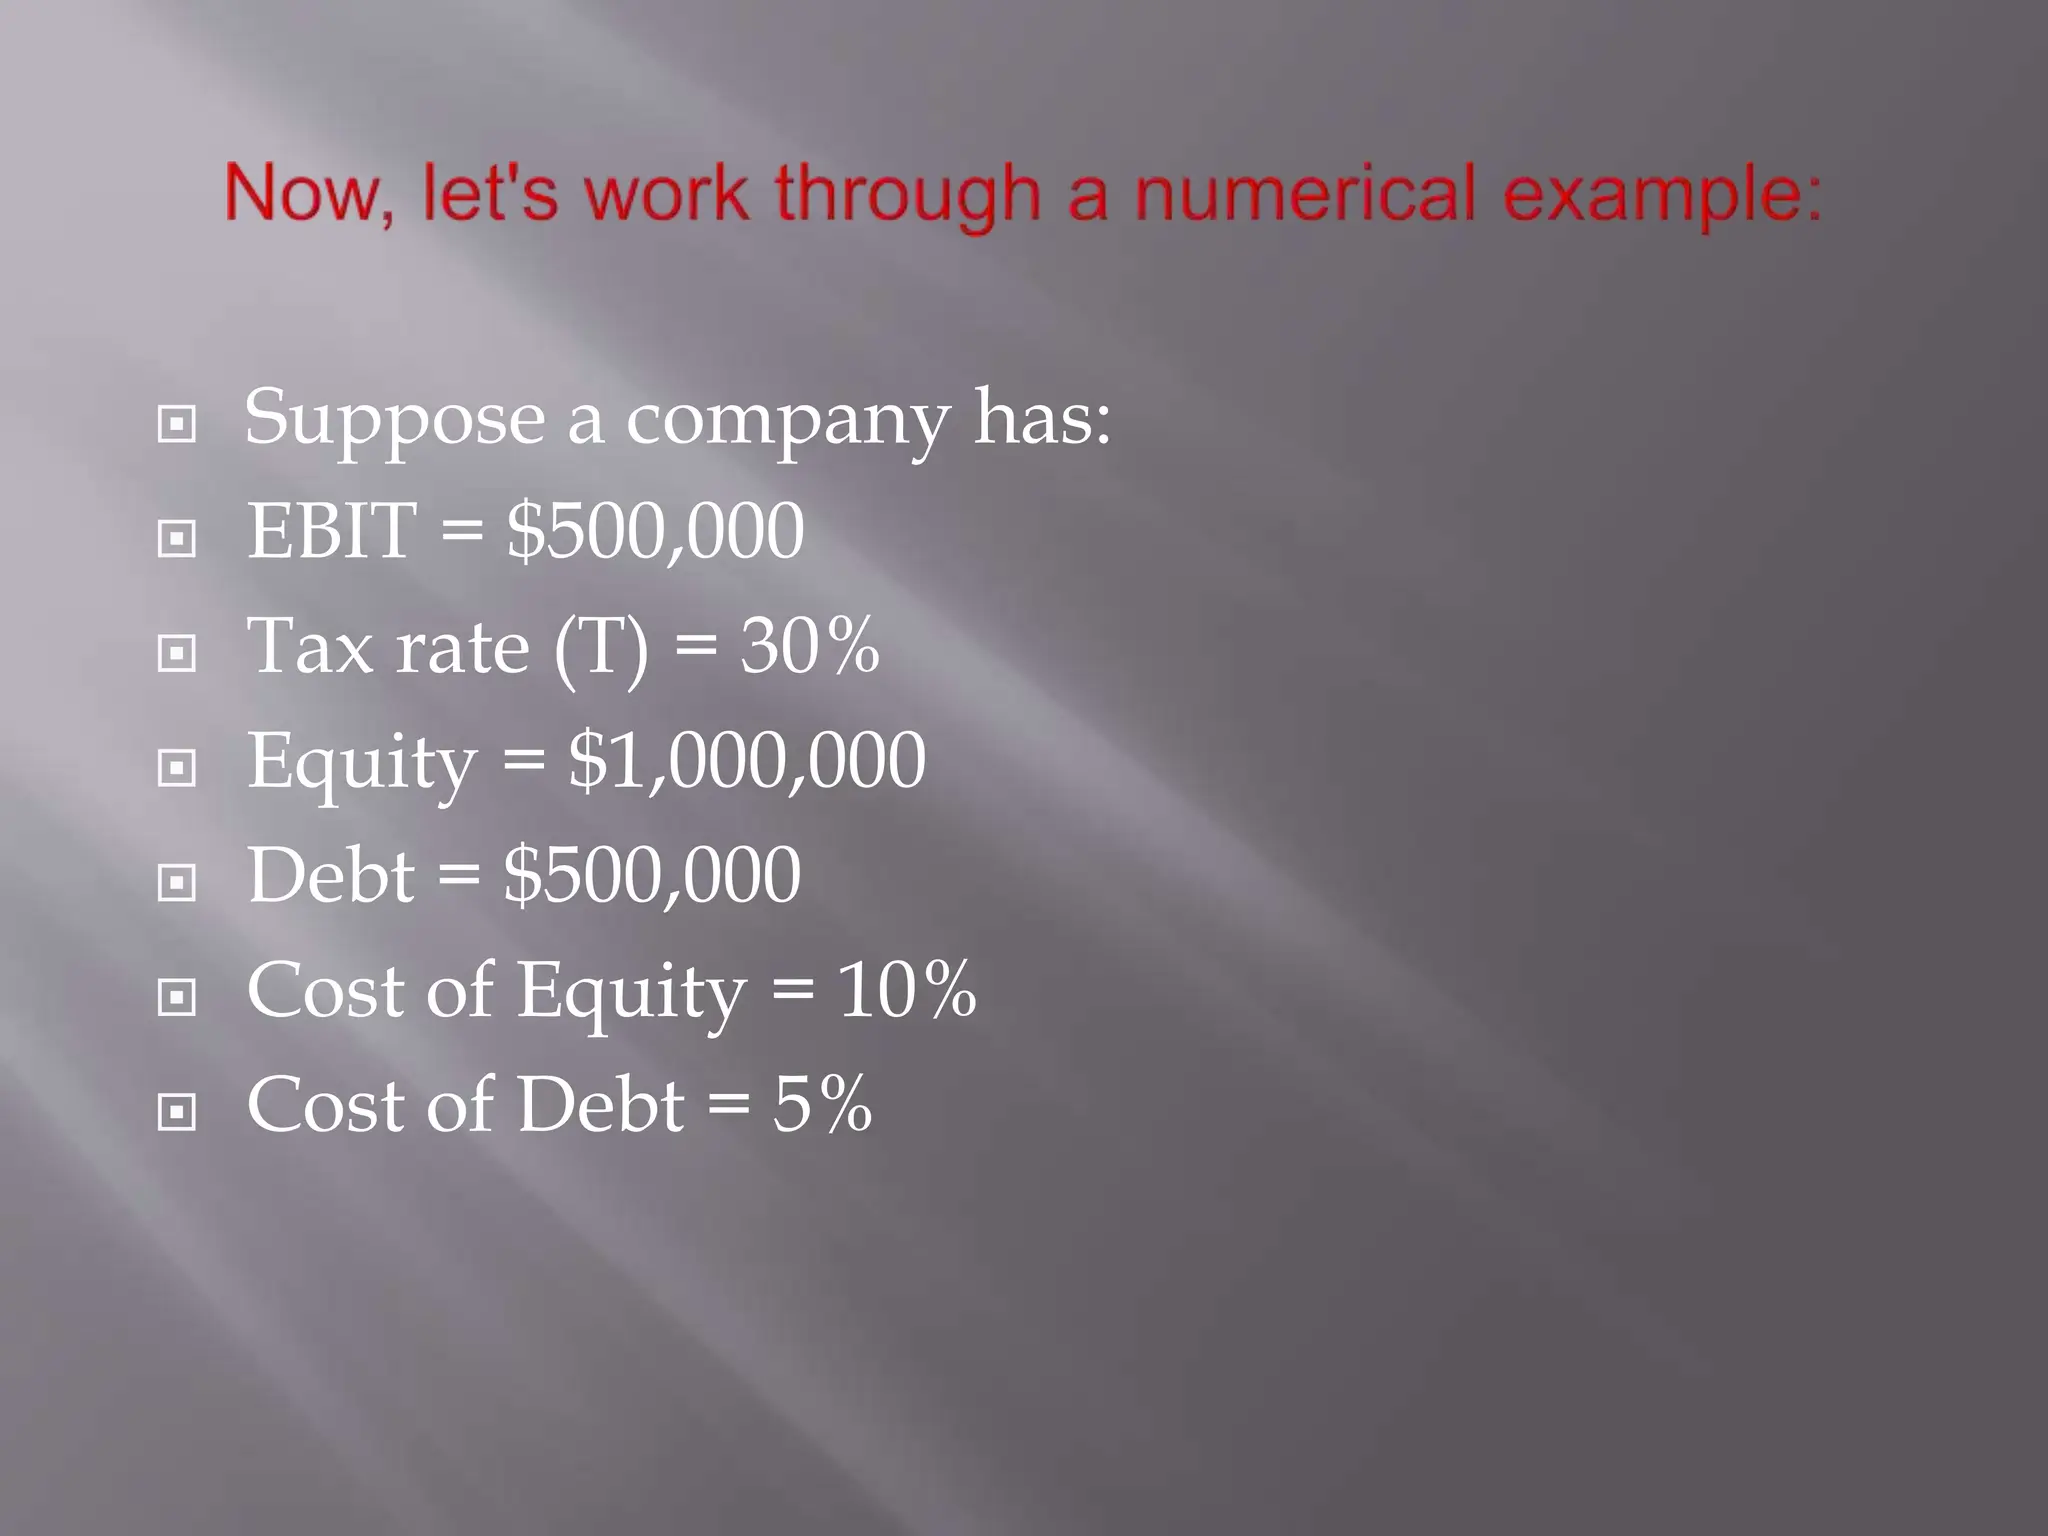
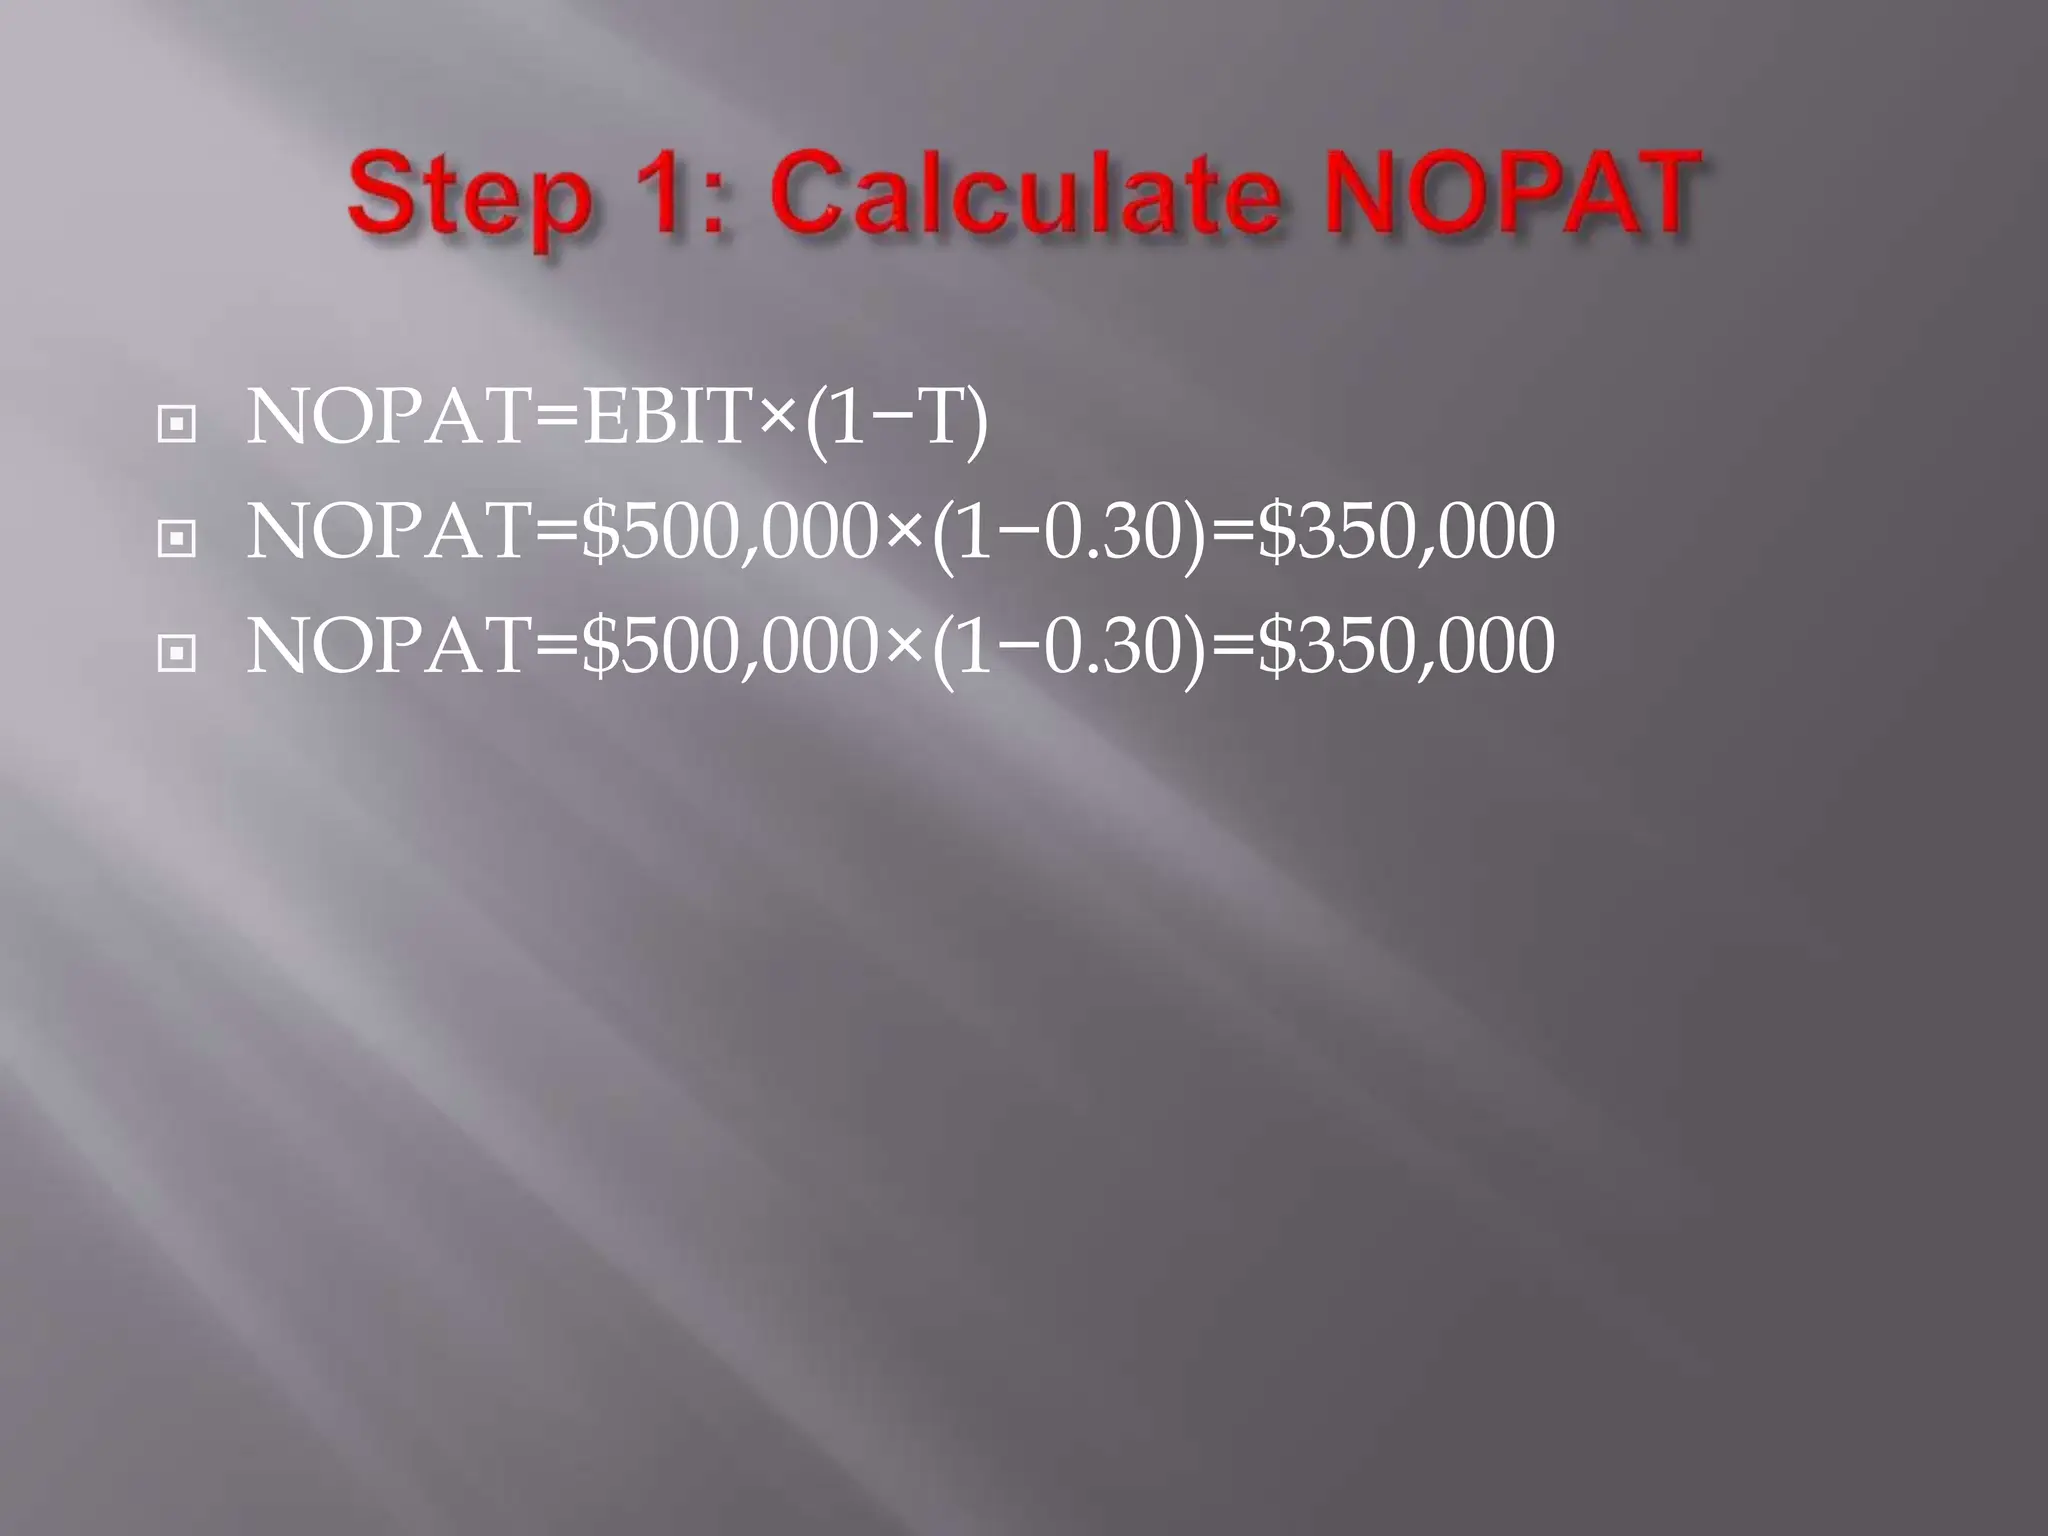
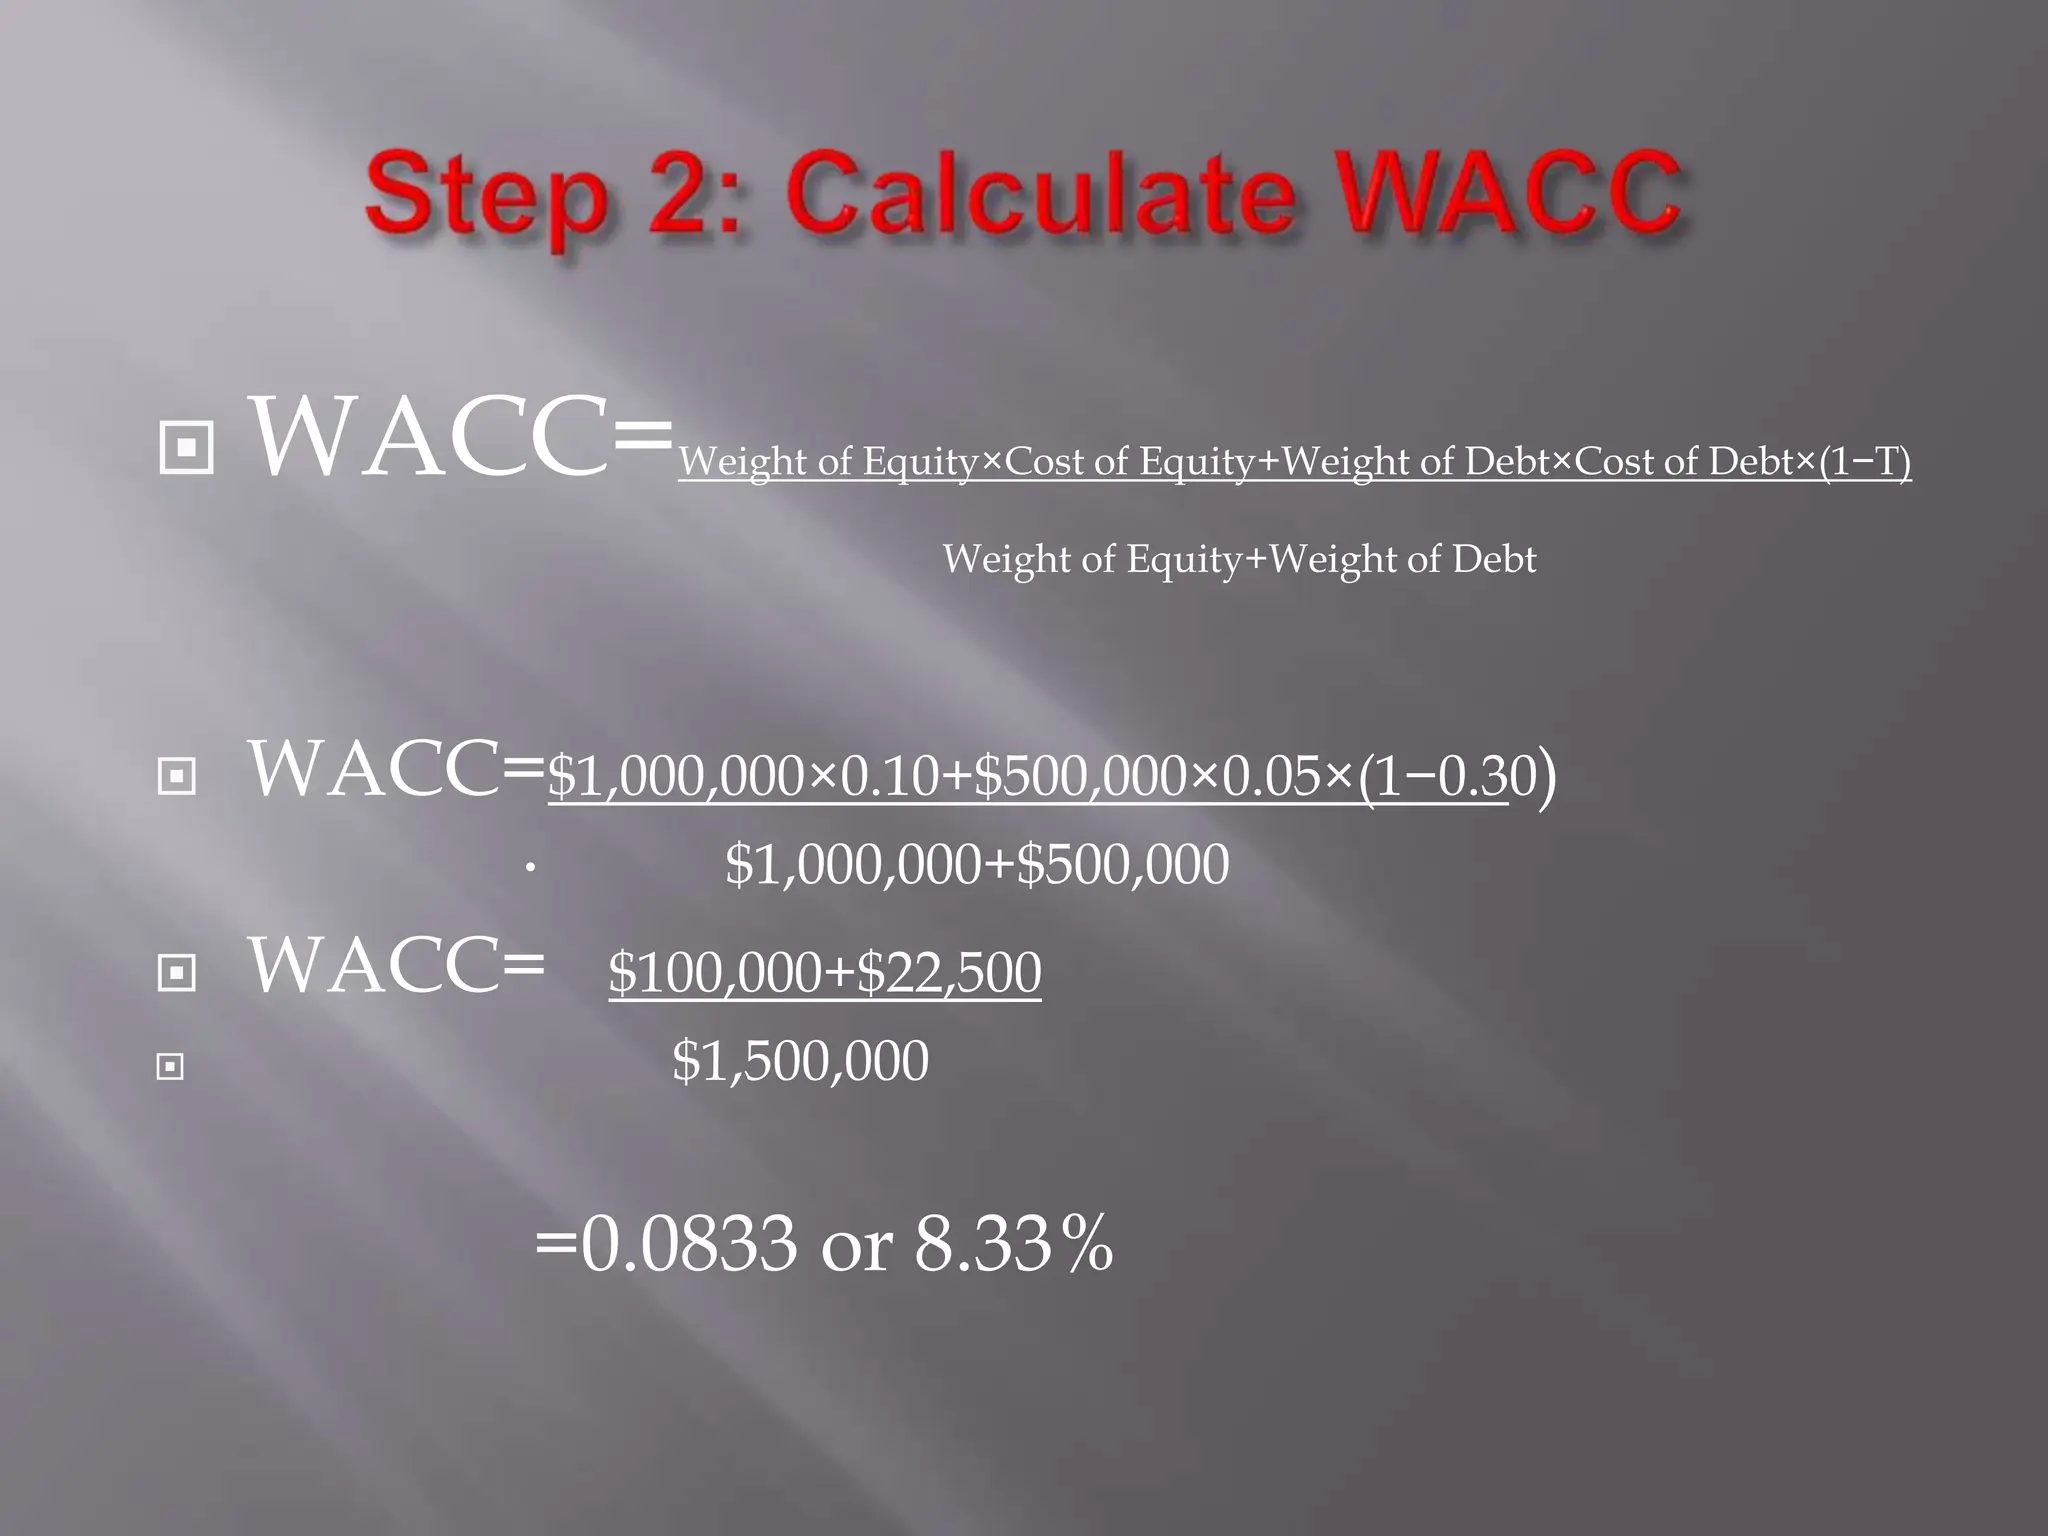
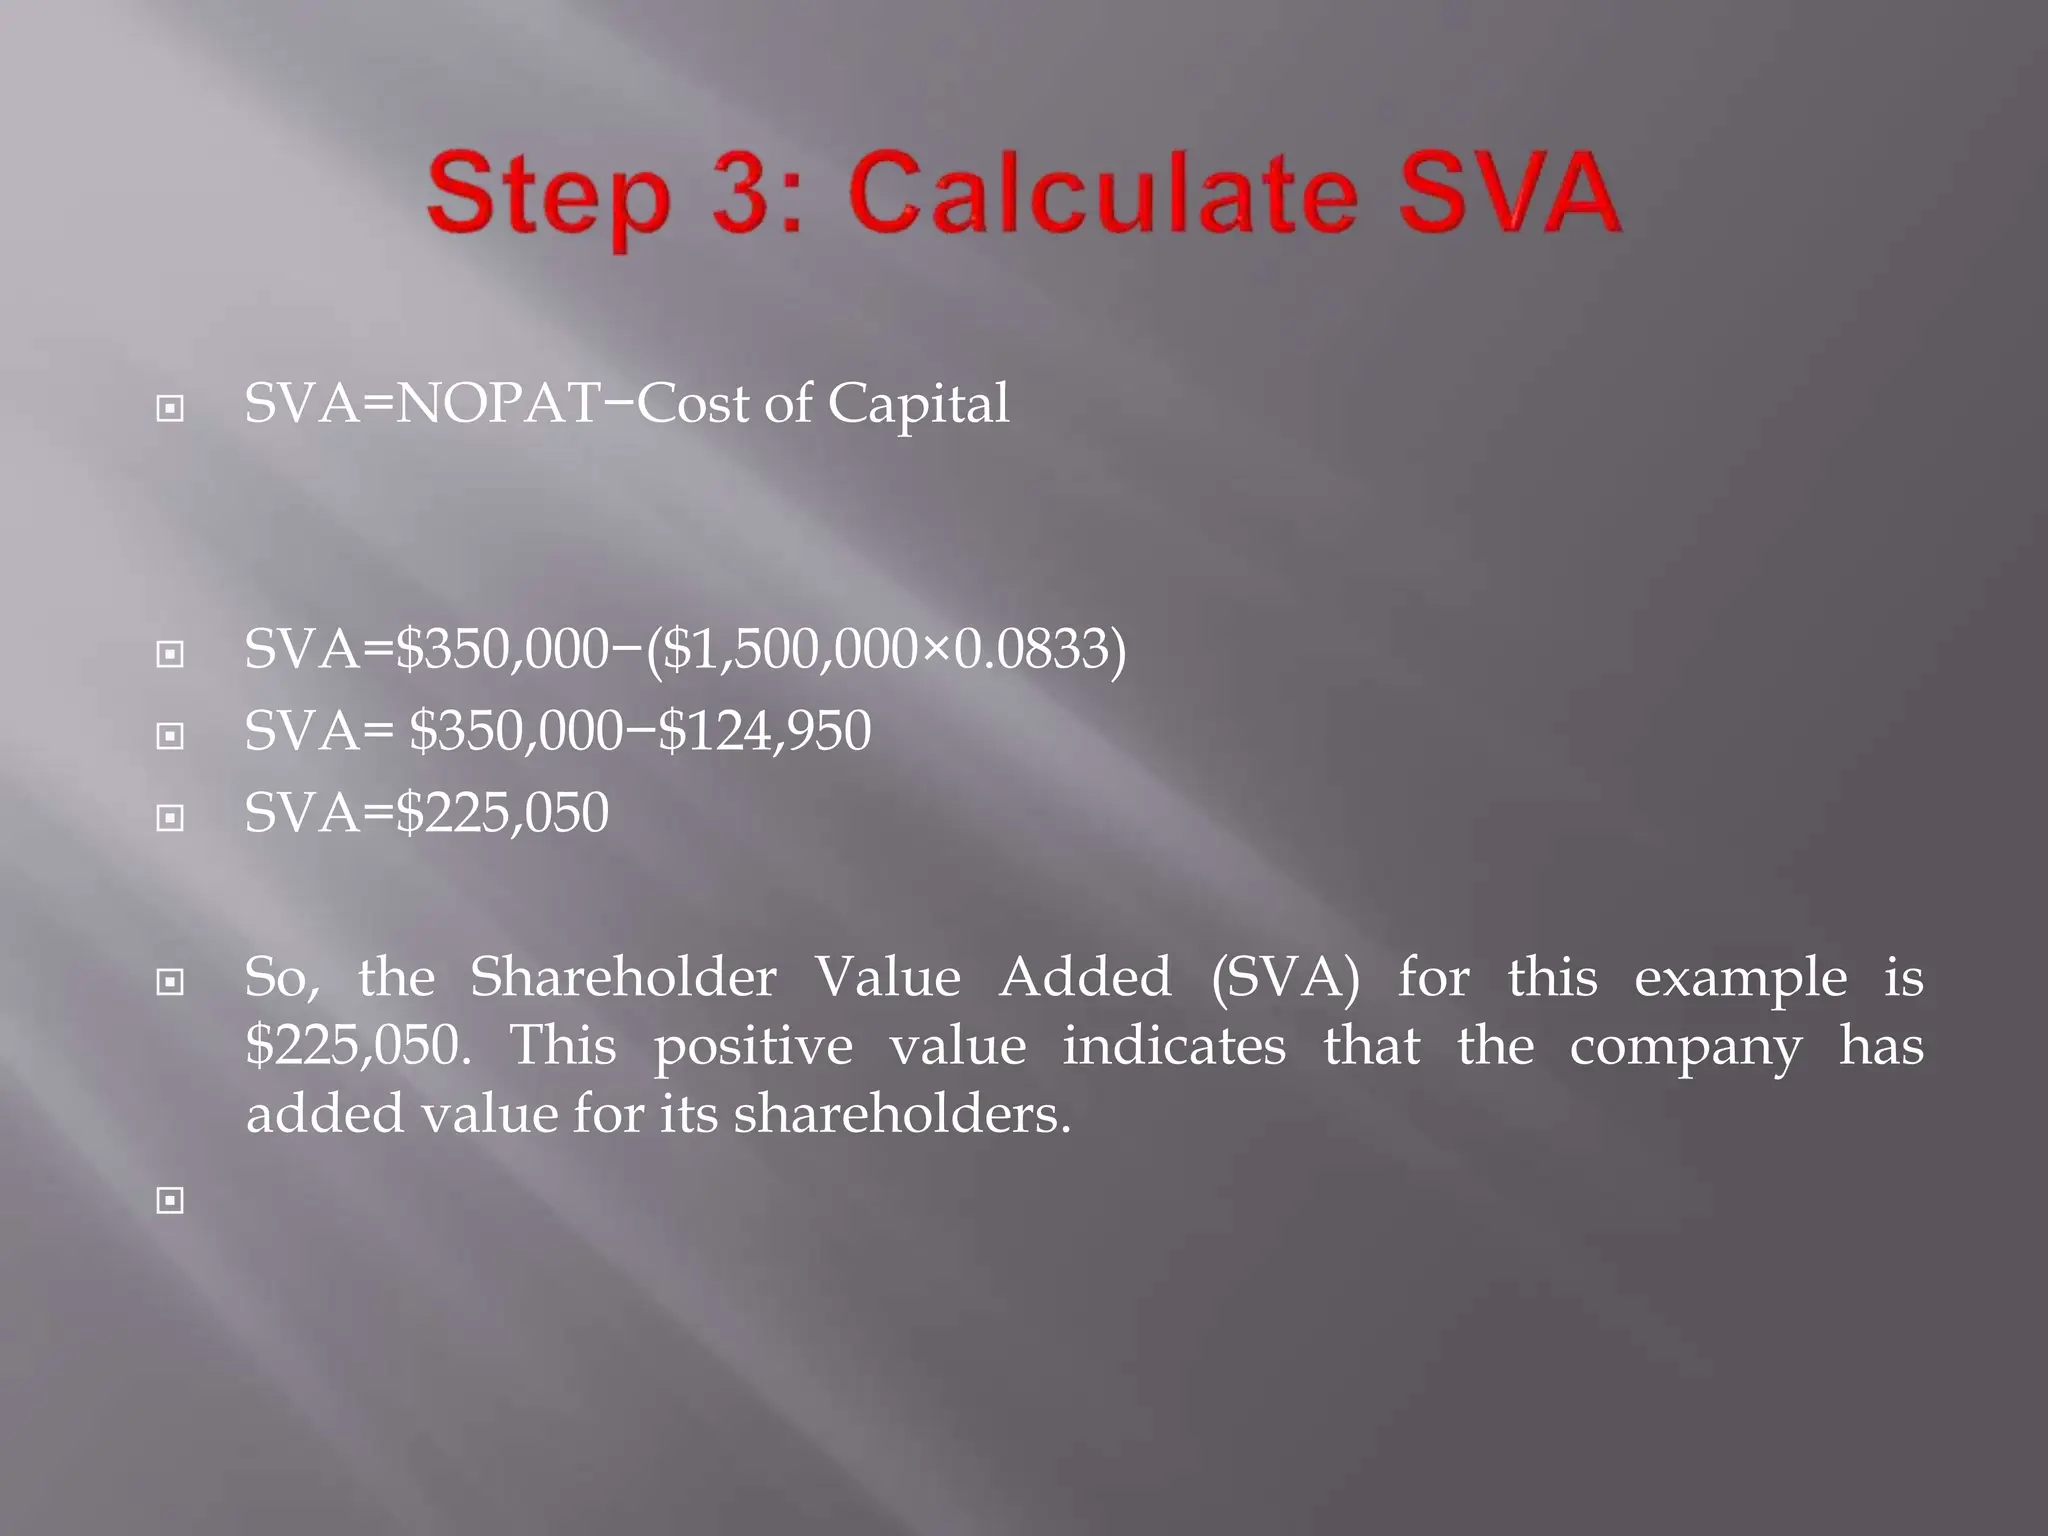
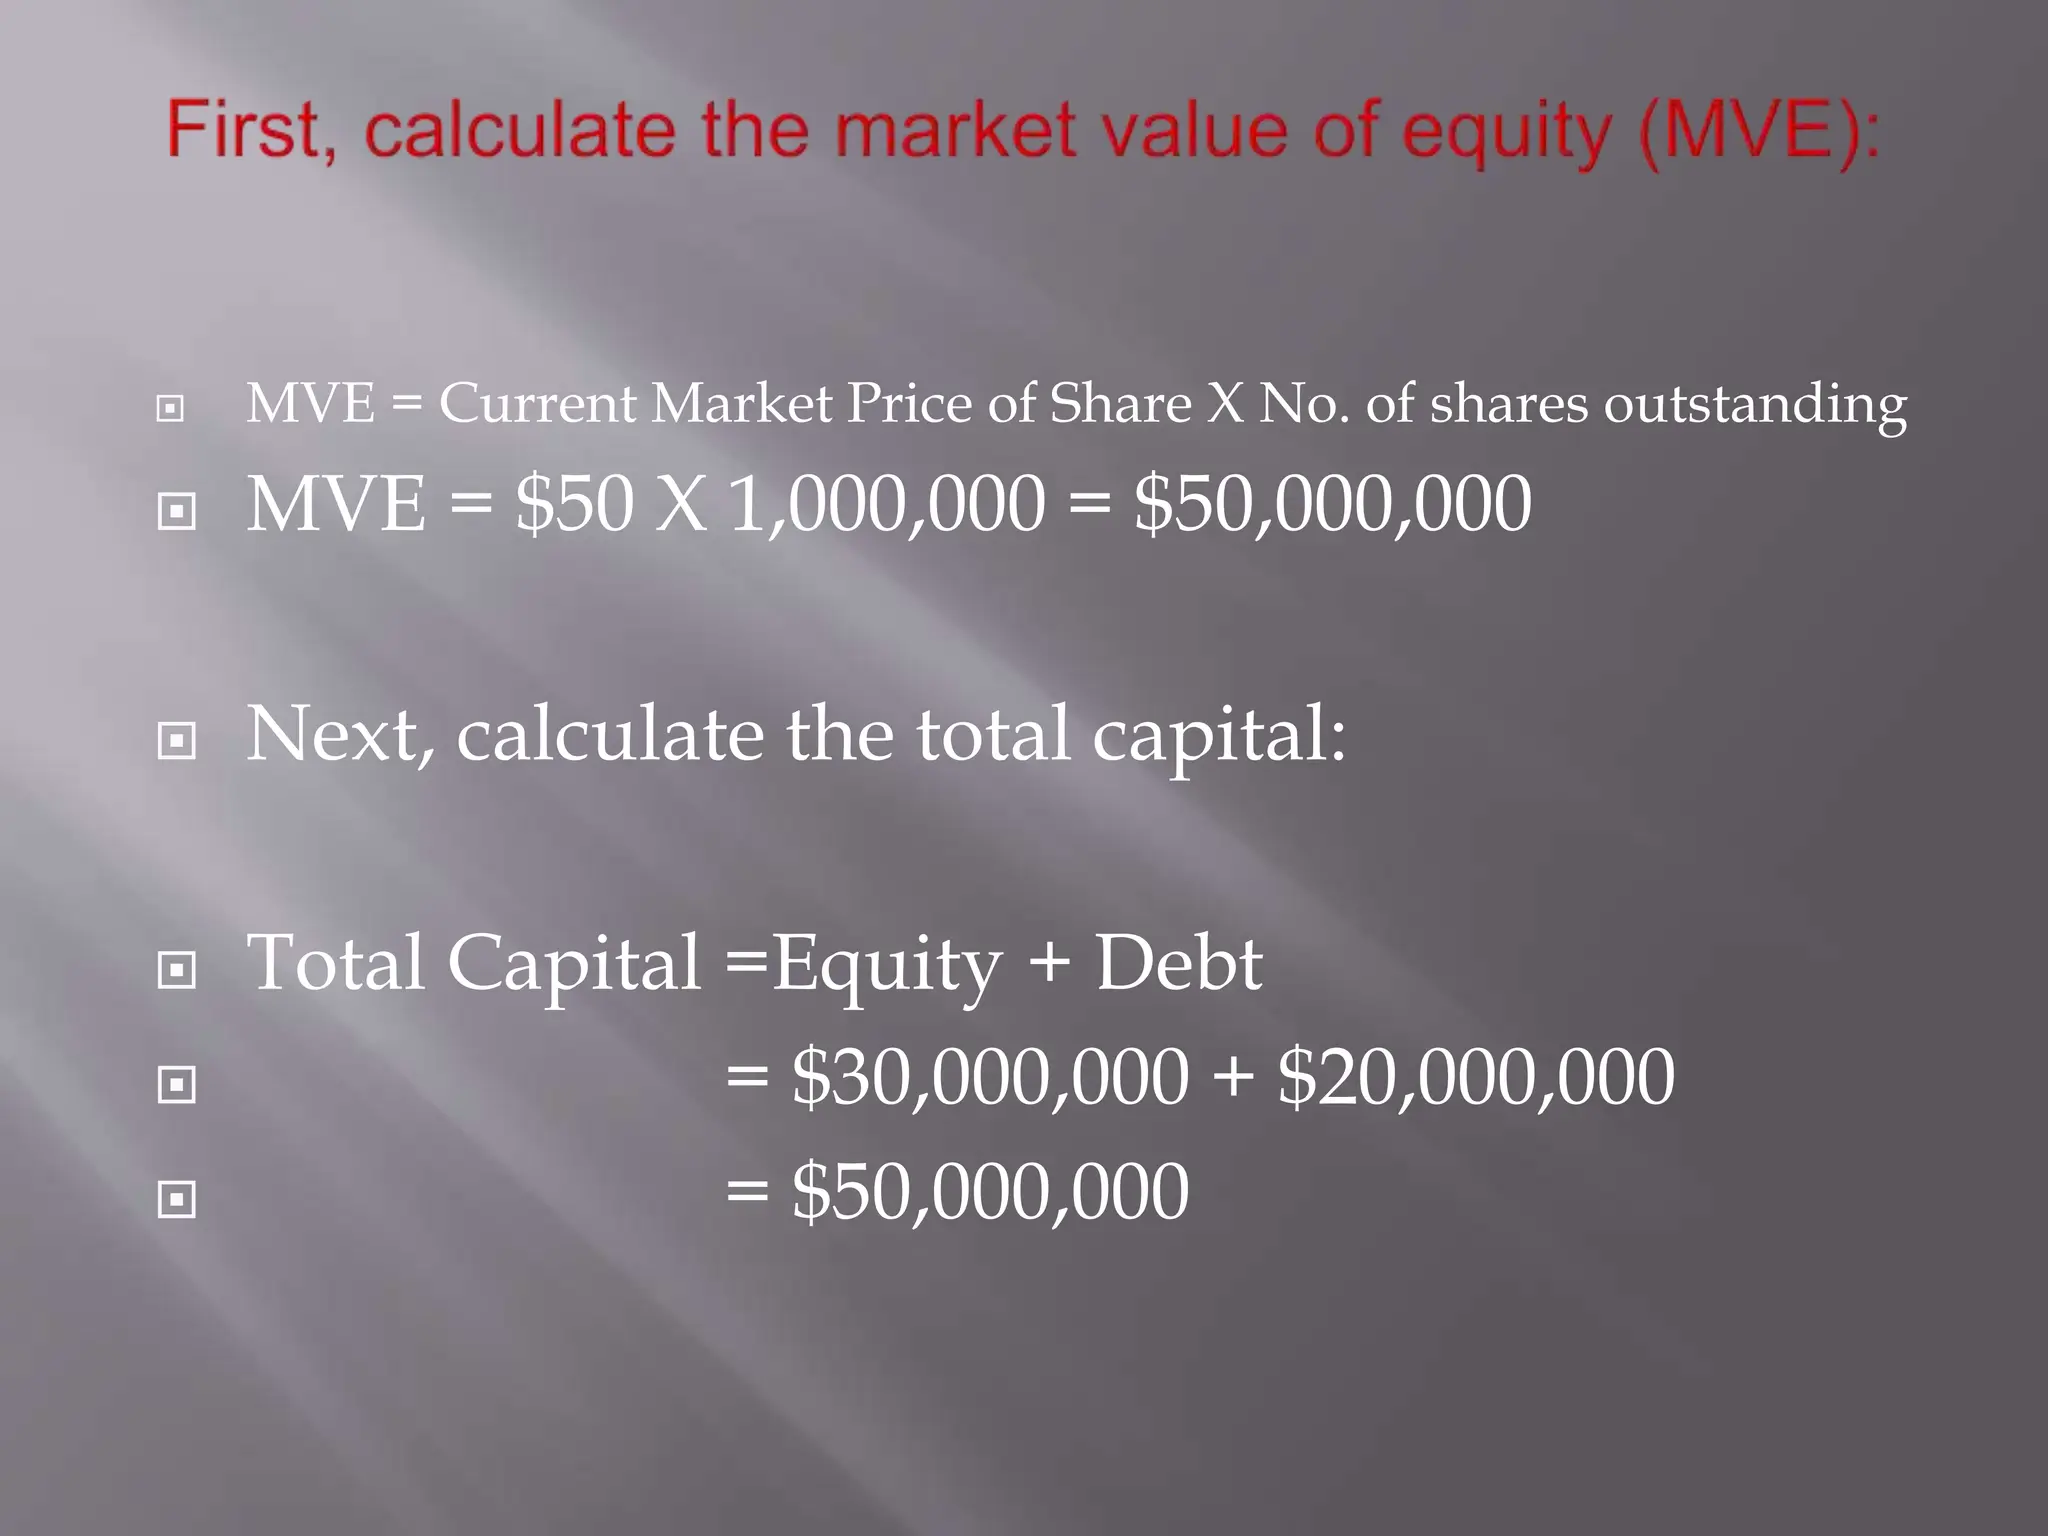
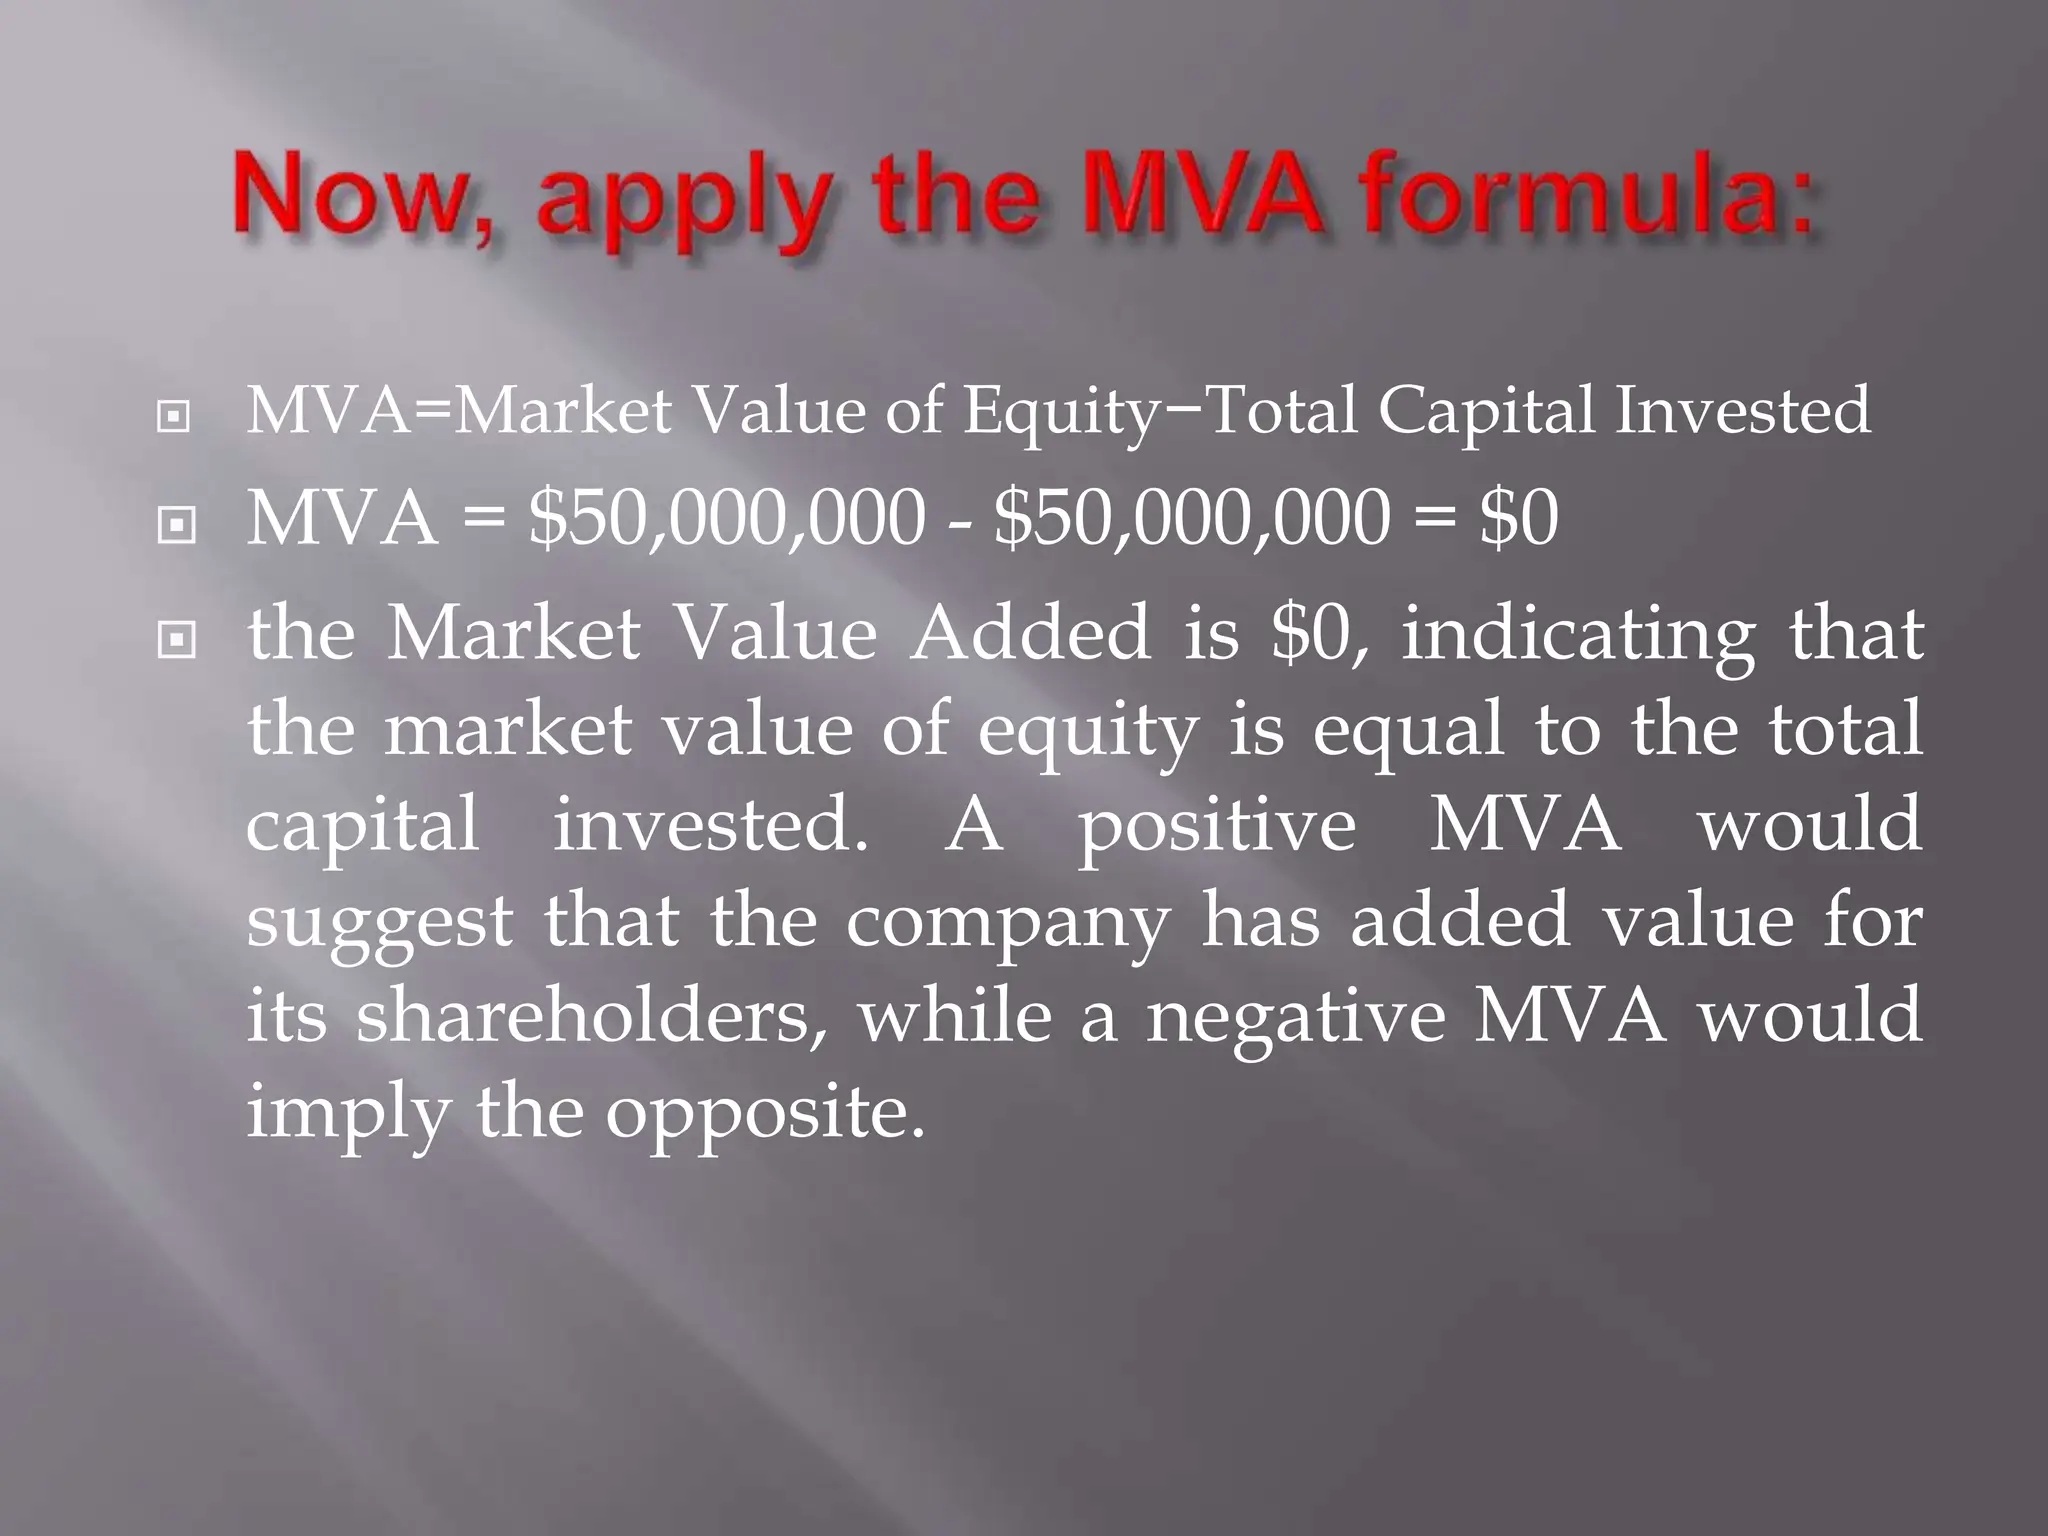
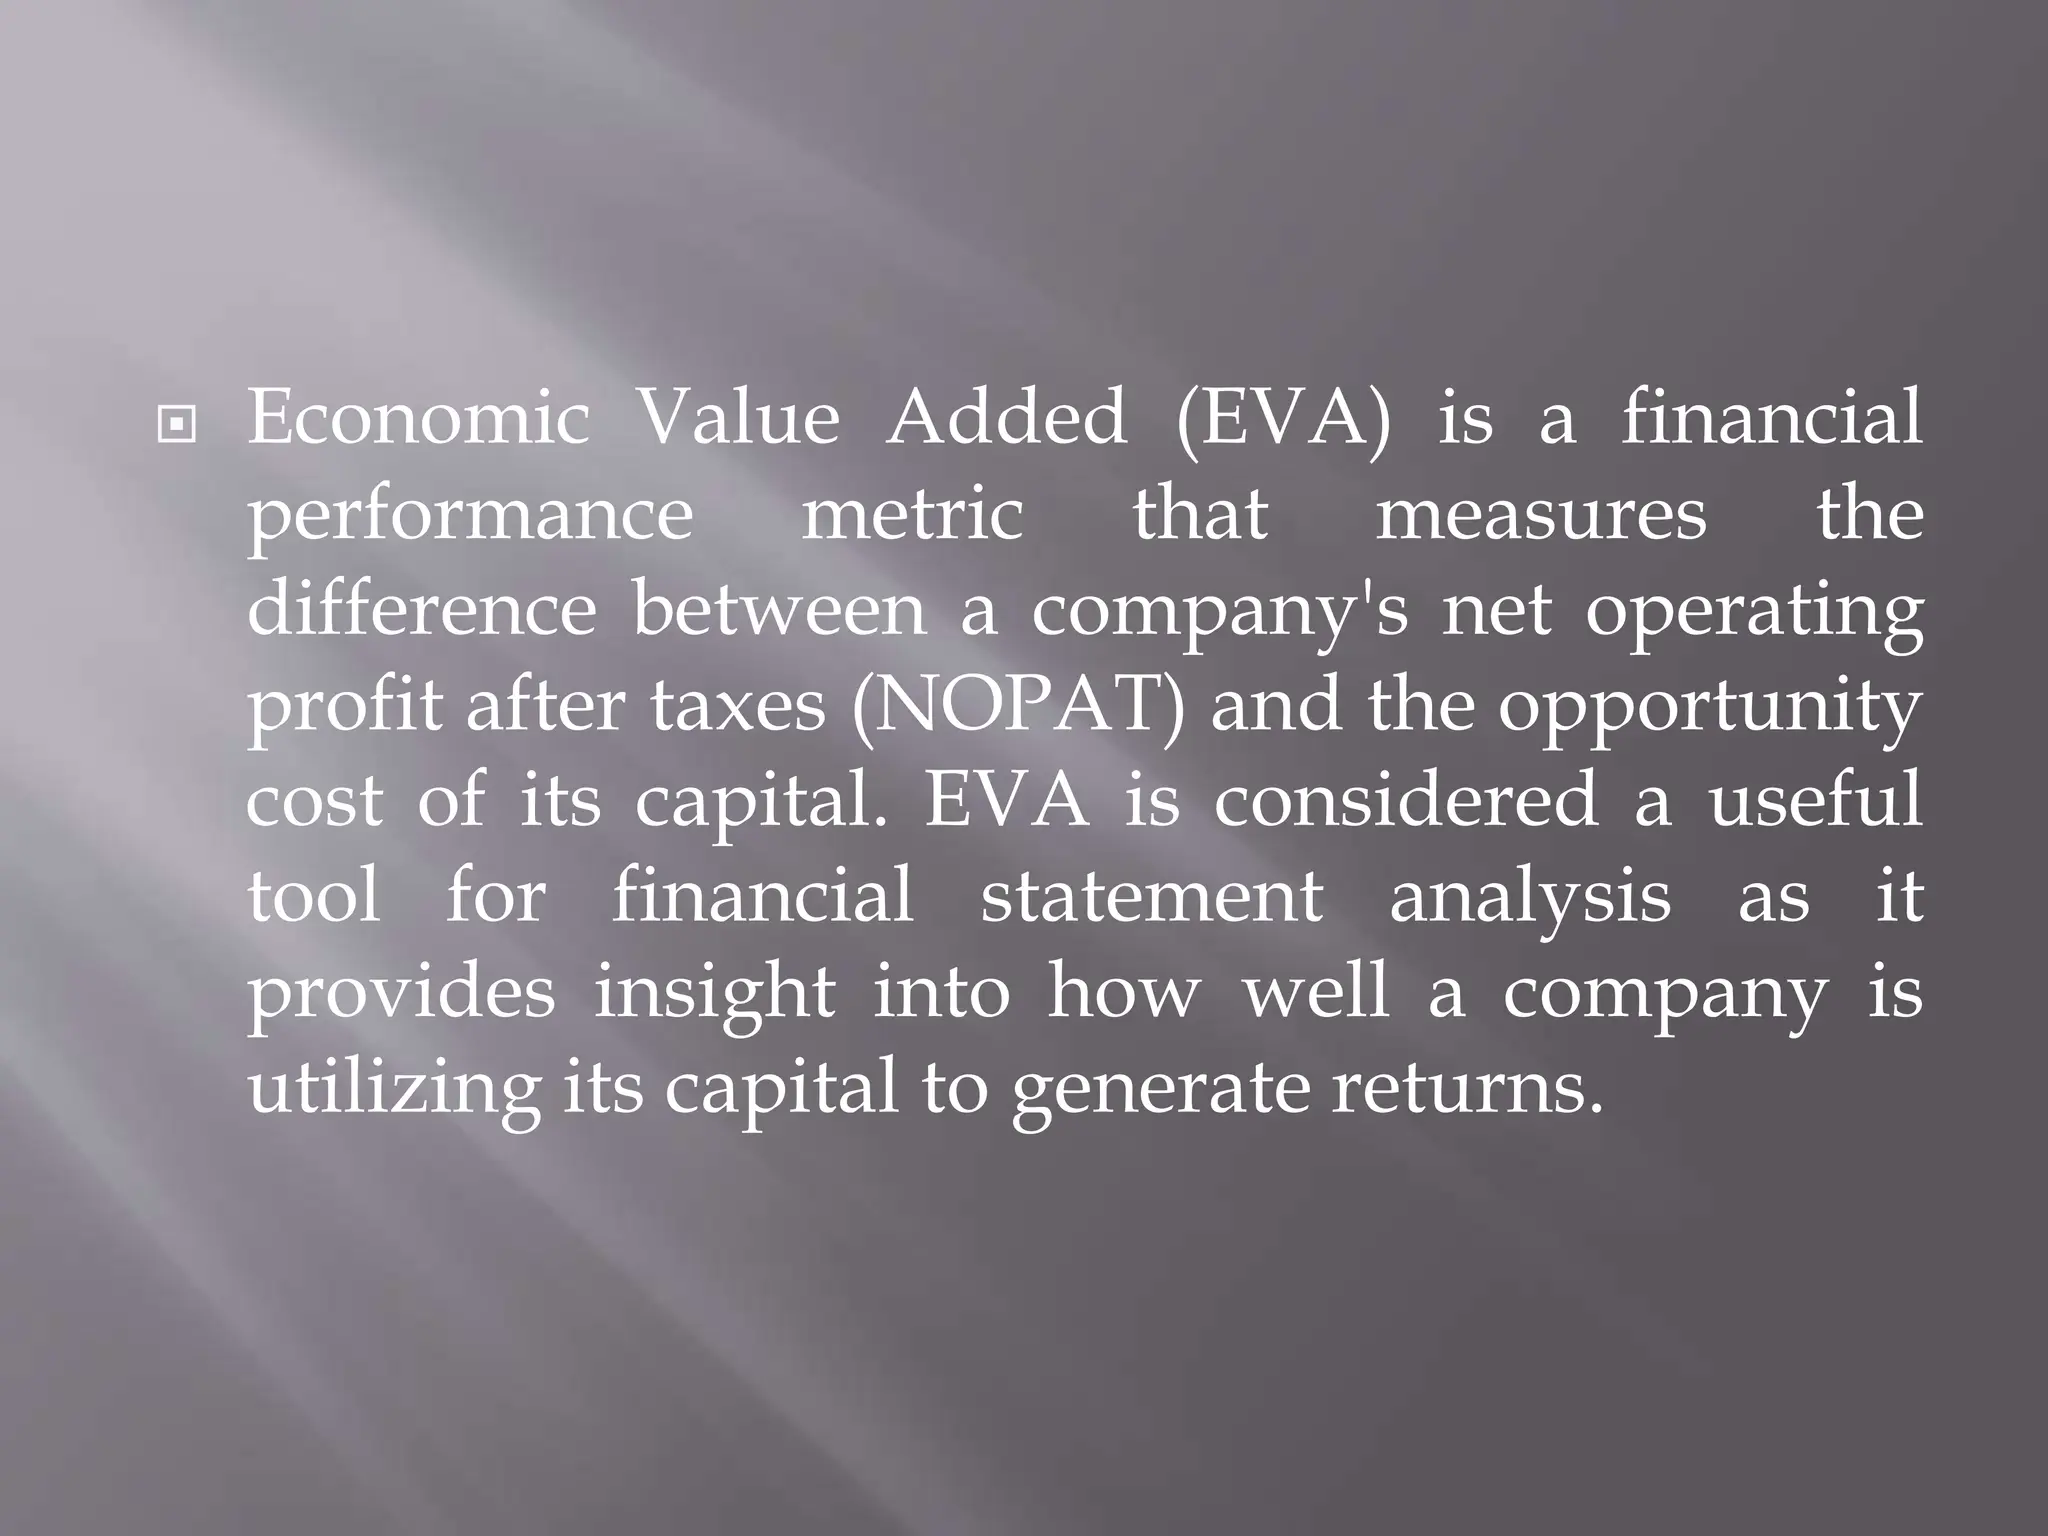
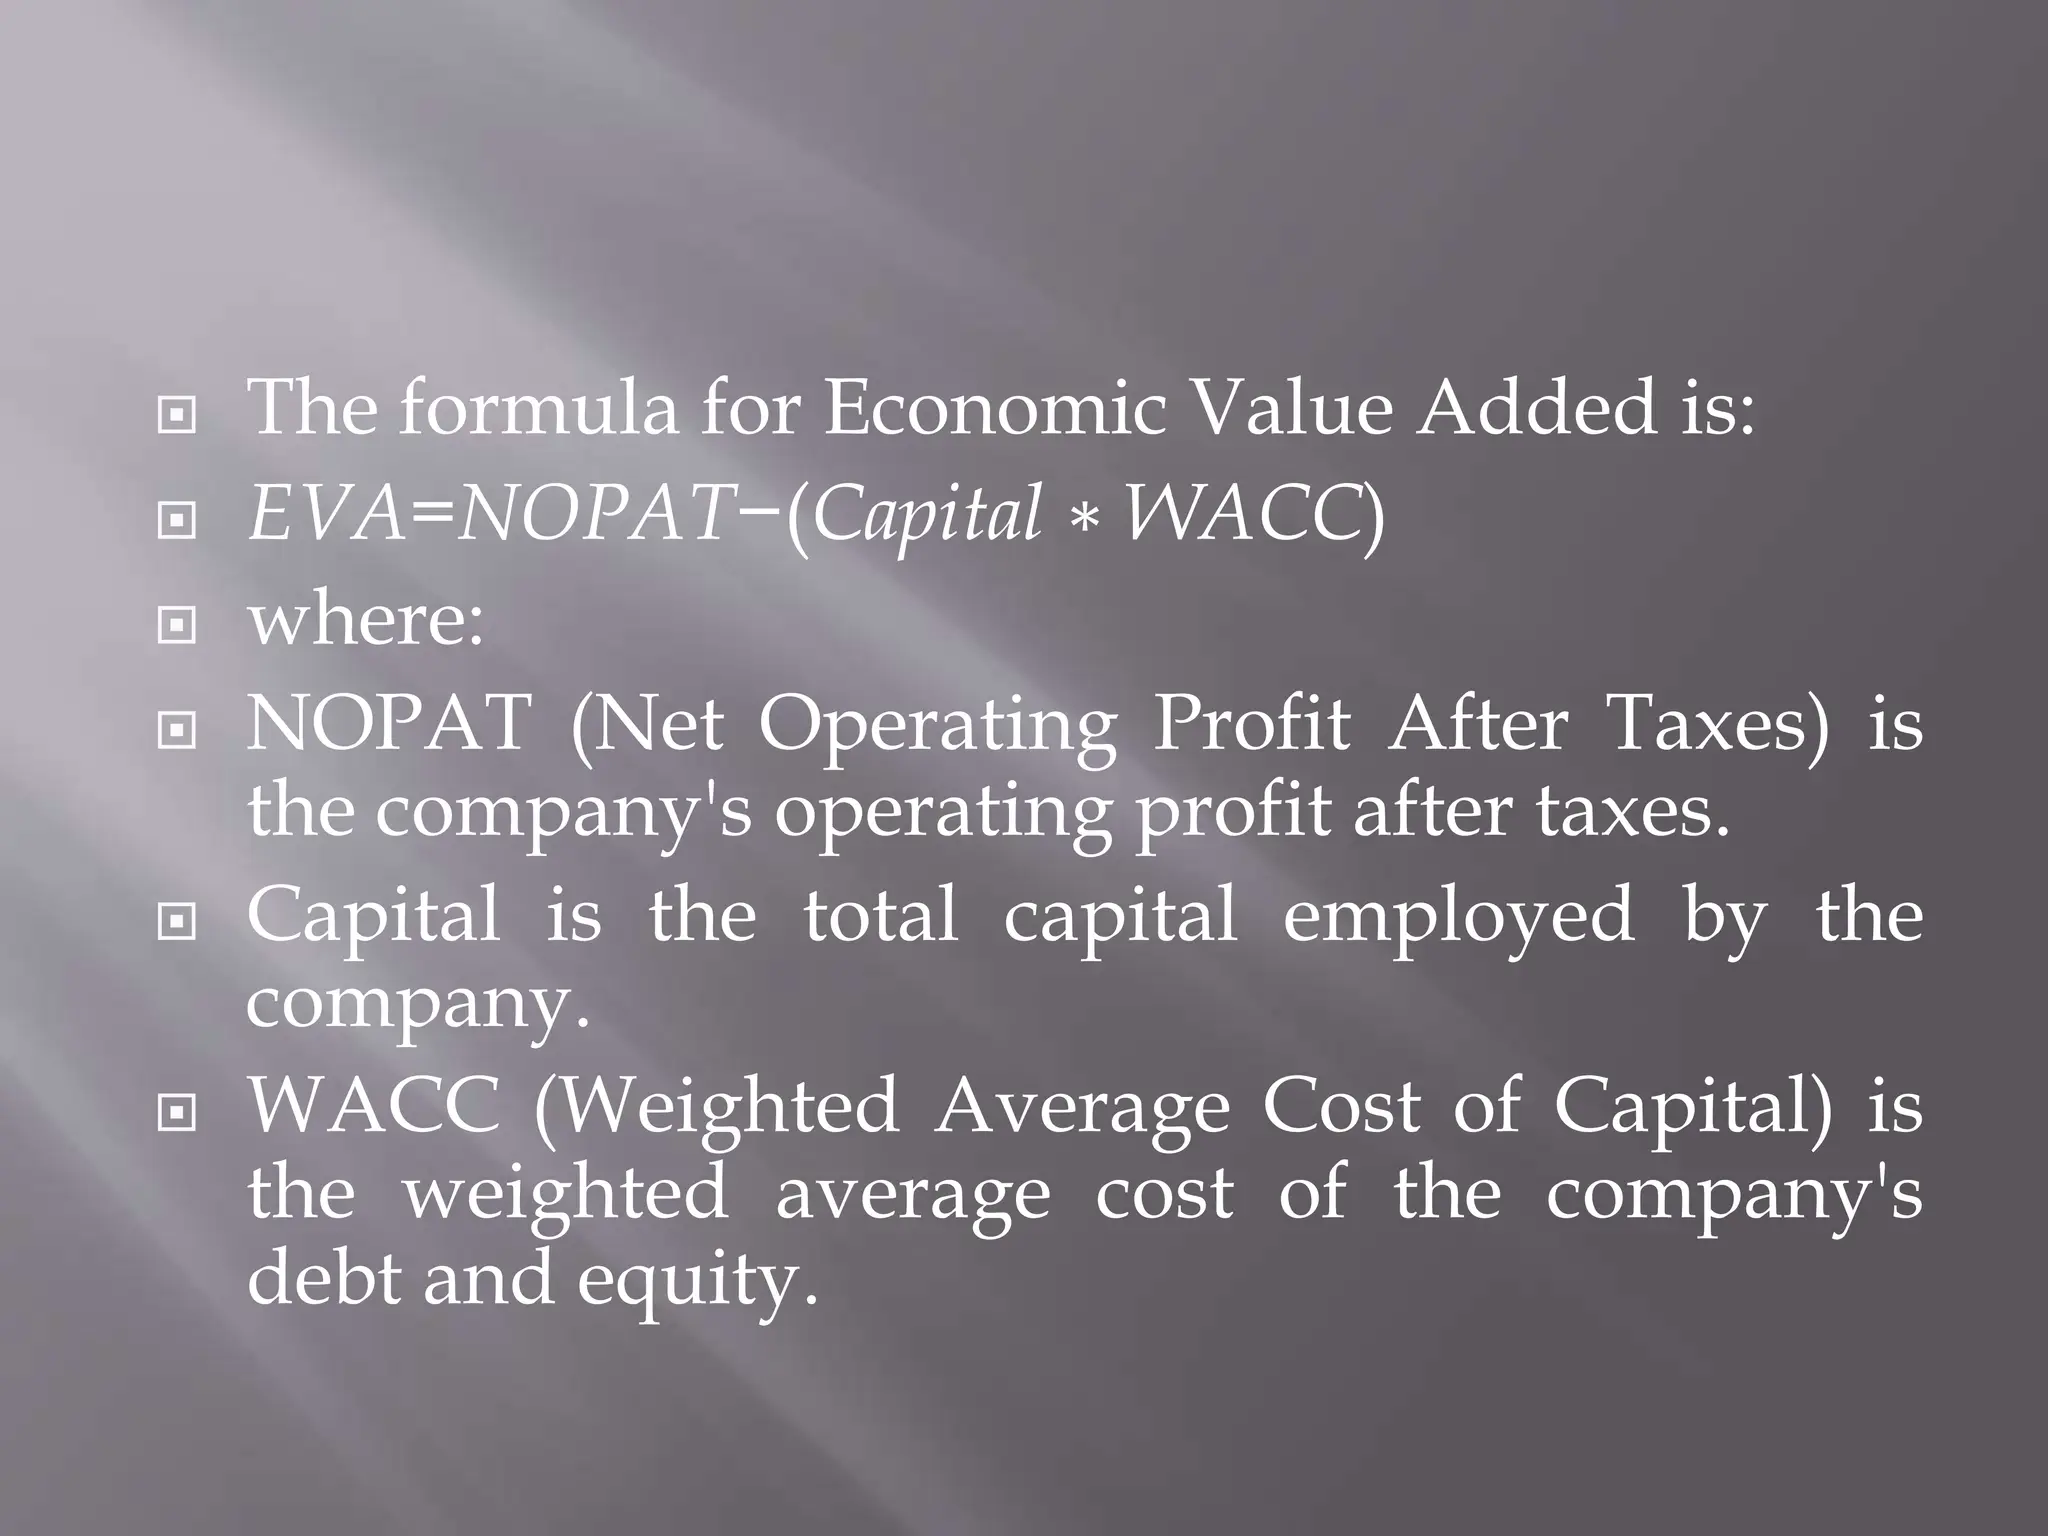
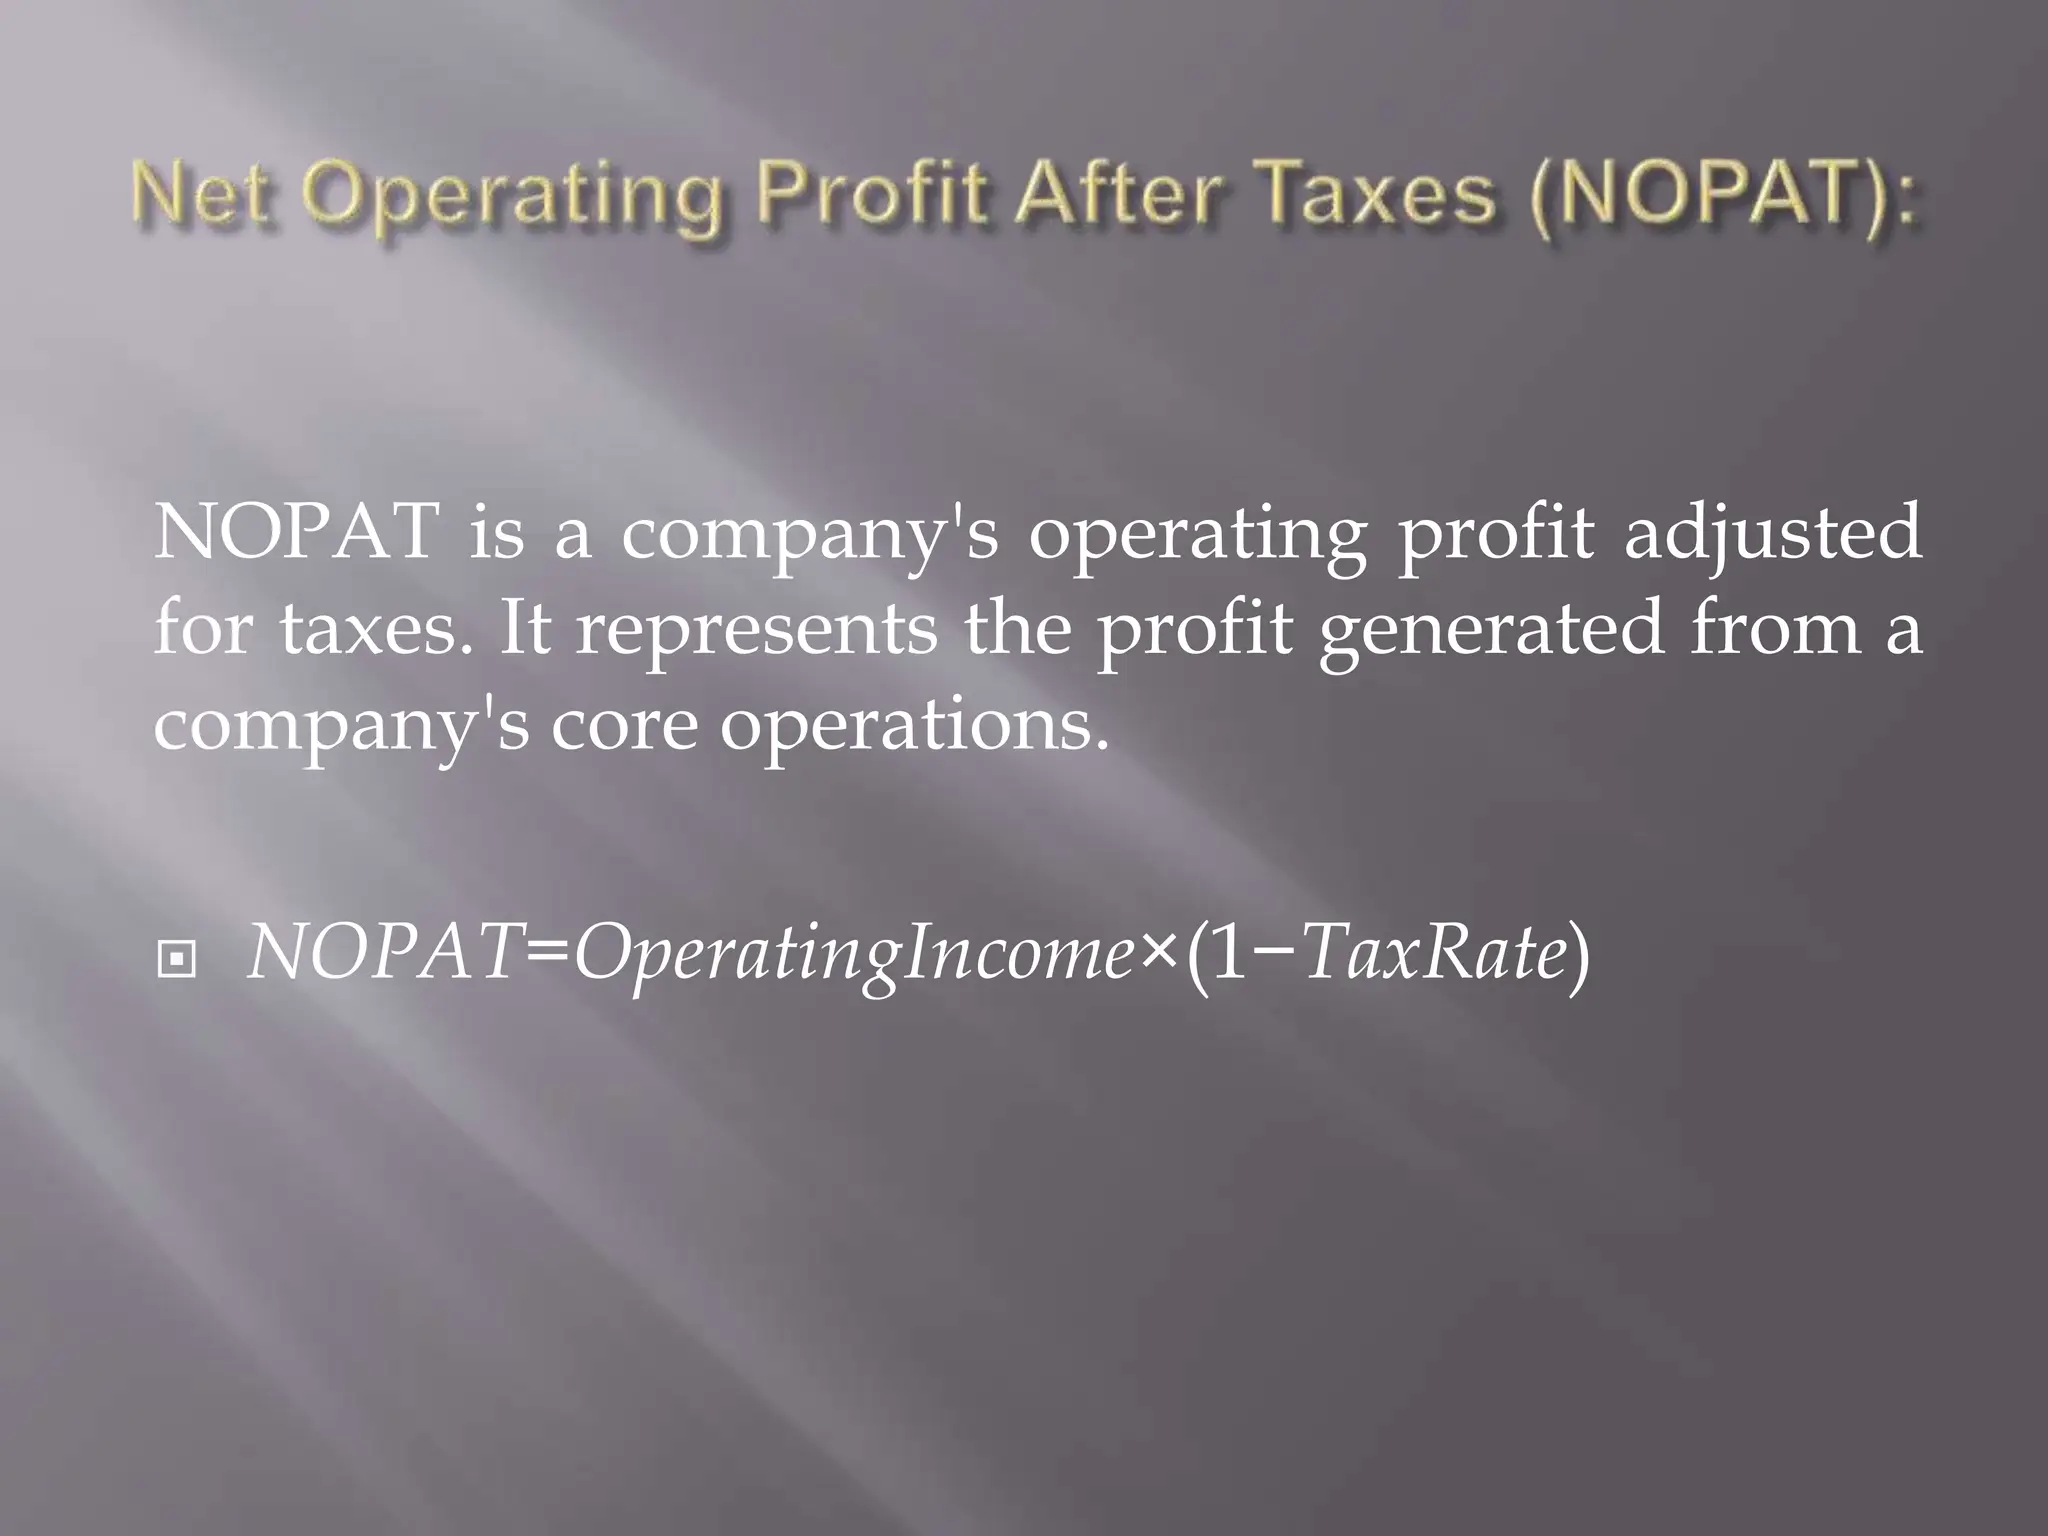
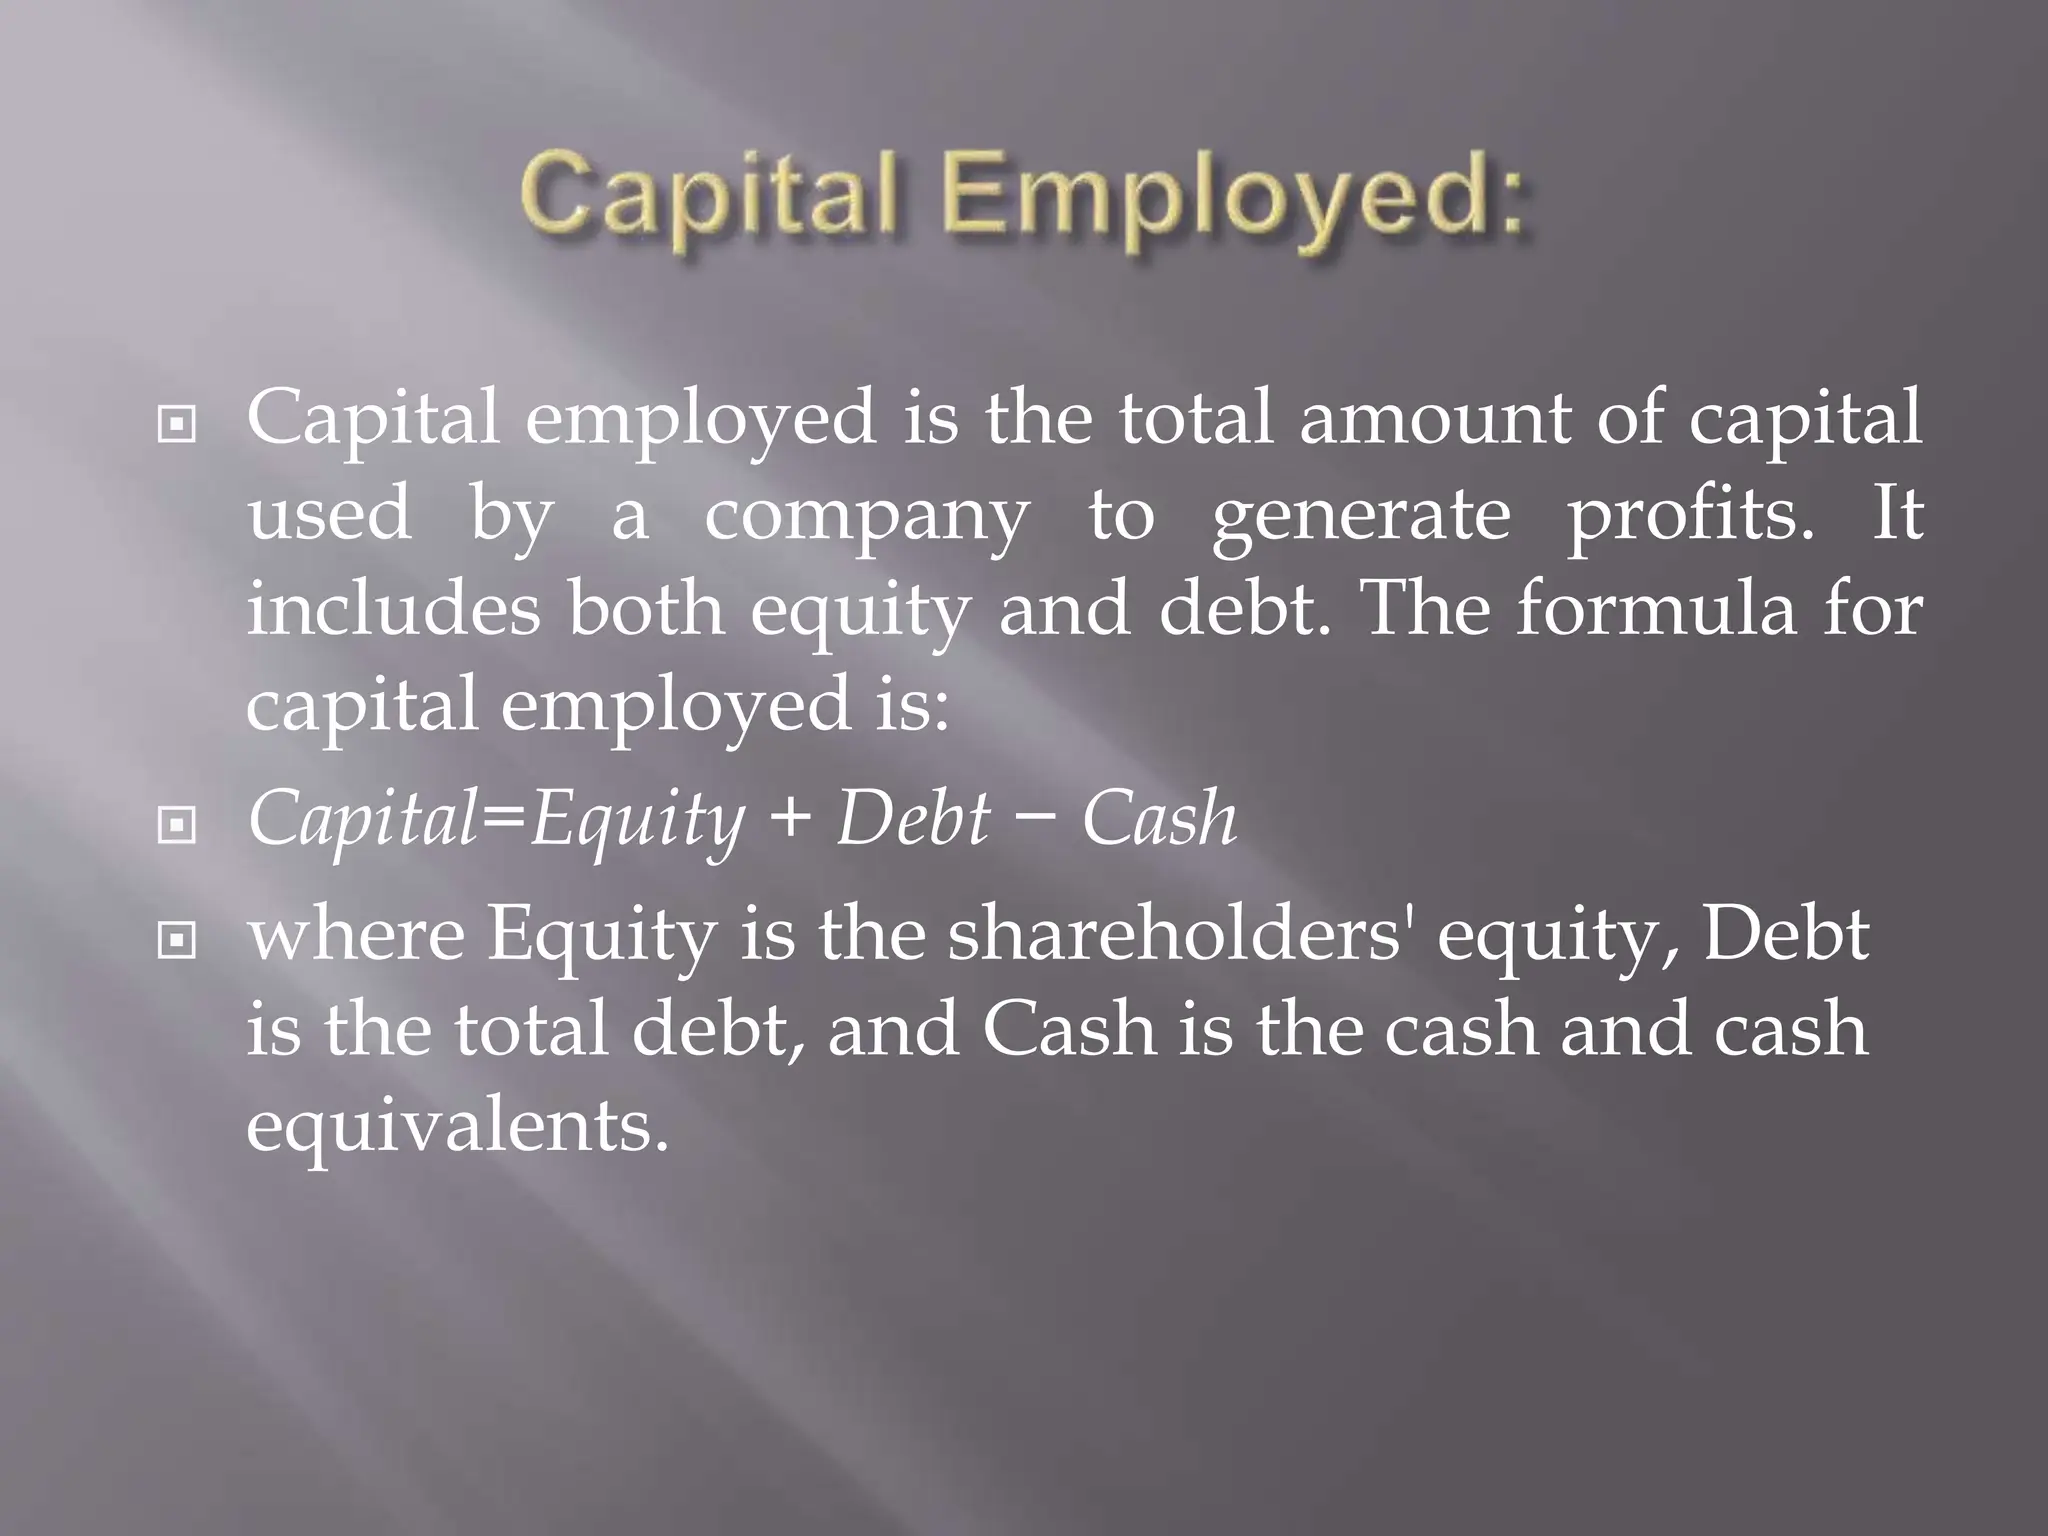
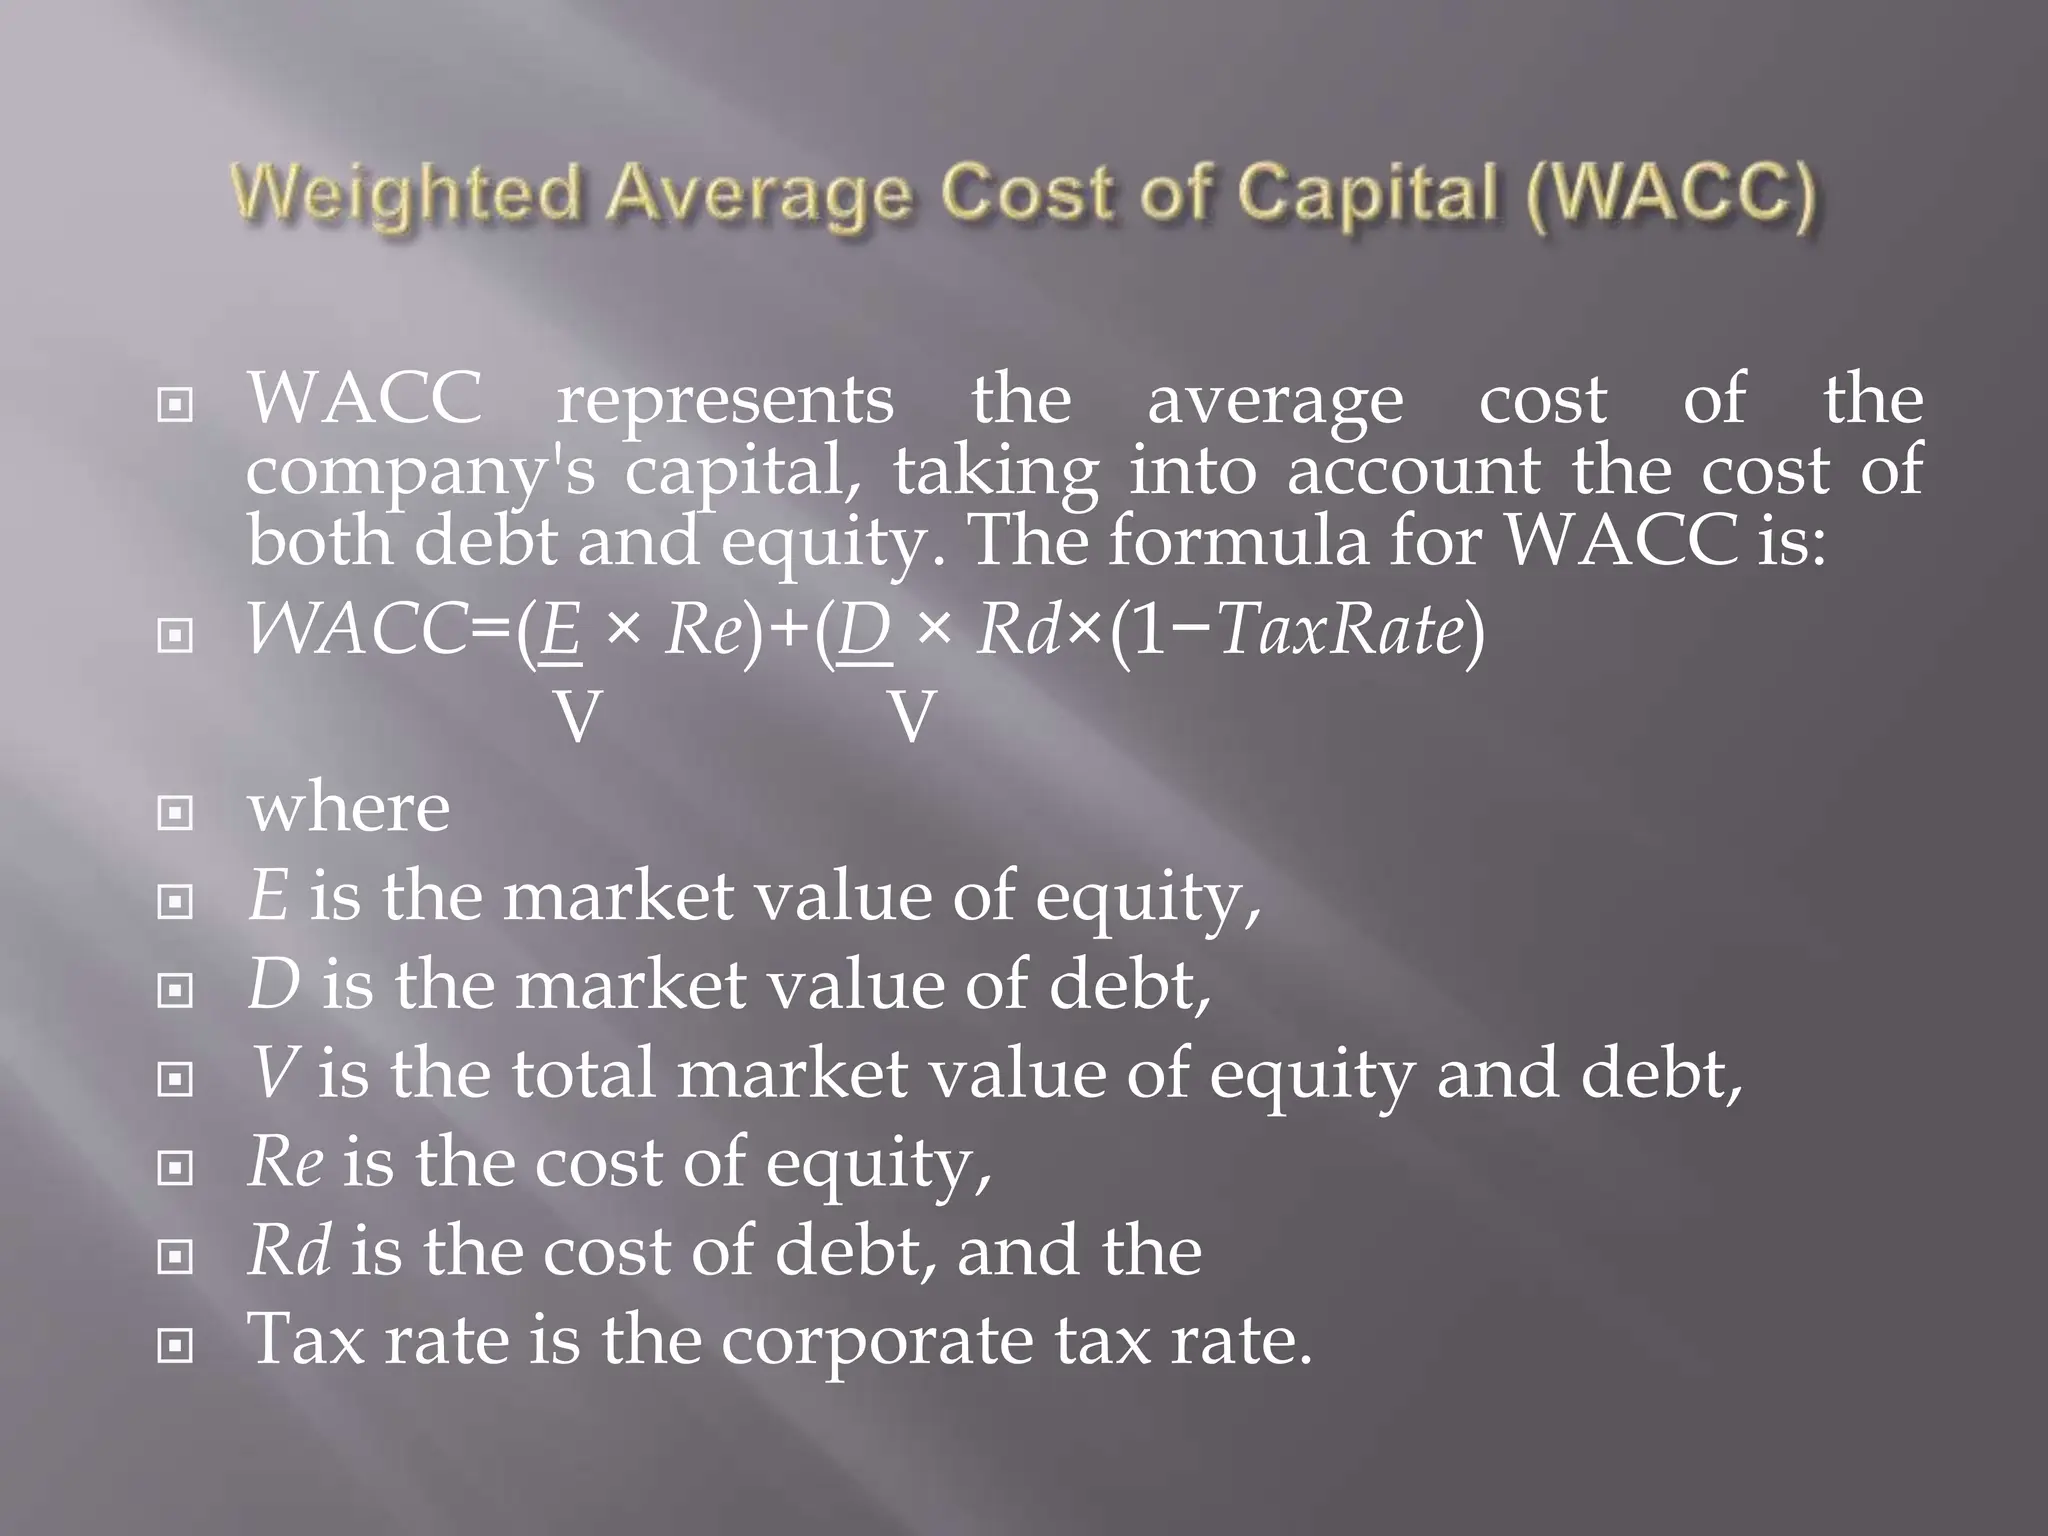
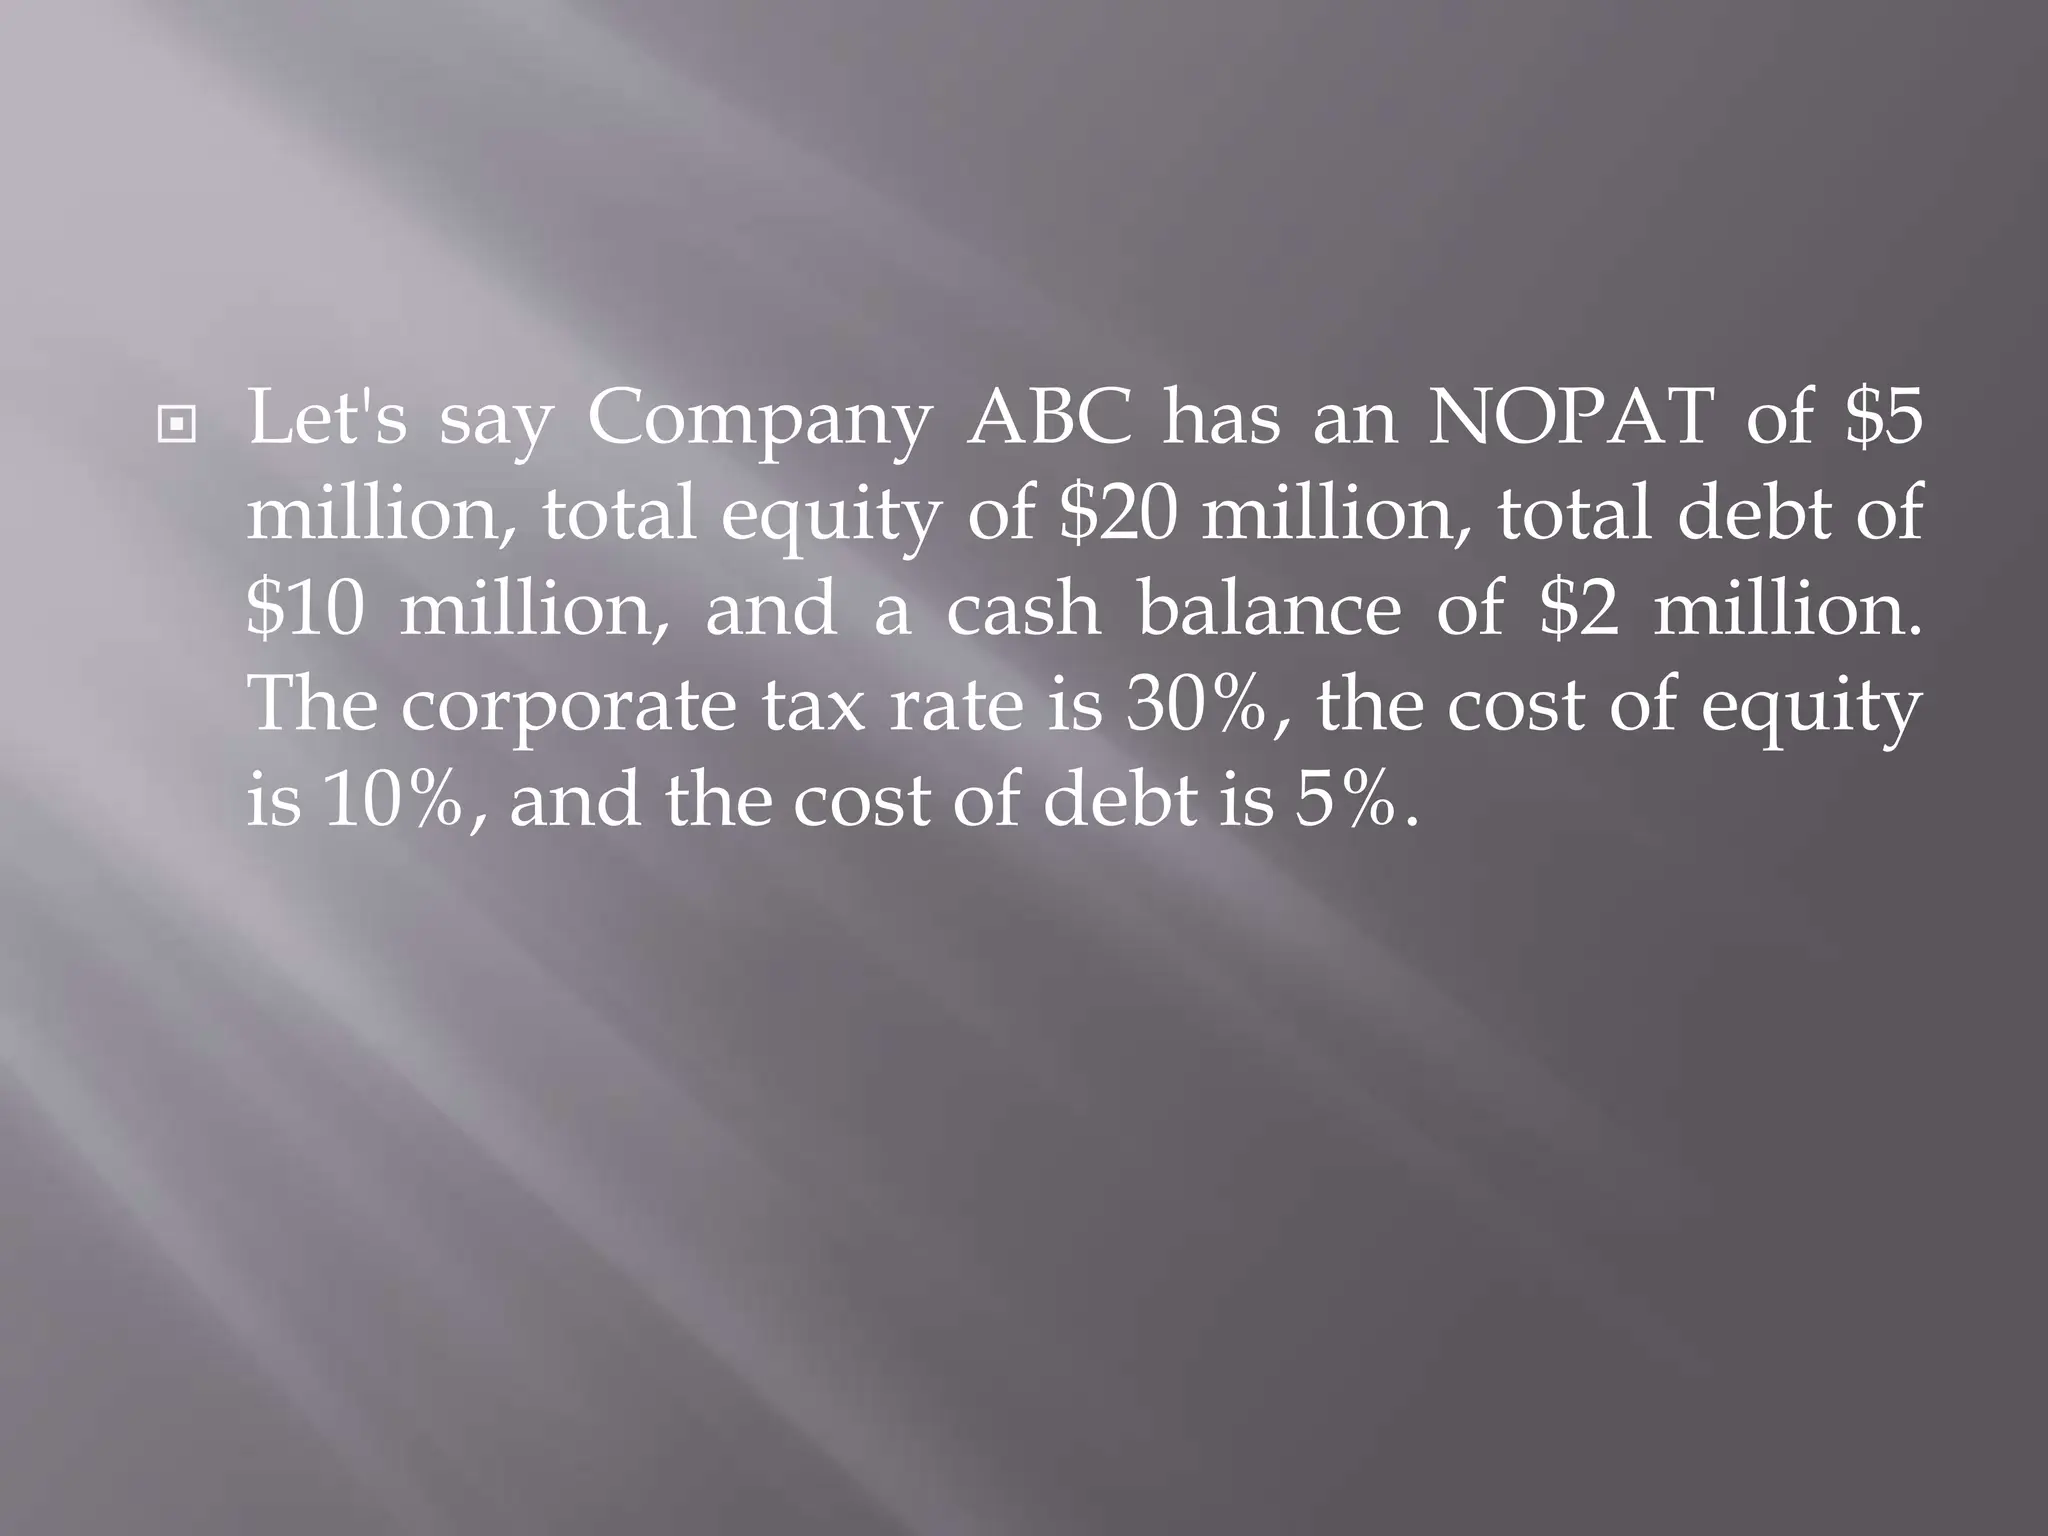
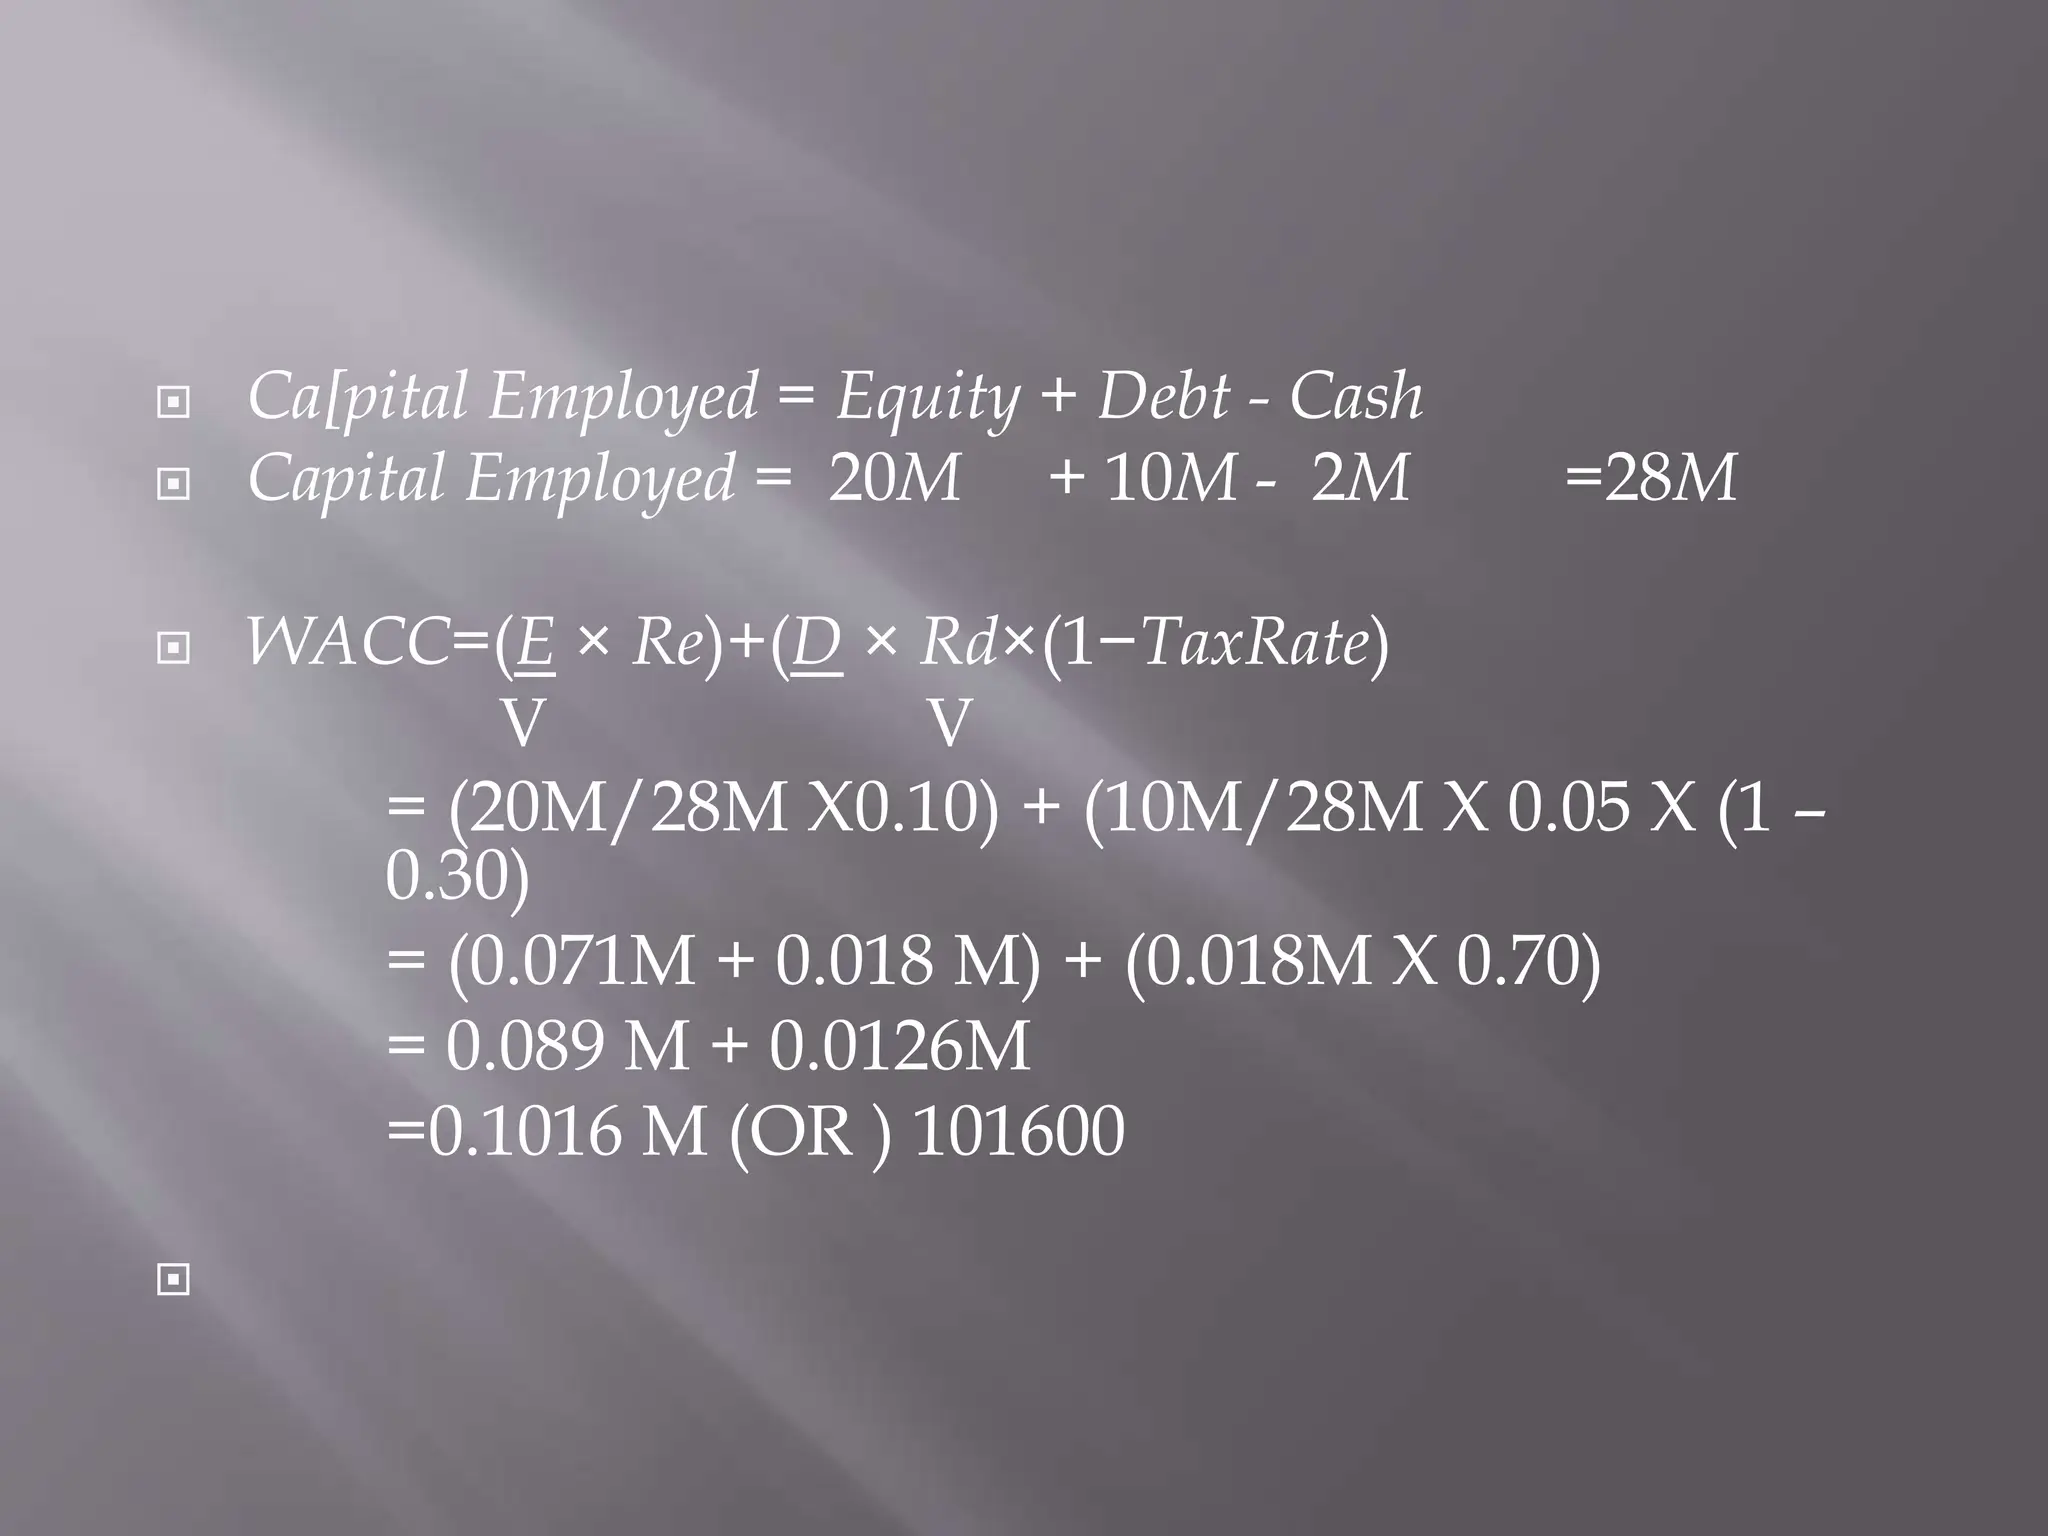
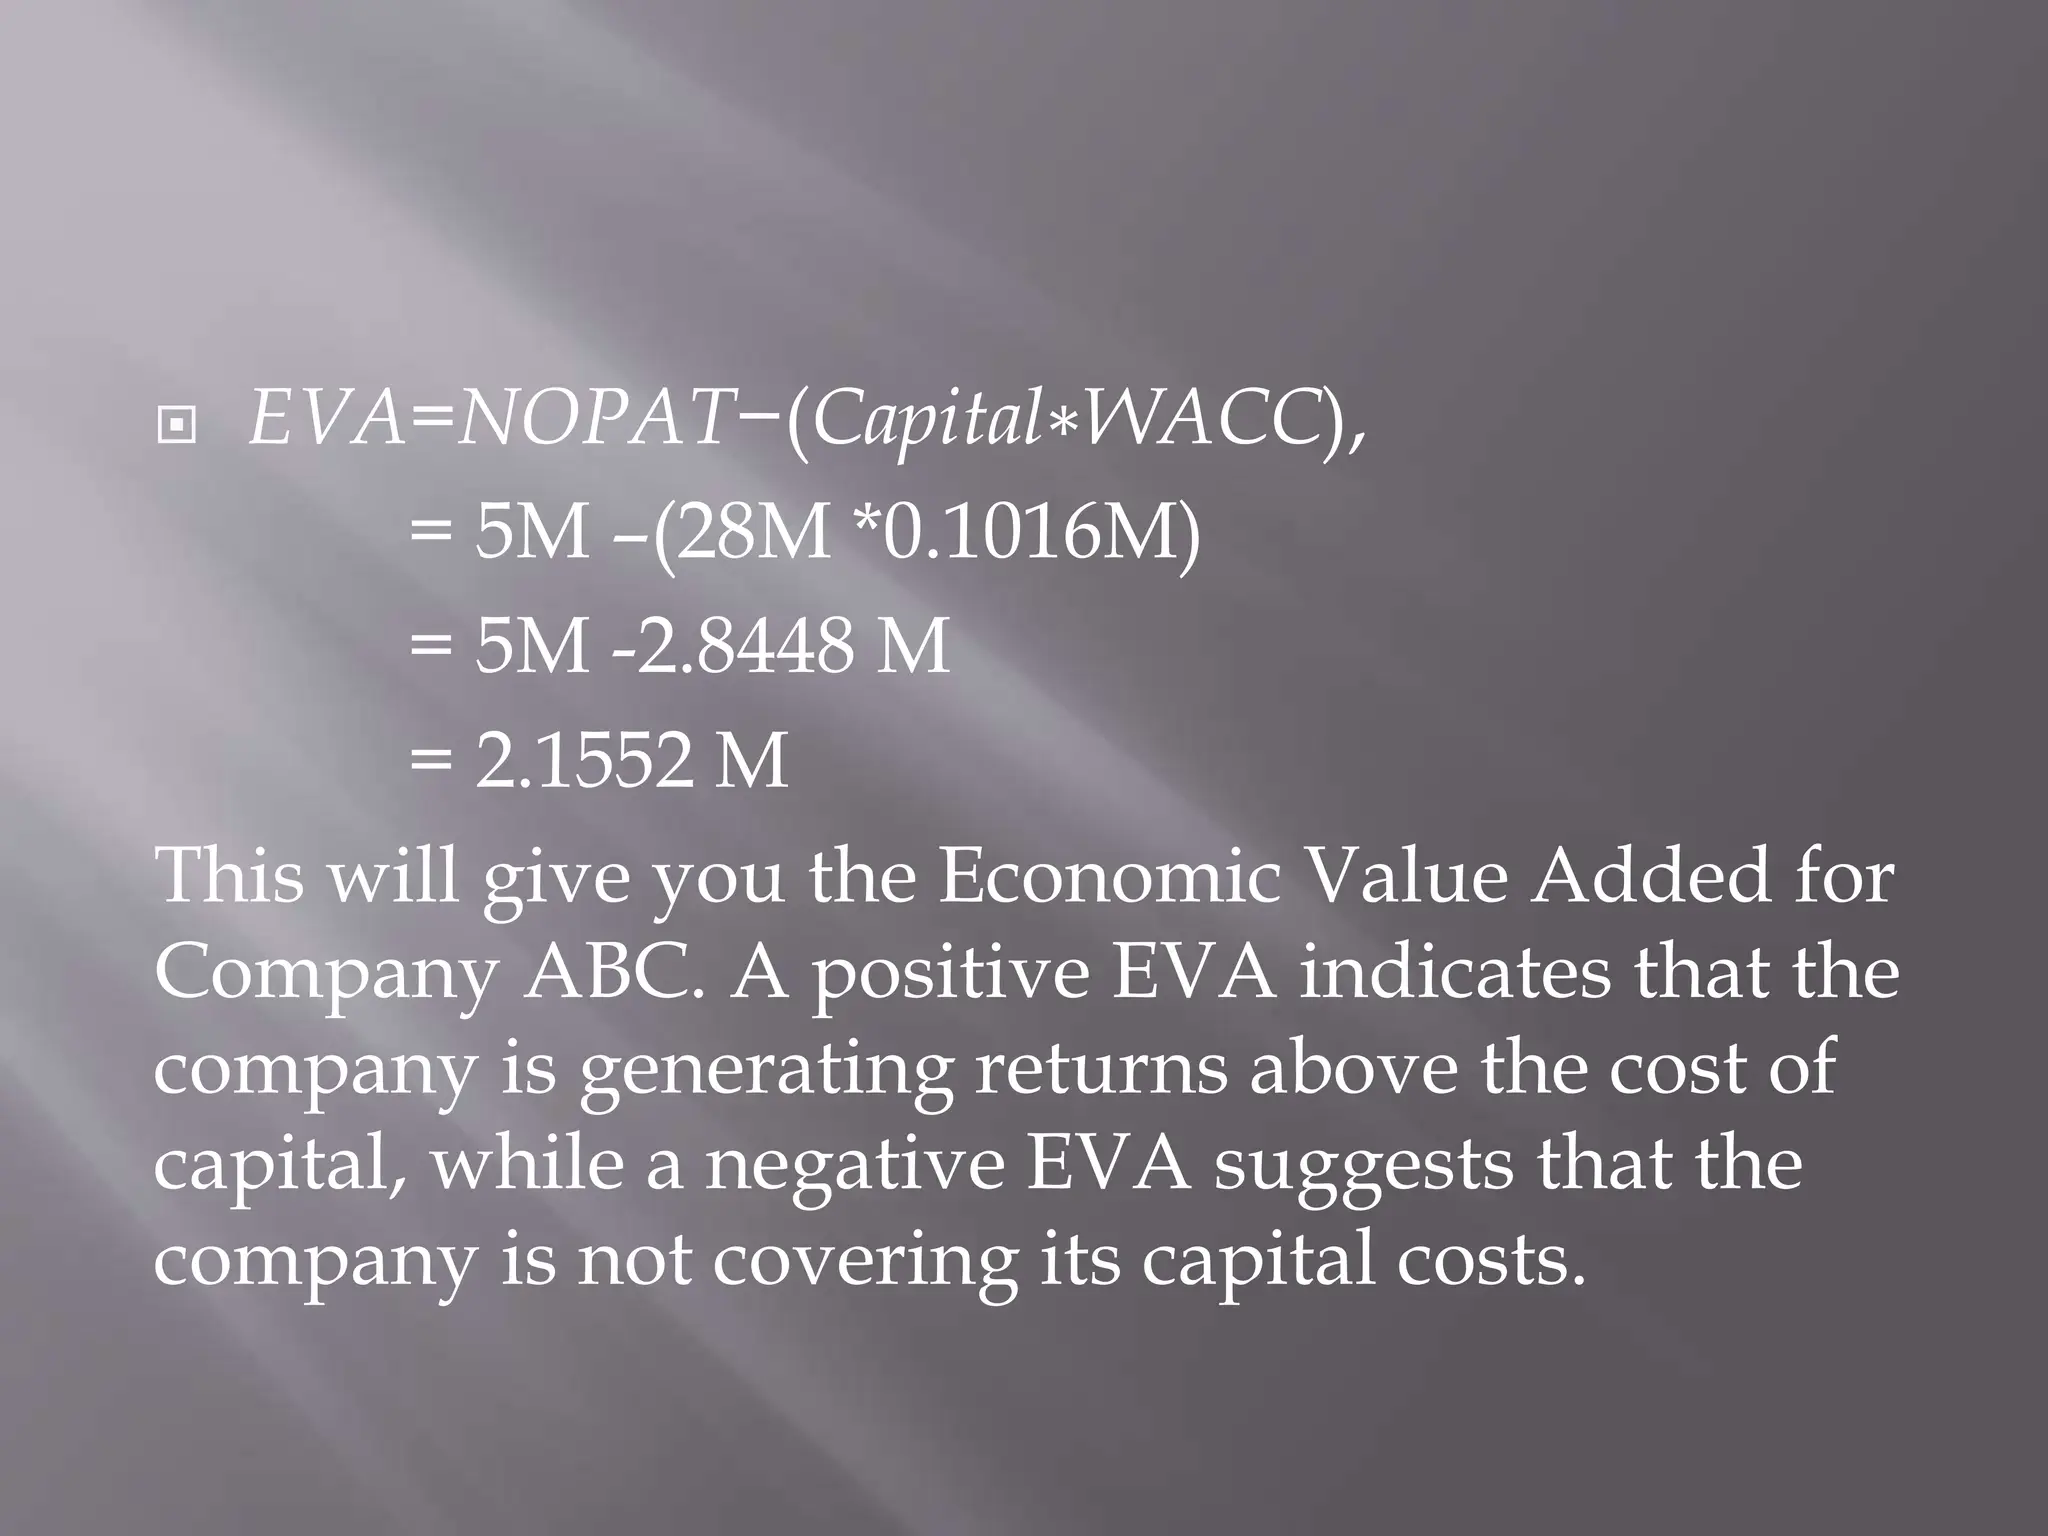
SlideShare a Scribd company logo
1 of 34
Shareholder Value Added (SVA) is a financial metric
that measures the value a company has added for its
shareholders over time. It is calculated by subtracting
the cost of capital from the net operating profit after
taxes (NOPAT).
 SVA=NOPAT−CC
 Here:
 SVA=Sahreholders Value Added
 NOPAT= Net Operating profit After Tax
 CC= Cost of Capital
 NOPAT=EBIT×(1−T)
 Where:
 EBIT (Earnings Before Interest and Taxes) is the
company's operating profit.
 T is the corporate tax rate.
 Cost of Capital=Capital Employed×Weighted Average
Cost of Capital (WACC)
 Where:
 Capital Employed is the total amount of capital used
by the company (Equity + Debt).
 WACC is the weighted average cost of capital,
calculated as follows:
 WACC=Weight of Equity×Cost of Equity+Weight of Debt×Cost of Debt×(1−T)
Weight of Equity+Weight of Debt
 SVA=NOPAT−Cost of Capital
 Suppose a company has:
 EBIT = $500,000
 Tax rate (T) = 30%
 Equity = $1,000,000
 Debt = $500,000
 Cost of Equity = 10%
 Cost of Debt = 5%
 NOPAT=EBIT×(1−T)
 NOPAT=$500,000×(1−0.30)=$350,000
 WACC=Weight of Equity×Cost of Equity+Weight of Debt×Cost of Debt×(1−T)
Weight of Equity+Weight of Debt
 WACC=$1,000,000×0.10+$500,000×0.05×(1−0.30)
 $1,000,000+$500,000
 WACC= $100,000+$22,500
 $1,500,000
=0.0833 or 8.33%
 SVA=NOPAT−Cost of Capital
 SVA=$350,000−($1,500,000×0.0833)
 SVA= $350,000−$124,950
 SVA=$225,050
 So, the Shareholder Value Added (SVA) for this example is
$225,050. This positive value indicates that the company has
added value for its shareholders.

 Market Value Added (MVA) is a financial
metric used in financial statement analysis to
assess the value a company has added to its
shareholders' wealth. It is calculated by taking
the difference between the market value of a
company's equity and the total capital invested
in it.
 MVA=Market Value of Equity−Total Capital Invested
 This is the total market value of a company's
outstanding shares of stock. It is calculated by
multiplying the current market price per share
by the total number of outstanding shares.
 MVE=Current Market Price per Share × Number of Outstanding Shares
 This includes the total capital that has been
invested in the company, which is the sum of
equity and debt. The formula for total capital
is:
 Total Capital= Equity + Debt
 MVE = Current Market Price of Share X No. of shares outstanding
 MVE = $50 X 1,000,000 = $50,000,000
 Next, calculate the total capital:
 Total Capital =Equity + Debt
 = $30,000,000 + $20,000,000
 = $50,000,000
 MVA=Market Value of Equity−Total Capital Invested
 MVA = $50,000,000 - $50,000,000 = $0
 the Market Value Added is $0, indicating that
the market value of equity is equal to the total
capital invested. A positive MVA would
suggest that the company has added value for
its shareholders, while a negative MVA would
imply the opposite.
 ECONOMIC VALUE ADDED
 Economic Value Added (EVA) is a financial
performance metric that measures the
difference between a company's net operating
profit after taxes (NOPAT) and the opportunity
cost of its capital. EVA is considered a useful
tool for financial statement analysis as it
provides insight into how well a company is
utilizing its capital to generate returns.
 The formula for Economic Value Added is:
 EVA=NOPAT−(Capital ∗ WACC)
 where:
 NOPAT (Net Operating Profit After Taxes) is
the company's operating profit after taxes.
 Capital is the total capital employed by the
company.
 WACC (Weighted Average Cost of Capital) is
the weighted average cost of the company's
debt and equity.
NOPAT is a company's operating profit adjusted
for taxes. It represents the profit generated from a
company's core operations.
 NOPAT=OperatingIncome×(1−TaxRate)
 Capital employed is the total amount of capital
used by a company to generate profits. It
includes both equity and debt. The formula for
capital employed is:
 Capital=Equity + Debt − Cash
 where Equity is the shareholders' equity, Debt
is the total debt, and Cash is the cash and cash
equivalents.
 WACC represents the average cost of the
company's capital, taking into account the cost of
both debt and equity. The formula for WACC is:
 WACC=(E × Re)+(D × Rd×(1−TaxRate)
V V
 where
 E is the market value of equity,
 D is the market value of debt,
 V is the total market value of equity and debt,
 Re is the cost of equity,
 Rd is the cost of debt, and the
 Tax rate is the corporate tax rate.
 Let's say Company ABC has an NOPAT of $5
million, total equity of $20 million, total debt of
$10 million, and a cash balance of $2 million.
The corporate tax rate is 30%, the cost of equity
is 10%, and the cost of debt is 5%.
 Ca[pital Employed = Equity + Debt - Cash
 Capital Employed = 20M + 10M - 2M =28M
 WACC=(E × Re)+(D × Rd×(1−TaxRate)
V V
= (20M/28M X0.10) + (10M/28M X 0.05 X (1 –
0.30)
= (0.071M + 0.018 M) + (0.018M X 0.70)
= 0.089 M + 0.0126M
=0.1016 M (OR ) 101600

 EVA=NOPAT−(Capital∗WACC),
= 5M –(28M *0.1016M)
= 5M -2.8448 M
= 2.1552 M
This will give you the Economic Value Added for
Company ABC. A positive EVA indicates that the
company is generating returns above the cost of
capital, while a negative EVA suggests that the
company is not covering its capital costs.
 Financial statement analysis involves the
examination of a company's financial
statements to assess its financial health and
performance. Wealth generation and
distribution are key aspects of financial
statement analysis, and they can be understood
through various financial metrics and
statements. Here's how wealth generation and
distribution are reflected in financial
statements:
 Wealth Generation:
 The income statement, also known as the profit
and loss statement, provides information about
a company's revenues, expenses, and profits
over a specific period. Positive net income
indicates wealth generation, as it represents the
profit earned by the company.
 Wealth Distribution:
 Dividends paid to shareholders are a form of
wealth distribution. The income statement does
not explicitly show dividends, but retained
earnings (net income minus dividends) on the
statement of changes in equity reflects the
portion of wealth retained for business growth
rather than distributed to shareholders.
 Wealth Generation:
 The balance sheet provides a snapshot of a
company's assets, liabilities, and equity at a
specific point in time. Positive equity,
represented by assets exceeding liabilities,
indicates wealth generation.
 Wealth Distribution:
 Dividends paid are also reflected in the
balance sheet under the equity section as a
reduction in retained earnings.
 Wealth Generation:
 Positive cash flow from operating activities
indicates the generation of cash wealth from
the company's core business operations.
 Wealth Distribution:
 Cash payments for dividends are reported in
the financing activities section, reflecting the
distribution of wealth to shareholders.
 Wealth Generation:
 This statement shows changes in equity
accounts over a specific period. Net income
contributes to wealth generation, increasing
equity.
 Wealth Distribution:
 Dividends paid reduce retained earnings,
representing the distribution of wealth to
shareholders.
 Return on Equity (ROE):
 This ratio indicates how effectively a company
generates profit from shareholders' equity,
providing insights into wealth generation.
 Dividend Payout Ratio:
 This ratio measures the proportion of earnings
paid out as dividends, indicating the extent of
wealth distribution.
 Financial statement analysis allows
stakeholders to assess a company's ability to
generate wealth through profitability and
efficient use of resources. It also helps in
understanding how the company distributes
wealth, whether through dividends or retained
earnings for future growth. By analyzing
various financial metrics and statements,
investors and analysts can gain insights into a
company's overall financial performance and
health.

More Related Content

Similar to SHAREHOLDERS VALUE ADDED and Market Value Added

Capital structure
Capital structureCapital structure
Capital structureHome
 
Lecture 3 (chapter 6) accounting for finance
Lecture 3 (chapter 6) accounting for financeLecture 3 (chapter 6) accounting for finance
Lecture 3 (chapter 6) accounting for financeHareindranath Sivam
 
Measures of Cost of Capital
Measures of Cost of Capital Measures of Cost of Capital
Measures of Cost of Capital Kaminee Iresha
 
Net operating income approach
Net operating income approachNet operating income approach
Net operating income approachManas Dhibar
 
Capital structure analysis
Capital structure analysisCapital structure analysis
Capital structure analysislambavikash
 
Adl 13-financial-management
Adl 13-financial-managementAdl 13-financial-management
Adl 13-financial-managementHimanshu Jindal
 
Risk Analysis , Operating Performance and Value Ratios
Risk Analysis , Operating Performance and Value RatiosRisk Analysis , Operating Performance and Value Ratios
Risk Analysis , Operating Performance and Value RatiosOlufemi Feyisitan
 
Risk analysis , operating performance and value ratios
Risk analysis , operating performance and value ratiosRisk analysis , operating performance and value ratios
Risk analysis , operating performance and value ratiosFortuna Favi et Fortus Ltd.
 
Net operating income vs net operating income capital structure
Net operating income vs net operating income capital structureNet operating income vs net operating income capital structure
Net operating income vs net operating income capital structureTejas
 
Analysis of Financial Statements.(Ratio analysis, Du Pont system ,Effects of ...
Analysis of Financial Statements.(Ratio analysis, Du Pont system ,Effects of ...Analysis of Financial Statements.(Ratio analysis, Du Pont system ,Effects of ...
Analysis of Financial Statements.(Ratio analysis, Du Pont system ,Effects of ...Tanjin Tamanna urmi
 
Operating and financial leverage
Operating and financial leverageOperating and financial leverage
Operating and financial leverageNoman Ahmed Khan
 
0273685988 Ch16
0273685988 Ch160273685988 Ch16
0273685988 Ch16kpserver
 

Similar to SHAREHOLDERS VALUE ADDED and Market Value Added (20)

Capital structure
Capital structureCapital structure
Capital structure
 
Lecture 3 (chapter 6) accounting for finance
Lecture 3 (chapter 6) accounting for financeLecture 3 (chapter 6) accounting for finance
Lecture 3 (chapter 6) accounting for finance
 
FSA Chapter 9
FSA Chapter 9FSA Chapter 9
FSA Chapter 9
 
Accounts ppt
Accounts pptAccounts ppt
Accounts ppt
 
Ratio analysis
Ratio analysisRatio analysis
Ratio analysis
 
Capital structure-theories
Capital structure-theoriesCapital structure-theories
Capital structure-theories
 
Measures of Cost of Capital
Measures of Cost of Capital Measures of Cost of Capital
Measures of Cost of Capital
 
Net operating income approach
Net operating income approachNet operating income approach
Net operating income approach
 
Financial Management
Financial Management Financial Management
Financial Management
 
Capital structure analysis
Capital structure analysisCapital structure analysis
Capital structure analysis
 
Chap4 (1 15)
Chap4 (1 15)Chap4 (1 15)
Chap4 (1 15)
 
Adl 13-financial-management
Adl 13-financial-managementAdl 13-financial-management
Adl 13-financial-management
 
optimal capital structure
optimal capital structureoptimal capital structure
optimal capital structure
 
Risk Analysis , Operating Performance and Value Ratios
Risk Analysis , Operating Performance and Value RatiosRisk Analysis , Operating Performance and Value Ratios
Risk Analysis , Operating Performance and Value Ratios
 
Risk analysis , operating performance and value ratios
Risk analysis , operating performance and value ratiosRisk analysis , operating performance and value ratios
Risk analysis , operating performance and value ratios
 
Net operating income vs net operating income capital structure
Net operating income vs net operating income capital structureNet operating income vs net operating income capital structure
Net operating income vs net operating income capital structure
 
Analysis of Financial Statements.(Ratio analysis, Du Pont system ,Effects of ...
Analysis of Financial Statements.(Ratio analysis, Du Pont system ,Effects of ...Analysis of Financial Statements.(Ratio analysis, Du Pont system ,Effects of ...
Analysis of Financial Statements.(Ratio analysis, Du Pont system ,Effects of ...
 
Wacc finance
Wacc financeWacc finance
Wacc finance
 
Operating and financial leverage
Operating and financial leverageOperating and financial leverage
Operating and financial leverage
 
0273685988 Ch16
0273685988 Ch160273685988 Ch16
0273685988 Ch16
 

Recently uploaded

Interactive Powerpoint_How to Master effective communication
Interactive Powerpoint_How to Master effective communicationInteractive Powerpoint_How to Master effective communication
Interactive Powerpoint_How to Master effective communicationnomboosow
 
Mastering the Unannounced Regulatory Inspection
Mastering the Unannounced Regulatory InspectionMastering the Unannounced Regulatory Inspection
Mastering the Unannounced Regulatory InspectionSafetyChain Software
 
Q4-W6-Restating Informational Text Grade 3
Q4-W6-Restating Informational Text Grade 3Q4-W6-Restating Informational Text Grade 3
Q4-W6-Restating Informational Text Grade 3JemimahLaneBuaron
 
CARE OF CHILD IN INCUBATOR..........pptx
CARE OF CHILD IN INCUBATOR..........pptxCARE OF CHILD IN INCUBATOR..........pptx
CARE OF CHILD IN INCUBATOR..........pptxGaneshChakor2
 
Measures of Central Tendency: Mean, Median and Mode
Measures of Central Tendency: Mean, Median and ModeMeasures of Central Tendency: Mean, Median and Mode
Measures of Central Tendency: Mean, Median and ModeThiyagu K
 
The byproduct of sericulture in different industries.pptx
The byproduct of sericulture in different industries.pptxThe byproduct of sericulture in different industries.pptx
The byproduct of sericulture in different industries.pptxShobhayan Kirtania
 
SOCIAL AND HISTORICAL CONTEXT - LFTVD.pptx
SOCIAL AND HISTORICAL CONTEXT - LFTVD.pptxSOCIAL AND HISTORICAL CONTEXT - LFTVD.pptx
SOCIAL AND HISTORICAL CONTEXT - LFTVD.pptxiammrhaywood
 
Sanyam Choudhary Chemistry practical.pdf
Sanyam Choudhary Chemistry practical.pdfSanyam Choudhary Chemistry practical.pdf
Sanyam Choudhary Chemistry practical.pdfsanyamsingh5019
 
The Most Excellent Way | 1 Corinthians 13
The Most Excellent Way | 1 Corinthians 13The Most Excellent Way | 1 Corinthians 13
The Most Excellent Way | 1 Corinthians 13Steve Thomason
 
APM Welcome, APM North West Network Conference, Synergies Across Sectors
APM Welcome, APM North West Network Conference, Synergies Across SectorsAPM Welcome, APM North West Network Conference, Synergies Across Sectors
APM Welcome, APM North West Network Conference, Synergies Across SectorsAssociation for Project Management
 
Measures of Dispersion and Variability: Range, QD, AD and SD
Measures of Dispersion and Variability: Range, QD, AD and SDMeasures of Dispersion and Variability: Range, QD, AD and SD
Measures of Dispersion and Variability: Range, QD, AD and SDThiyagu K
 
The basics of sentences session 2pptx copy.pptx
The basics of sentences session 2pptx copy.pptxThe basics of sentences session 2pptx copy.pptx
The basics of sentences session 2pptx copy.pptxheathfieldcps1
 
Activity 01 - Artificial Culture (1).pdf
Activity 01 - Artificial Culture (1).pdfActivity 01 - Artificial Culture (1).pdf
Activity 01 - Artificial Culture (1).pdfciinovamais
 
POINT- BIOCHEMISTRY SEM 2 ENZYMES UNIT 5.pptx
POINT- BIOCHEMISTRY SEM 2 ENZYMES UNIT 5.pptxPOINT- BIOCHEMISTRY SEM 2 ENZYMES UNIT 5.pptx
POINT- BIOCHEMISTRY SEM 2 ENZYMES UNIT 5.pptxSayali Powar
 
Web & Social Media Analytics Previous Year Question Paper.pdf
Web & Social Media Analytics Previous Year Question Paper.pdfWeb & Social Media Analytics Previous Year Question Paper.pdf
Web & Social Media Analytics Previous Year Question Paper.pdfJayanti Pande
 
Disha NEET Physics Guide for classes 11 and 12.pdf
Disha NEET Physics Guide for classes 11 and 12.pdfDisha NEET Physics Guide for classes 11 and 12.pdf
Disha NEET Physics Guide for classes 11 and 12.pdfchloefrazer622
 
Organic Name Reactions for the students and aspirants of Chemistry12th.pptx
Organic Name Reactions  for the students and aspirants of Chemistry12th.pptxOrganic Name Reactions  for the students and aspirants of Chemistry12th.pptx
Organic Name Reactions for the students and aspirants of Chemistry12th.pptxVS Mahajan Coaching Centre
 

Recently uploaded (20)

Interactive Powerpoint_How to Master effective communication
Interactive Powerpoint_How to Master effective communicationInteractive Powerpoint_How to Master effective communication
Interactive Powerpoint_How to Master effective communication
 
INDIA QUIZ 2024 RLAC DELHI UNIVERSITY.pptx
INDIA QUIZ 2024 RLAC DELHI UNIVERSITY.pptxINDIA QUIZ 2024 RLAC DELHI UNIVERSITY.pptx
INDIA QUIZ 2024 RLAC DELHI UNIVERSITY.pptx
 
Mastering the Unannounced Regulatory Inspection
Mastering the Unannounced Regulatory InspectionMastering the Unannounced Regulatory Inspection
Mastering the Unannounced Regulatory Inspection
 
Código Creativo y Arte de Software | Unidad 1
Código Creativo y Arte de Software | Unidad 1Código Creativo y Arte de Software | Unidad 1
Código Creativo y Arte de Software | Unidad 1
 
Q4-W6-Restating Informational Text Grade 3
Q4-W6-Restating Informational Text Grade 3Q4-W6-Restating Informational Text Grade 3
Q4-W6-Restating Informational Text Grade 3
 
CARE OF CHILD IN INCUBATOR..........pptx
CARE OF CHILD IN INCUBATOR..........pptxCARE OF CHILD IN INCUBATOR..........pptx
CARE OF CHILD IN INCUBATOR..........pptx
 
Measures of Central Tendency: Mean, Median and Mode
Measures of Central Tendency: Mean, Median and ModeMeasures of Central Tendency: Mean, Median and Mode
Measures of Central Tendency: Mean, Median and Mode
 
The byproduct of sericulture in different industries.pptx
The byproduct of sericulture in different industries.pptxThe byproduct of sericulture in different industries.pptx
The byproduct of sericulture in different industries.pptx
 
SOCIAL AND HISTORICAL CONTEXT - LFTVD.pptx
SOCIAL AND HISTORICAL CONTEXT - LFTVD.pptxSOCIAL AND HISTORICAL CONTEXT - LFTVD.pptx
SOCIAL AND HISTORICAL CONTEXT - LFTVD.pptx
 
Sanyam Choudhary Chemistry practical.pdf
Sanyam Choudhary Chemistry practical.pdfSanyam Choudhary Chemistry practical.pdf
Sanyam Choudhary Chemistry practical.pdf
 
The Most Excellent Way | 1 Corinthians 13
The Most Excellent Way | 1 Corinthians 13The Most Excellent Way | 1 Corinthians 13
The Most Excellent Way | 1 Corinthians 13
 
APM Welcome, APM North West Network Conference, Synergies Across Sectors
APM Welcome, APM North West Network Conference, Synergies Across SectorsAPM Welcome, APM North West Network Conference, Synergies Across Sectors
APM Welcome, APM North West Network Conference, Synergies Across Sectors
 
Measures of Dispersion and Variability: Range, QD, AD and SD
Measures of Dispersion and Variability: Range, QD, AD and SDMeasures of Dispersion and Variability: Range, QD, AD and SD
Measures of Dispersion and Variability: Range, QD, AD and SD
 
The basics of sentences session 2pptx copy.pptx
The basics of sentences session 2pptx copy.pptxThe basics of sentences session 2pptx copy.pptx
The basics of sentences session 2pptx copy.pptx
 
Mattingly "AI & Prompt Design: The Basics of Prompt Design"
Mattingly "AI & Prompt Design: The Basics of Prompt Design"Mattingly "AI & Prompt Design: The Basics of Prompt Design"
Mattingly "AI & Prompt Design: The Basics of Prompt Design"
 
Activity 01 - Artificial Culture (1).pdf
Activity 01 - Artificial Culture (1).pdfActivity 01 - Artificial Culture (1).pdf
Activity 01 - Artificial Culture (1).pdf
 
POINT- BIOCHEMISTRY SEM 2 ENZYMES UNIT 5.pptx
POINT- BIOCHEMISTRY SEM 2 ENZYMES UNIT 5.pptxPOINT- BIOCHEMISTRY SEM 2 ENZYMES UNIT 5.pptx
POINT- BIOCHEMISTRY SEM 2 ENZYMES UNIT 5.pptx
 
Web & Social Media Analytics Previous Year Question Paper.pdf
Web & Social Media Analytics Previous Year Question Paper.pdfWeb & Social Media Analytics Previous Year Question Paper.pdf
Web & Social Media Analytics Previous Year Question Paper.pdf
 
Disha NEET Physics Guide for classes 11 and 12.pdf
Disha NEET Physics Guide for classes 11 and 12.pdfDisha NEET Physics Guide for classes 11 and 12.pdf
Disha NEET Physics Guide for classes 11 and 12.pdf
 
Organic Name Reactions for the students and aspirants of Chemistry12th.pptx
Organic Name Reactions  for the students and aspirants of Chemistry12th.pptxOrganic Name Reactions  for the students and aspirants of Chemistry12th.pptx
Organic Name Reactions for the students and aspirants of Chemistry12th.pptx
 

SHAREHOLDERS VALUE ADDED and Market Value Added

  • 1. Shareholder Value Added (SVA) is a financial metric that measures the value a company has added for its shareholders over time. It is calculated by subtracting the cost of capital from the net operating profit after taxes (NOPAT).
  • 2.  SVA=NOPAT−CC  Here:  SVA=Sahreholders Value Added  NOPAT= Net Operating profit After Tax  CC= Cost of Capital
  • 3.
  • 4.  NOPAT=EBIT×(1−T)  Where:  EBIT (Earnings Before Interest and Taxes) is the company's operating profit.  T is the corporate tax rate.
  • 5.  Cost of Capital=Capital Employed×Weighted Average Cost of Capital (WACC)  Where:  Capital Employed is the total amount of capital used by the company (Equity + Debt).  WACC is the weighted average cost of capital, calculated as follows:  WACC=Weight of Equity×Cost of Equity+Weight of Debt×Cost of Debt×(1−T) Weight of Equity+Weight of Debt
  • 7.  Suppose a company has:  EBIT = $500,000  Tax rate (T) = 30%  Equity = $1,000,000  Debt = $500,000  Cost of Equity = 10%  Cost of Debt = 5%
  • 9.  WACC=Weight of Equity×Cost of Equity+Weight of Debt×Cost of Debt×(1−T) Weight of Equity+Weight of Debt  WACC=$1,000,000×0.10+$500,000×0.05×(1−0.30)  $1,000,000+$500,000  WACC= $100,000+$22,500  $1,500,000 =0.0833 or 8.33%
  • 10.  SVA=NOPAT−Cost of Capital  SVA=$350,000−($1,500,000×0.0833)  SVA= $350,000−$124,950  SVA=$225,050  So, the Shareholder Value Added (SVA) for this example is $225,050. This positive value indicates that the company has added value for its shareholders. 
  • 11.  Market Value Added (MVA) is a financial metric used in financial statement analysis to assess the value a company has added to its shareholders' wealth. It is calculated by taking the difference between the market value of a company's equity and the total capital invested in it.
  • 12.  MVA=Market Value of Equity−Total Capital Invested
  • 13.  This is the total market value of a company's outstanding shares of stock. It is calculated by multiplying the current market price per share by the total number of outstanding shares.  MVE=Current Market Price per Share × Number of Outstanding Shares
  • 14.  This includes the total capital that has been invested in the company, which is the sum of equity and debt. The formula for total capital is:  Total Capital= Equity + Debt
  • 15.
  • 16.  MVE = Current Market Price of Share X No. of shares outstanding  MVE = $50 X 1,000,000 = $50,000,000  Next, calculate the total capital:  Total Capital =Equity + Debt  = $30,000,000 + $20,000,000  = $50,000,000
  • 17.  MVA=Market Value of Equity−Total Capital Invested  MVA = $50,000,000 - $50,000,000 = $0  the Market Value Added is $0, indicating that the market value of equity is equal to the total capital invested. A positive MVA would suggest that the company has added value for its shareholders, while a negative MVA would imply the opposite.
  • 19.  Economic Value Added (EVA) is a financial performance metric that measures the difference between a company's net operating profit after taxes (NOPAT) and the opportunity cost of its capital. EVA is considered a useful tool for financial statement analysis as it provides insight into how well a company is utilizing its capital to generate returns.
  • 20.  The formula for Economic Value Added is:  EVA=NOPAT−(Capital ∗ WACC)  where:  NOPAT (Net Operating Profit After Taxes) is the company's operating profit after taxes.  Capital is the total capital employed by the company.  WACC (Weighted Average Cost of Capital) is the weighted average cost of the company's debt and equity.
  • 21. NOPAT is a company's operating profit adjusted for taxes. It represents the profit generated from a company's core operations.  NOPAT=OperatingIncome×(1−TaxRate)
  • 22.  Capital employed is the total amount of capital used by a company to generate profits. It includes both equity and debt. The formula for capital employed is:  Capital=Equity + Debt − Cash  where Equity is the shareholders' equity, Debt is the total debt, and Cash is the cash and cash equivalents.
  • 23.  WACC represents the average cost of the company's capital, taking into account the cost of both debt and equity. The formula for WACC is:  WACC=(E × Re)+(D × Rd×(1−TaxRate) V V  where  E is the market value of equity,  D is the market value of debt,  V is the total market value of equity and debt,  Re is the cost of equity,  Rd is the cost of debt, and the  Tax rate is the corporate tax rate.
  • 24.  Let's say Company ABC has an NOPAT of $5 million, total equity of $20 million, total debt of $10 million, and a cash balance of $2 million. The corporate tax rate is 30%, the cost of equity is 10%, and the cost of debt is 5%.
  • 25.  Ca[pital Employed = Equity + Debt - Cash  Capital Employed = 20M + 10M - 2M =28M  WACC=(E × Re)+(D × Rd×(1−TaxRate) V V = (20M/28M X0.10) + (10M/28M X 0.05 X (1 – 0.30) = (0.071M + 0.018 M) + (0.018M X 0.70) = 0.089 M + 0.0126M =0.1016 M (OR ) 101600 
  • 26.  EVA=NOPAT−(Capital∗WACC), = 5M –(28M *0.1016M) = 5M -2.8448 M = 2.1552 M This will give you the Economic Value Added for Company ABC. A positive EVA indicates that the company is generating returns above the cost of capital, while a negative EVA suggests that the company is not covering its capital costs.
  • 27.  Financial statement analysis involves the examination of a company's financial statements to assess its financial health and performance. Wealth generation and distribution are key aspects of financial statement analysis, and they can be understood through various financial metrics and statements. Here's how wealth generation and distribution are reflected in financial statements:
  • 28.  Wealth Generation:  The income statement, also known as the profit and loss statement, provides information about a company's revenues, expenses, and profits over a specific period. Positive net income indicates wealth generation, as it represents the profit earned by the company.
  • 29.  Wealth Distribution:  Dividends paid to shareholders are a form of wealth distribution. The income statement does not explicitly show dividends, but retained earnings (net income minus dividends) on the statement of changes in equity reflects the portion of wealth retained for business growth rather than distributed to shareholders.
  • 30.  Wealth Generation:  The balance sheet provides a snapshot of a company's assets, liabilities, and equity at a specific point in time. Positive equity, represented by assets exceeding liabilities, indicates wealth generation.  Wealth Distribution:  Dividends paid are also reflected in the balance sheet under the equity section as a reduction in retained earnings.
  • 31.  Wealth Generation:  Positive cash flow from operating activities indicates the generation of cash wealth from the company's core business operations.  Wealth Distribution:  Cash payments for dividends are reported in the financing activities section, reflecting the distribution of wealth to shareholders.
  • 32.  Wealth Generation:  This statement shows changes in equity accounts over a specific period. Net income contributes to wealth generation, increasing equity.  Wealth Distribution:  Dividends paid reduce retained earnings, representing the distribution of wealth to shareholders.
  • 33.  Return on Equity (ROE):  This ratio indicates how effectively a company generates profit from shareholders' equity, providing insights into wealth generation.  Dividend Payout Ratio:  This ratio measures the proportion of earnings paid out as dividends, indicating the extent of wealth distribution.
  • 34.  Financial statement analysis allows stakeholders to assess a company's ability to generate wealth through profitability and efficient use of resources. It also helps in understanding how the company distributes wealth, whether through dividends or retained earnings for future growth. By analyzing various financial metrics and statements, investors and analysts can gain insights into a company's overall financial performance and health.