SlideShare a Scribd company logo
1 of 50
An introduction to systems thinking:
concepts and simple models (part 1)
Better lives through livestock
O
K
A
PiS
Training course on Systems Thinking and Spatial Group Model Building
Materials prepared and presented by Karl M. Rich and Kanar Dizyee
Foresight Modeling & Policy Team, Policies, Institutions, and Livelihoods
International Livestock Research Institute (ILRI), Dakar, Senegal
Version May 2020 (draft)
2
What this course is and is not
It is an introduction to systems thinking concepts and approaches
It is a course that will provide you skills and exposure to the development of
systems models with stakeholders, and applied in various fields
It is not a modeling course per se – this course will not give expertise on
building quantitative system dynamics models but will give insights on such
approaches (and a teaser on how to do it)
Specific training on system dynamics modeling can accompany this course
Delivered through either traditional classroom or online means (!!)
3
What’s in it for me?
1. Develop an understanding of systems thinking and
how to put causal relationships together qualitatively
using system dynamics language
2. Gain facility in the use of participatory GIS and
facilitation tools to develop system model structure
with stakeholders (including online tools)
3. Tools and methods to organize and administer a group
model building session
4
Online facilitation
For online delivery, our course will entail the use of a suite of
excellent online and web-based tools:
• Microsoft Teams: main platform for verbal communication
and visualization of web pages in one place
• Google Jamboard: a web-based platform for real-time
collaboration/brainstorming
• Vecta.io: an online editor for collaborative graphics editing
(and with a useful layers feature!)
• InsightMaker: a web-based system dynamics software
package for initial concept models
• Stella Architect: our workhorse SD modeling software, with
ability to host models and interfaces online.
5
Who we are
O
K
A
PiS
6
Outline
Motivation
Principles of systems thinking/system dynamics
Stocks, flows, feedbacks, delays, causal loop diagrams
Practice with CLDs
Putting a simple SD model together – product
adoption
7
Overview
Agricultural value chains present a number of
challenges in their analysis
• Complexity
• Data collection (primary and secondary data)
• Dynamics and evolution over time
• Impact assessment (qualitative vs.
quantitative)
• Engagement with policy processes
• Resolution of analysis
Over-reliance on qualitative, descriptive methods
8
Overview
Systems approaches hold promise as a
means to overcome some of these
challenges.
System dynamics (SD) – a platform for
modelling and simulating agricultural value
chains (Rich et al. 2011)
Provides a way to visualize/understand a
host of prospective outcomes to inform
development interventions and investment
options Picture credit: Jared Berends 2019 (Palaw, Myanmar) Source: Dizyee et al. (2017)
9
What is system dynamics?
System dynamics is a computer-aided approach
to policy analysis and design. It applies to
dynamic problems arising in complex social,
managerial, economic, or ecological systems —
literally any dynamic systems characterized by
interdependence, mutual interaction, information
feedback, and circular causality. (System
Dynamics Society)
A methodology for studying complex dynamic
systems that include nonlinearities, delays, and
feedback loops.
Source:
https://commons.wikimedia.org/wiki/File:Feedback_Loops_in_a_System_Dynamics_
Model.jpg#/media/File:Feedback_Loops_in_a_System_Dynamics_Model.jpg; Public
Domain
10
Origins
Founded by Jay W. Forrester of MIT in 1950s
Industrial Dynamics (Forrester 1961)
Urban Dynamics (Forrester 1969)
World Dynamics (Forrester 1971)
Graphical Simulators: Dynamo, iThink, Powersim, Vensim, etc. (1985 –
later)
System dynamics is currently applied in economics, public policy,
environmental studies, defense, commodity cycles, management, etc.
11
Concepts
Stocks (accumulation)
Flows (change overtime – rate/time unit)
Feedback loops (circular causality)
Delays
12
Building blocks: stocks
A stock symbolizes anything that accumulates (builds
stock) or drains (loses stock) over time.
At time t, the value of any given stock will be what has
entered the stock minus anything that has left it.
Example: drinking a glass of water
Represented in system dynamics as a “box” shape
Water in glass
13
Building blocks: flows
This leads us directly to our second
building block, flows.
A flow is the rate of change in a stock.
In the previous example, we would
have two flows: water entering the
glass and water leaving it.
Water in glass
Water enteringglass Water leavingglass
14
Building blocks: converters
Flows cannot change by themselves – there are various
factors that influence these rates
In system dynamics, we define converters (or parameters)
to define variable that take an input and translate them
into a relationship to calibrate flows and other variables
These converters can be numbers, equations, or defined
by tables or graphs
What kinds of parameters might be defined in our water
example?
Water in glass
Water enteringglass
Converter
15
Building blocks: converters
Water in glass
Water enteringglass Water leavingglass
Angle holdingglass
S
peed of drinking
S
peed of pouring
16
Feedback
Feedback is “the process wherein one component of the
model initiates changes in other components, and those
modifications lead to further changes in the component that
set the process in motion” (McGarvey and Hannon 2004: 6).
More simply, feedback determines the dynamic process of a
system and how things evolve over time.
Feedback can be positive or negative.
Positive feedback is self-reinforcing (R). It amplifies what
happens in the system. Negative feedback is self-correcting (B).
It counteracts and opposes change the system. (examples
coming!)
17
Causal loop diagrams
Causal loop diagrams (CLDs) are a qualitative way of
developing intuition about complex systems
They highlight cause and effects relationships within
systems and help us visualize feedback effects
Provide insights on leverage points that could improve
desired system behavior
Combinations of these loops specify specific behavior of a
system over time.
18
Causal loop diagrams
Links in a CLD can go in only one of two
directions
They can move in the same direction
(denoted by “s” or +)
They can move in opposite directions
(denoted by “o” or -)
Sales Profits
s
Incidence of
disease
o
Vaccination
”More sales leads to more profits”
”More vaccination leads to less incidence of disease”
19
Online facilitation of CLD development
We can easily facilitate the collaborative
development of CLDs in real-time online via
Jamboard (http://jamboard.google.com).
Once a Google Jamboard link is set up, those
with the link address can anonymously
contribute to its development.
Sticky notes can be used for each node of the
CLD. Arrows (and polarity, + or -) can be drawn
with the freehand writing icon.
Icon for freehand writing (icon below is to erase)
Icon for sticky notes
20
Feedback loops
A reinforcing loop can have
only “s” links or an even
number of “o” links
Funds for
investment
Customers
Sales revenue
Profits
Source: Sherwood (2002)
s
s
s
s
21
Feedback loops
A reinforcing loop can have
only “s” links or an even
number of “o” links
The even number of “o”
links “cancel” out (like a
double negative).
Source: Sherwood (2002)
Strain on
management
Workload
Coping ability
Incidence of errors
o
s
o
s
22
Reinforcing loops – system behavior
Time
System
state
Time
System
state
OR
System
state
Time
Question: how might this system behavior happen?
21
Reinforcing loops – system behavior
Time
System
state
Time
System
state
System
state
Time
23
Reinforcing loops – system behavior
Funds for
investment
Customers
Sales revenue
Profits
Source: Sherwood (2002)
s
s
s
s
24
Funds for
investment
Customers
Sales revenue
Profits
Source: Sherwood (2002)
s
o
s
s
External shock
s
External shock
o
External shock
o
External shock o
What external shocks
might we consider?
Reinforcing loops - dangles
25
Reinforcing loops – dangles
These external influences on
the system as in the previous
slide are called dangles.
They can either provide input
into the system (as in the
diagram) or being a
consequence of system
behavior (output dangles).
Dangles can be purely
externally driven (a shock) or
can be a policy choice of
decision maker – a lever for
decision making.
Funds for
investment
Customers
Sales revenue
Profits
Source: Sherwood (2002)
s
o
s
s
External shock
s
External shock
o
External shock
o
Returns to investors
s
26
Balancing loops
Balancing loops, by
contrast, counteract
and resist change.
In a balancing loop,
the system converges
on a goal or target.
Example: pouring a
cup of coffee
Source: Sherwood (2002)
Actual level of coffee
in the cup
Gap between target
and actual levels
Physical action
Source: Sherwood (2002)
s
s
o
s
Target level
of coffee
Gap = TARGET-ACTUAL
27
Balancing loops – system behavior
Time
Time
System
state
28
Delays
Delays are “the process whose
output lags behind input.”
In any system, it takes time to
measure, evaluate, and report
information.
It takes time for decisions to affect
the state of the system.
Question – what happens if there’s
a delay in the system?
Time
System
state
29
Delays - example
Actual temperature
Gap between target
and actual temperature
Adjusting the tap
Source: Sherwood (2002)
s
s
o
s
Target
temperature
//
Indicates a delay
30
Impacts of feedback loops
Real-life systems: a combination of positive and
negative feedback loops.
Specific behaviors induced by different
combinations
These behaviors can be gleaned qualitatively
(systems archetypes) and/or more directly
(precisely) through quantitative modeling
We’ll focus on the latter, but I’ll provide a
couple of examples of the former in a moment
Source:
https://en.wikipedia.org/wiki/System_archetype#/media/
File:SD_Archetypes.png, CC-BY-SA 4.0
31
Limits to growth
Feedback Structure: Switching of the
dominance of reinforcing and balancing
feedback loops.
Causes S-shaped growth
Strategies:
• Figure out ways to reduce/mitigate causes of
limits to growth
• How balance growth and balancing processes?
Time
System
state
Funds for
investment
Customers
Sales revenue
Profits
s
s
s
s
Market size
Market
share
o
s
s
o
Source: Sherwood (2002)
Funds for
investment
Customers
Sales revenue
Profits
s
s
s
s
Market size
Market
share
o
s
s
o
Regulation
What are
impacts?
Source: Sherwood (2002)
34
Fixes that fail
Application of short term fix create long-
term consequences, requiring more short-
term fixes in the future
Root cause of the problem not addressed.
Strategies:
• Focus on root causes of the problem
• Increase awareness of unintended
consequences
• Focus on long-term, including metrics for
performance
Source: https://commons.wikimedia.org/wiki/File:Fixes_that_fail.PNG, CC-
BY-SA 3.0
https://en.wikipedia.org/wiki/Fixes_that_fail#/media/File:Ftfgraph.png, CC-BY 3.0
35
A's success
A's activity with B
B's success
B's activity with A
+
+
+
+
R1
A's actions to
improve A's
results
B's actions to
improve B's
results
-
+
+
-
B1
B2
A's unintended
obstruction of
B's success
B's unintended
obstruction of
A's success
+
-
+
- R2
Source: Lie et al. (2016), based on Kemeny (1994)
Leverage points:
• Review conditions that were
basis for coordination – were
they appropriate?
• What internal incentives drive
external system behavior?
• Directly demostrate effects of
each other’s behavior’s
(simulation)
• Develop broader goals and
metrics that align behavior
• Communication strategies
Accidental adversaries
36
Accidental adversaries
Source: Lie et al. (2016)
+
Cooperative strength
relative to smallholders'
strength
Cooperative influence
over smallholders
Degree of
smallholders'
autonomy
Smallholders'
non-cooperative
activities
Smallholders'
asset base
-
+
-
+
-
+
+
Dairy strength relative
to cooperative strength
Dairy influence
over cooperative
Degree of
cooperative
autonomy
Ability to achieve
non-partnership
cooperative-specific
objectives
Health of the
cooperative
+
-
+
+
-
+
-
Leverage points
e.g. Level of trust
-
-
Market strength relative
to processor strength
Market influence
over processor
Degree of
processor
autonomy
Ability to achieve
processor and partnership
obligations
Health of the
processor
+
+
-
-
+
+
+
Individual
smallholders'
success
+
Cooperative
success
+
-
+
R
R
R
R
R
R
B
B
B
37
Causal loop diagrams – some pointers (1)
Know your boundaries – try to stay relevant!
Start somewhere interesting: ask “What are the key
external drivers?/What are the key results?
What are the key items related to the problem wanted to
be solved?”
Ask “What does this drive/cause?” and “What is this driven
by?”
Don’t get cluttered
Use nouns not verbs
Don’t use words like “increase in” or “decrease in”
Source:
https://en.wikipedia.org/wiki/System_archetype#/media/File:Tragedy_of_the_com
mons.PNG, CC-SA-BY 3.0
38
Causal loop diagrams – some pointers (2)
Don’t be afraid of unusual terms
Define s and o (or + and -) as you go
Keep going!!
Ensure reality in your diagram by users
Don’t fall in love with your diagrams – they can
(will) change!
Note that no diagram is ever finished!
Picture credit: K.M. Rich 2019 (Hanoi, Vietnam)
39
Recap
The utility of systems thinking – what it is, why it matters
The language of systems thinking: stocks, flows, converters,
feedback loops.
The roles of feedback loops and CLDs in revealing patterns of
dynamic behavior.
Source:
https://commons.wikimedia.org/wiki/File:Augustus_Edwin_Mulready_A_London_
Newsboy.jpg; public domain
40
Exercises (offline or online)
In plenary:
Competition for resources (ch. 5 of
Sherwood)
In small groups:
Group applications based on group
interest/background (to be given by
facilitator)
Source: https://commons.wikimedia.org/wiki/File:Man_Lifting_Barbell_Cartoon.svg
CC-BY-SA 4.0"
41
A model of new product adoption
Let’s put our systems thinking knowledge to use to co-
develop a simple model using our new vocabulary.
Main idea: process by which new products or ideas diffuse
in a population (think technology, extension, etc.); see Bass
(1969)
Transitions between two populations:
• Potential adopters, who have not adopted a
technology
• Actual adopters that have
What would influence the adoption decision?
Source: https://commons.wikimedia.org/wiki/File:Bass_diffusion_model.svg,
public domain
42
A model of new product adoption: drivers
• http://www.nzdl.org/gsdlmod?e=d-00000-00---off-0hdl--00-0----
0-10-0---0---0direct-10---4-------0-1l--11-en-50---20-about---00-0-
1-00-0--4----0-0-11-10-0utfZz-8-
00&a=d&cl=CL1.1&d=HASHf4ce87f94c88c31e4a2d70.7.fc
Source:
https://commons.wikimedia.org/wiki/File:Goat_detail,_Bock,_stock_beer_advertising_poster,_1
889_(cropped).jpg, public domain
PEER EFFECTS (OR WORD OF
MOUTH) – what drives this?
ADVERTISING – what drives this?
43
Translating the product adoption model into SD
Let’s put this in a systems thinking framework using STELLA
Architect icons for visualization
Some leading questions:
1) We have two populations (potential adopters and actual
adopters) – how would we represent this in system
dynamics (what would they be: a stock, a flow, or a
converter?)
2) How do we consider the transition of populations i.e.
from potential adopters to actual adopters? Is this a
stock, flow, or converter?
3) How do we represent the drivers of adoption – are they
stocks, flows, or converters?
44
Translating the product adoption model into SD
Actual adopters
Potential adopters
1) Our two populations are stocks (number
of people at a given period in time). In
STELLA, we represent as a rectangle.
2) Moving from potential to actual
adopters is a flow: a change in a stock
over time. Here, it is a biflow to
consider disadoption.
3) Drivers of adoption (advertising, peer
effects) are converters: they contain
data or equations that influence the
rate of change of our flow.
Actual adopters
Potential adopters
Adoption rate
Actual adopters
Potential adopters
Adoption rate
Adoption from peer effects
Adoption from advertising
45
Translating the product adoption model into SD
How do we define “adoption from
advertising”?
This will depend on how good advertising is
and the number of those that have not
adopted.
We define this as a multiplicative relationship,
defining a new converter, “Effectiveness of
advertising” and linking it and the stock
“Potential adopters” to it.
Actual adopters
Potential adopters
Adoption rate
Adoption from peer effects
Adoption from advertising
Effectiveness of advertising
46
Translating the product adoption model into SD
Now, how do we define adoption by
word of mouth?
This will depend on:
• The mixing of adopters and
potential adopters
• The rate of contact between them
(stock, flow, or converter?)
• The percentage of those contacted
that adopt (stock, flow, or
converter)
• The total population in the system
(stock, flow, or converter?)
Actual adopters
Total population
Potential adopters
Adoption rate
Contact rate
Adoption fraction
Adoption from peer effects
Adoption from advertising
Effectiveness of advertising
Change in population
Population growth rate
47
Results and extensions
Let’s show some results from STELLA Architect
based on this model.
What happens if we change the parameters for
contact rate, advertising effectiveness, and
fraction adopted. Why?
Some extensions:
What if products do not last forever? How might
this model changes if consumers have to discard
old products to get new ones?
What about learning or price effects?
What about links to other systems?
Weeks
0
500000
1000000
1.00 25.75 50.50 75.25 100.00
Potential adopters Actual adopters
48
Wrap-up: modeling considerations
Taking a modular approach – consider
interfaces between system phenomena:
biophysical relationships, trade, adoption,
cashflow (credit), social dynamics, etc.
Simplicity vs. modeling “everything”
Role of participatory approaches (means
of bringing diverse stakeholders together)
for data and validation. This is the topic
for the next two sessions!
Animal
disease
dynamics
Animal
production
Market
dynamics
Investment
dynamics
Environmental
impact
biosecurity
Resource
constraints
sales
49
References
Bass, F. M. (1969). A new product growth for model consumer durables. Management Science, 15(5), 215-227.
Lie, H., Brønn, C., & Rich, K.M. (2016). A systems perspective on partnership governance in smallholder
agricultural value chains. Paper presented at the International Agribusiness and Food Management Association
Annual Meetings, Aarhus, Denmark, June 2016.
Sherwood, D. (2002). Seeing the forest for the trees: a manager's guide to applying systems thinking. London,
Nicholas Brealey International.
Wanyoike, F. & Rich, K.M., 2007. Socio-Economic Impacts of the 2007 Rift Valley Fever Outbreak in Kenya: A
Case Study of the North Eastern Province Livestock Marketing Chain. Unpublished report for the USAID project,
“Learning the Lessons of Rift Valley Fever: Improved Detection and Mitigation of Outbreaks,” Nairobi, Kenya:
ILRI.
THANK YOU
Picture credit: K.M. Rich 2019 (Niamey, Niger)

More Related Content

Similar to An introduction to systems thinking: Concepts and simple models (part 1)

201102 Constellation Research's Seven Ss of Supply Chain Management by Jeff A...
201102 Constellation Research's Seven Ss of Supply Chain Management by Jeff A...201102 Constellation Research's Seven Ss of Supply Chain Management by Jeff A...
201102 Constellation Research's Seven Ss of Supply Chain Management by Jeff A...R "Ray" Wang
 
Introduction to System, Simulation and Model
Introduction to System, Simulation and ModelIntroduction to System, Simulation and Model
Introduction to System, Simulation and ModelMd. Hasan Imam Bijoy
 
System Development Life Cycle Essay
System Development Life Cycle EssaySystem Development Life Cycle Essay
System Development Life Cycle EssayPamela Wright
 
Model Based Systems Thinking
Model Based Systems ThinkingModel Based Systems Thinking
Model Based Systems Thinkingsicrcw
 
SE_Lec 05_System Modelling and Context Model
SE_Lec 05_System Modelling and Context ModelSE_Lec 05_System Modelling and Context Model
SE_Lec 05_System Modelling and Context ModelAmr E. Mohamed
 
Problem Solving Methods
Problem Solving MethodsProblem Solving Methods
Problem Solving MethodsMaikel Mardjan
 
Unit 1 introduction
Unit 1 introductionUnit 1 introduction
Unit 1 introductionraksharao
 
2022-10-25 Smidig Meetup - from Silos to System.pdf
2022-10-25 Smidig Meetup - from Silos to System.pdf2022-10-25 Smidig Meetup - from Silos to System.pdf
2022-10-25 Smidig Meetup - from Silos to System.pdfSmidigkonferansen
 
System Development Life Cycle (SDLC)
System Development Life Cycle (SDLC)System Development Life Cycle (SDLC)
System Development Life Cycle (SDLC)Animesh Chaturvedi
 
Introduction to simulation.pdf
Introduction to simulation.pdfIntroduction to simulation.pdf
Introduction to simulation.pdfnadimhossain24
 
SE18_Lec 07_System Modelling and Context Model
SE18_Lec 07_System Modelling and Context ModelSE18_Lec 07_System Modelling and Context Model
SE18_Lec 07_System Modelling and Context ModelAmr E. Mohamed
 
System Development Life Cycle ( Sdlc )
System Development Life Cycle ( Sdlc )System Development Life Cycle ( Sdlc )
System Development Life Cycle ( Sdlc )Jennifer Wright
 
Identifying Key Factors Driving Platform Ecosystem to Collapse
Identifying Key Factors Driving Platform Ecosystem to CollapseIdentifying Key Factors Driving Platform Ecosystem to Collapse
Identifying Key Factors Driving Platform Ecosystem to Collapseijtsrd
 
Van Ael, Monastiridis, Tarquini, Nogueira Systemic Design Toolkit Workshop
Van Ael, Monastiridis, Tarquini, Nogueira  Systemic Design Toolkit WorkshopVan Ael, Monastiridis, Tarquini, Nogueira  Systemic Design Toolkit Workshop
Van Ael, Monastiridis, Tarquini, Nogueira Systemic Design Toolkit WorkshopSystemic Design Association (SDA)
 
lect6 system1 Dynamics.pptx
lect6 system1 Dynamics.pptxlect6 system1 Dynamics.pptx
lect6 system1 Dynamics.pptxBakheitLayli
 

Similar to An introduction to systems thinking: Concepts and simple models (part 1) (20)

201102 Constellation Research's Seven Ss of Supply Chain Management by Jeff A...
201102 Constellation Research's Seven Ss of Supply Chain Management by Jeff A...201102 Constellation Research's Seven Ss of Supply Chain Management by Jeff A...
201102 Constellation Research's Seven Ss of Supply Chain Management by Jeff A...
 
Introduction to System, Simulation and Model
Introduction to System, Simulation and ModelIntroduction to System, Simulation and Model
Introduction to System, Simulation and Model
 
System Development Life Cycle Essay
System Development Life Cycle EssaySystem Development Life Cycle Essay
System Development Life Cycle Essay
 
Model Based Systems Thinking
Model Based Systems ThinkingModel Based Systems Thinking
Model Based Systems Thinking
 
SE_Lec 05_System Modelling and Context Model
SE_Lec 05_System Modelling and Context ModelSE_Lec 05_System Modelling and Context Model
SE_Lec 05_System Modelling and Context Model
 
Problem Solving Methods
Problem Solving MethodsProblem Solving Methods
Problem Solving Methods
 
Unit 1 introduction
Unit 1 introductionUnit 1 introduction
Unit 1 introduction
 
2022-10-25 Smidig Meetup - from Silos to System.pdf
2022-10-25 Smidig Meetup - from Silos to System.pdf2022-10-25 Smidig Meetup - from Silos to System.pdf
2022-10-25 Smidig Meetup - from Silos to System.pdf
 
System Development Life Cycle (SDLC)
System Development Life Cycle (SDLC)System Development Life Cycle (SDLC)
System Development Life Cycle (SDLC)
 
Introduction to simulation.pdf
Introduction to simulation.pdfIntroduction to simulation.pdf
Introduction to simulation.pdf
 
SIMULATION.pdf
SIMULATION.pdfSIMULATION.pdf
SIMULATION.pdf
 
Unit-1 Mod-Sim.ppt
Unit-1 Mod-Sim.pptUnit-1 Mod-Sim.ppt
Unit-1 Mod-Sim.ppt
 
SE18_Lec 07_System Modelling and Context Model
SE18_Lec 07_System Modelling and Context ModelSE18_Lec 07_System Modelling and Context Model
SE18_Lec 07_System Modelling and Context Model
 
System Development Life Cycle ( Sdlc )
System Development Life Cycle ( Sdlc )System Development Life Cycle ( Sdlc )
System Development Life Cycle ( Sdlc )
 
Building an Information System
Building an Information SystemBuilding an Information System
Building an Information System
 
Creativity And Inovation
Creativity And InovationCreativity And Inovation
Creativity And Inovation
 
Identifying Key Factors Driving Platform Ecosystem to Collapse
Identifying Key Factors Driving Platform Ecosystem to CollapseIdentifying Key Factors Driving Platform Ecosystem to Collapse
Identifying Key Factors Driving Platform Ecosystem to Collapse
 
Final
FinalFinal
Final
 
Van Ael, Monastiridis, Tarquini, Nogueira Systemic Design Toolkit Workshop
Van Ael, Monastiridis, Tarquini, Nogueira  Systemic Design Toolkit WorkshopVan Ael, Monastiridis, Tarquini, Nogueira  Systemic Design Toolkit Workshop
Van Ael, Monastiridis, Tarquini, Nogueira Systemic Design Toolkit Workshop
 
lect6 system1 Dynamics.pptx
lect6 system1 Dynamics.pptxlect6 system1 Dynamics.pptx
lect6 system1 Dynamics.pptx
 

More from ILRI

How the small-scale low biosecurity sector could be transformed into a more b...
How the small-scale low biosecurity sector could be transformed into a more b...How the small-scale low biosecurity sector could be transformed into a more b...
How the small-scale low biosecurity sector could be transformed into a more b...ILRI
 
Small ruminant keepers’ knowledge, attitudes and practices towards peste des ...
Small ruminant keepers’ knowledge, attitudes and practices towards peste des ...Small ruminant keepers’ knowledge, attitudes and practices towards peste des ...
Small ruminant keepers’ knowledge, attitudes and practices towards peste des ...ILRI
 
A training, certification and marketing scheme for informal dairy vendors in ...
A training, certification and marketing scheme for informal dairy vendors in ...A training, certification and marketing scheme for informal dairy vendors in ...
A training, certification and marketing scheme for informal dairy vendors in ...ILRI
 
Milk safety and child nutrition impacts of the MoreMilk training, certificati...
Milk safety and child nutrition impacts of the MoreMilk training, certificati...Milk safety and child nutrition impacts of the MoreMilk training, certificati...
Milk safety and child nutrition impacts of the MoreMilk training, certificati...ILRI
 
Preventing the next pandemic: a 12-slide primer on emerging zoonotic diseases
Preventing the next pandemic: a 12-slide primer on emerging zoonotic diseasesPreventing the next pandemic: a 12-slide primer on emerging zoonotic diseases
Preventing the next pandemic: a 12-slide primer on emerging zoonotic diseasesILRI
 
Preventing preventable diseases: a 12-slide primer on foodborne disease
Preventing preventable diseases: a 12-slide primer on foodborne diseasePreventing preventable diseases: a 12-slide primer on foodborne disease
Preventing preventable diseases: a 12-slide primer on foodborne diseaseILRI
 
Preventing a post-antibiotic era: a 12-slide primer on antimicrobial resistance
Preventing a post-antibiotic era: a 12-slide primer on antimicrobial resistancePreventing a post-antibiotic era: a 12-slide primer on antimicrobial resistance
Preventing a post-antibiotic era: a 12-slide primer on antimicrobial resistanceILRI
 
Food safety research in low- and middle-income countries
Food safety research in low- and middle-income countriesFood safety research in low- and middle-income countries
Food safety research in low- and middle-income countriesILRI
 
Food safety research LMIC
Food safety research LMICFood safety research LMIC
Food safety research LMICILRI
 
The application of One Health: Observations from eastern and southern Africa
The application of One Health: Observations from eastern and southern AfricaThe application of One Health: Observations from eastern and southern Africa
The application of One Health: Observations from eastern and southern AfricaILRI
 
One Health in action: Perspectives from 10 years in the field
One Health in action: Perspectives from 10 years in the fieldOne Health in action: Perspectives from 10 years in the field
One Health in action: Perspectives from 10 years in the fieldILRI
 
Reservoirs of pathogenic Leptospira species in Uganda
Reservoirs of pathogenic Leptospira species in UgandaReservoirs of pathogenic Leptospira species in Uganda
Reservoirs of pathogenic Leptospira species in UgandaILRI
 
Minyoo ya mbwa
Minyoo ya mbwaMinyoo ya mbwa
Minyoo ya mbwaILRI
 
Parasites in dogs
Parasites in dogsParasites in dogs
Parasites in dogsILRI
 
Assessing meat microbiological safety and associated handling practices in bu...
Assessing meat microbiological safety and associated handling practices in bu...Assessing meat microbiological safety and associated handling practices in bu...
Assessing meat microbiological safety and associated handling practices in bu...ILRI
 
Ecological factors associated with abundance and distribution of mosquito vec...
Ecological factors associated with abundance and distribution of mosquito vec...Ecological factors associated with abundance and distribution of mosquito vec...
Ecological factors associated with abundance and distribution of mosquito vec...ILRI
 
Livestock in the agrifood systems transformation
Livestock in the agrifood systems transformationLivestock in the agrifood systems transformation
Livestock in the agrifood systems transformationILRI
 
Development of a fluorescent RBL reporter system for diagnosis of porcine cys...
Development of a fluorescent RBL reporter system for diagnosis of porcine cys...Development of a fluorescent RBL reporter system for diagnosis of porcine cys...
Development of a fluorescent RBL reporter system for diagnosis of porcine cys...ILRI
 
Practices and drivers of antibiotic use in Kenyan smallholder dairy farms
Practices and drivers of antibiotic use in Kenyan smallholder dairy farmsPractices and drivers of antibiotic use in Kenyan smallholder dairy farms
Practices and drivers of antibiotic use in Kenyan smallholder dairy farmsILRI
 

More from ILRI (20)

How the small-scale low biosecurity sector could be transformed into a more b...
How the small-scale low biosecurity sector could be transformed into a more b...How the small-scale low biosecurity sector could be transformed into a more b...
How the small-scale low biosecurity sector could be transformed into a more b...
 
Small ruminant keepers’ knowledge, attitudes and practices towards peste des ...
Small ruminant keepers’ knowledge, attitudes and practices towards peste des ...Small ruminant keepers’ knowledge, attitudes and practices towards peste des ...
Small ruminant keepers’ knowledge, attitudes and practices towards peste des ...
 
Small ruminant keepers’ knowledge, attitudes and practices towards peste des ...
Small ruminant keepers’ knowledge, attitudes and practices towards peste des ...Small ruminant keepers’ knowledge, attitudes and practices towards peste des ...
Small ruminant keepers’ knowledge, attitudes and practices towards peste des ...
 
A training, certification and marketing scheme for informal dairy vendors in ...
A training, certification and marketing scheme for informal dairy vendors in ...A training, certification and marketing scheme for informal dairy vendors in ...
A training, certification and marketing scheme for informal dairy vendors in ...
 
Milk safety and child nutrition impacts of the MoreMilk training, certificati...
Milk safety and child nutrition impacts of the MoreMilk training, certificati...Milk safety and child nutrition impacts of the MoreMilk training, certificati...
Milk safety and child nutrition impacts of the MoreMilk training, certificati...
 
Preventing the next pandemic: a 12-slide primer on emerging zoonotic diseases
Preventing the next pandemic: a 12-slide primer on emerging zoonotic diseasesPreventing the next pandemic: a 12-slide primer on emerging zoonotic diseases
Preventing the next pandemic: a 12-slide primer on emerging zoonotic diseases
 
Preventing preventable diseases: a 12-slide primer on foodborne disease
Preventing preventable diseases: a 12-slide primer on foodborne diseasePreventing preventable diseases: a 12-slide primer on foodborne disease
Preventing preventable diseases: a 12-slide primer on foodborne disease
 
Preventing a post-antibiotic era: a 12-slide primer on antimicrobial resistance
Preventing a post-antibiotic era: a 12-slide primer on antimicrobial resistancePreventing a post-antibiotic era: a 12-slide primer on antimicrobial resistance
Preventing a post-antibiotic era: a 12-slide primer on antimicrobial resistance
 
Food safety research in low- and middle-income countries
Food safety research in low- and middle-income countriesFood safety research in low- and middle-income countries
Food safety research in low- and middle-income countries
 
Food safety research LMIC
Food safety research LMICFood safety research LMIC
Food safety research LMIC
 
The application of One Health: Observations from eastern and southern Africa
The application of One Health: Observations from eastern and southern AfricaThe application of One Health: Observations from eastern and southern Africa
The application of One Health: Observations from eastern and southern Africa
 
One Health in action: Perspectives from 10 years in the field
One Health in action: Perspectives from 10 years in the fieldOne Health in action: Perspectives from 10 years in the field
One Health in action: Perspectives from 10 years in the field
 
Reservoirs of pathogenic Leptospira species in Uganda
Reservoirs of pathogenic Leptospira species in UgandaReservoirs of pathogenic Leptospira species in Uganda
Reservoirs of pathogenic Leptospira species in Uganda
 
Minyoo ya mbwa
Minyoo ya mbwaMinyoo ya mbwa
Minyoo ya mbwa
 
Parasites in dogs
Parasites in dogsParasites in dogs
Parasites in dogs
 
Assessing meat microbiological safety and associated handling practices in bu...
Assessing meat microbiological safety and associated handling practices in bu...Assessing meat microbiological safety and associated handling practices in bu...
Assessing meat microbiological safety and associated handling practices in bu...
 
Ecological factors associated with abundance and distribution of mosquito vec...
Ecological factors associated with abundance and distribution of mosquito vec...Ecological factors associated with abundance and distribution of mosquito vec...
Ecological factors associated with abundance and distribution of mosquito vec...
 
Livestock in the agrifood systems transformation
Livestock in the agrifood systems transformationLivestock in the agrifood systems transformation
Livestock in the agrifood systems transformation
 
Development of a fluorescent RBL reporter system for diagnosis of porcine cys...
Development of a fluorescent RBL reporter system for diagnosis of porcine cys...Development of a fluorescent RBL reporter system for diagnosis of porcine cys...
Development of a fluorescent RBL reporter system for diagnosis of porcine cys...
 
Practices and drivers of antibiotic use in Kenyan smallholder dairy farms
Practices and drivers of antibiotic use in Kenyan smallholder dairy farmsPractices and drivers of antibiotic use in Kenyan smallholder dairy farms
Practices and drivers of antibiotic use in Kenyan smallholder dairy farms
 

Recently uploaded

Unlocking the Potential: Deep dive into ocean of Ceramic Magnets.pptx
Unlocking  the Potential: Deep dive into ocean of Ceramic Magnets.pptxUnlocking  the Potential: Deep dive into ocean of Ceramic Magnets.pptx
Unlocking the Potential: Deep dive into ocean of Ceramic Magnets.pptxanandsmhk
 
Recombinant DNA technology (Immunological screening)
Recombinant DNA technology (Immunological screening)Recombinant DNA technology (Immunological screening)
Recombinant DNA technology (Immunological screening)PraveenaKalaiselvan1
 
A relative description on Sonoporation.pdf
A relative description on Sonoporation.pdfA relative description on Sonoporation.pdf
A relative description on Sonoporation.pdfnehabiju2046
 
SOLUBLE PATTERN RECOGNITION RECEPTORS.pptx
SOLUBLE PATTERN RECOGNITION RECEPTORS.pptxSOLUBLE PATTERN RECOGNITION RECEPTORS.pptx
SOLUBLE PATTERN RECOGNITION RECEPTORS.pptxkessiyaTpeter
 
Botany 4th semester file By Sumit Kumar yadav.pdf
Botany 4th semester file By Sumit Kumar yadav.pdfBotany 4th semester file By Sumit Kumar yadav.pdf
Botany 4th semester file By Sumit Kumar yadav.pdfSumit Kumar yadav
 
GFP in rDNA Technology (Biotechnology).pptx
GFP in rDNA Technology (Biotechnology).pptxGFP in rDNA Technology (Biotechnology).pptx
GFP in rDNA Technology (Biotechnology).pptxAleenaTreesaSaji
 
Grafana in space: Monitoring Japan's SLIM moon lander in real time
Grafana in space: Monitoring Japan's SLIM moon lander  in real timeGrafana in space: Monitoring Japan's SLIM moon lander  in real time
Grafana in space: Monitoring Japan's SLIM moon lander in real timeSatoshi NAKAHIRA
 
Work, Energy and Power for class 10 ICSE Physics
Work, Energy and Power for class 10 ICSE PhysicsWork, Energy and Power for class 10 ICSE Physics
Work, Energy and Power for class 10 ICSE Physicsvishikhakeshava1
 
PossibleEoarcheanRecordsoftheGeomagneticFieldPreservedintheIsuaSupracrustalBe...
PossibleEoarcheanRecordsoftheGeomagneticFieldPreservedintheIsuaSupracrustalBe...PossibleEoarcheanRecordsoftheGeomagneticFieldPreservedintheIsuaSupracrustalBe...
PossibleEoarcheanRecordsoftheGeomagneticFieldPreservedintheIsuaSupracrustalBe...Sérgio Sacani
 
Caco-2 cell permeability assay for drug absorption
Caco-2 cell permeability assay for drug absorptionCaco-2 cell permeability assay for drug absorption
Caco-2 cell permeability assay for drug absorptionPriyansha Singh
 
Orientation, design and principles of polyhouse
Orientation, design and principles of polyhouseOrientation, design and principles of polyhouse
Orientation, design and principles of polyhousejana861314
 
STERILITY TESTING OF PHARMACEUTICALS ppt by DR.C.P.PRINCE
STERILITY TESTING OF PHARMACEUTICALS ppt by DR.C.P.PRINCESTERILITY TESTING OF PHARMACEUTICALS ppt by DR.C.P.PRINCE
STERILITY TESTING OF PHARMACEUTICALS ppt by DR.C.P.PRINCEPRINCE C P
 
Call Us ≽ 9953322196 ≼ Call Girls In Mukherjee Nagar(Delhi) |
Call Us ≽ 9953322196 ≼ Call Girls In Mukherjee Nagar(Delhi) |Call Us ≽ 9953322196 ≼ Call Girls In Mukherjee Nagar(Delhi) |
Call Us ≽ 9953322196 ≼ Call Girls In Mukherjee Nagar(Delhi) |aasikanpl
 
Call Girls in Munirka Delhi 💯Call Us 🔝9953322196🔝 💯Escort.
Call Girls in Munirka Delhi 💯Call Us 🔝9953322196🔝 💯Escort.Call Girls in Munirka Delhi 💯Call Us 🔝9953322196🔝 💯Escort.
Call Girls in Munirka Delhi 💯Call Us 🔝9953322196🔝 💯Escort.aasikanpl
 
Analytical Profile of Coleus Forskohlii | Forskolin .pdf
Analytical Profile of Coleus Forskohlii | Forskolin .pdfAnalytical Profile of Coleus Forskohlii | Forskolin .pdf
Analytical Profile of Coleus Forskohlii | Forskolin .pdfSwapnil Therkar
 
Nanoparticles synthesis and characterization​ ​
Nanoparticles synthesis and characterization​  ​Nanoparticles synthesis and characterization​  ​
Nanoparticles synthesis and characterization​ ​kaibalyasahoo82800
 
Artificial Intelligence In Microbiology by Dr. Prince C P
Artificial Intelligence In Microbiology by Dr. Prince C PArtificial Intelligence In Microbiology by Dr. Prince C P
Artificial Intelligence In Microbiology by Dr. Prince C PPRINCE C P
 

Recently uploaded (20)

Unlocking the Potential: Deep dive into ocean of Ceramic Magnets.pptx
Unlocking  the Potential: Deep dive into ocean of Ceramic Magnets.pptxUnlocking  the Potential: Deep dive into ocean of Ceramic Magnets.pptx
Unlocking the Potential: Deep dive into ocean of Ceramic Magnets.pptx
 
Recombinant DNA technology (Immunological screening)
Recombinant DNA technology (Immunological screening)Recombinant DNA technology (Immunological screening)
Recombinant DNA technology (Immunological screening)
 
A relative description on Sonoporation.pdf
A relative description on Sonoporation.pdfA relative description on Sonoporation.pdf
A relative description on Sonoporation.pdf
 
SOLUBLE PATTERN RECOGNITION RECEPTORS.pptx
SOLUBLE PATTERN RECOGNITION RECEPTORS.pptxSOLUBLE PATTERN RECOGNITION RECEPTORS.pptx
SOLUBLE PATTERN RECOGNITION RECEPTORS.pptx
 
Botany 4th semester file By Sumit Kumar yadav.pdf
Botany 4th semester file By Sumit Kumar yadav.pdfBotany 4th semester file By Sumit Kumar yadav.pdf
Botany 4th semester file By Sumit Kumar yadav.pdf
 
GFP in rDNA Technology (Biotechnology).pptx
GFP in rDNA Technology (Biotechnology).pptxGFP in rDNA Technology (Biotechnology).pptx
GFP in rDNA Technology (Biotechnology).pptx
 
Grafana in space: Monitoring Japan's SLIM moon lander in real time
Grafana in space: Monitoring Japan's SLIM moon lander  in real timeGrafana in space: Monitoring Japan's SLIM moon lander  in real time
Grafana in space: Monitoring Japan's SLIM moon lander in real time
 
CELL -Structural and Functional unit of life.pdf
CELL -Structural and Functional unit of life.pdfCELL -Structural and Functional unit of life.pdf
CELL -Structural and Functional unit of life.pdf
 
The Philosophy of Science
The Philosophy of ScienceThe Philosophy of Science
The Philosophy of Science
 
Work, Energy and Power for class 10 ICSE Physics
Work, Energy and Power for class 10 ICSE PhysicsWork, Energy and Power for class 10 ICSE Physics
Work, Energy and Power for class 10 ICSE Physics
 
PossibleEoarcheanRecordsoftheGeomagneticFieldPreservedintheIsuaSupracrustalBe...
PossibleEoarcheanRecordsoftheGeomagneticFieldPreservedintheIsuaSupracrustalBe...PossibleEoarcheanRecordsoftheGeomagneticFieldPreservedintheIsuaSupracrustalBe...
PossibleEoarcheanRecordsoftheGeomagneticFieldPreservedintheIsuaSupracrustalBe...
 
Caco-2 cell permeability assay for drug absorption
Caco-2 cell permeability assay for drug absorptionCaco-2 cell permeability assay for drug absorption
Caco-2 cell permeability assay for drug absorption
 
Orientation, design and principles of polyhouse
Orientation, design and principles of polyhouseOrientation, design and principles of polyhouse
Orientation, design and principles of polyhouse
 
STERILITY TESTING OF PHARMACEUTICALS ppt by DR.C.P.PRINCE
STERILITY TESTING OF PHARMACEUTICALS ppt by DR.C.P.PRINCESTERILITY TESTING OF PHARMACEUTICALS ppt by DR.C.P.PRINCE
STERILITY TESTING OF PHARMACEUTICALS ppt by DR.C.P.PRINCE
 
Engler and Prantl system of classification in plant taxonomy
Engler and Prantl system of classification in plant taxonomyEngler and Prantl system of classification in plant taxonomy
Engler and Prantl system of classification in plant taxonomy
 
Call Us ≽ 9953322196 ≼ Call Girls In Mukherjee Nagar(Delhi) |
Call Us ≽ 9953322196 ≼ Call Girls In Mukherjee Nagar(Delhi) |Call Us ≽ 9953322196 ≼ Call Girls In Mukherjee Nagar(Delhi) |
Call Us ≽ 9953322196 ≼ Call Girls In Mukherjee Nagar(Delhi) |
 
Call Girls in Munirka Delhi 💯Call Us 🔝9953322196🔝 💯Escort.
Call Girls in Munirka Delhi 💯Call Us 🔝9953322196🔝 💯Escort.Call Girls in Munirka Delhi 💯Call Us 🔝9953322196🔝 💯Escort.
Call Girls in Munirka Delhi 💯Call Us 🔝9953322196🔝 💯Escort.
 
Analytical Profile of Coleus Forskohlii | Forskolin .pdf
Analytical Profile of Coleus Forskohlii | Forskolin .pdfAnalytical Profile of Coleus Forskohlii | Forskolin .pdf
Analytical Profile of Coleus Forskohlii | Forskolin .pdf
 
Nanoparticles synthesis and characterization​ ​
Nanoparticles synthesis and characterization​  ​Nanoparticles synthesis and characterization​  ​
Nanoparticles synthesis and characterization​ ​
 
Artificial Intelligence In Microbiology by Dr. Prince C P
Artificial Intelligence In Microbiology by Dr. Prince C PArtificial Intelligence In Microbiology by Dr. Prince C P
Artificial Intelligence In Microbiology by Dr. Prince C P
 

An introduction to systems thinking: Concepts and simple models (part 1)

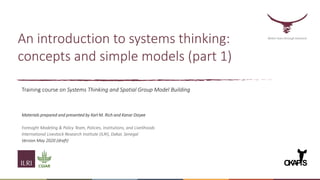
  • 1. An introduction to systems thinking: concepts and simple models (part 1) Better lives through livestock O K A PiS Training course on Systems Thinking and Spatial Group Model Building Materials prepared and presented by Karl M. Rich and Kanar Dizyee Foresight Modeling & Policy Team, Policies, Institutions, and Livelihoods International Livestock Research Institute (ILRI), Dakar, Senegal Version May 2020 (draft)
  • 2. 2 What this course is and is not It is an introduction to systems thinking concepts and approaches It is a course that will provide you skills and exposure to the development of systems models with stakeholders, and applied in various fields It is not a modeling course per se – this course will not give expertise on building quantitative system dynamics models but will give insights on such approaches (and a teaser on how to do it) Specific training on system dynamics modeling can accompany this course Delivered through either traditional classroom or online means (!!)
  • 3. 3 What’s in it for me? 1. Develop an understanding of systems thinking and how to put causal relationships together qualitatively using system dynamics language 2. Gain facility in the use of participatory GIS and facilitation tools to develop system model structure with stakeholders (including online tools) 3. Tools and methods to organize and administer a group model building session
  • 4. 4 Online facilitation For online delivery, our course will entail the use of a suite of excellent online and web-based tools: • Microsoft Teams: main platform for verbal communication and visualization of web pages in one place • Google Jamboard: a web-based platform for real-time collaboration/brainstorming • Vecta.io: an online editor for collaborative graphics editing (and with a useful layers feature!) • InsightMaker: a web-based system dynamics software package for initial concept models • Stella Architect: our workhorse SD modeling software, with ability to host models and interfaces online.
  • 6. 6 Outline Motivation Principles of systems thinking/system dynamics Stocks, flows, feedbacks, delays, causal loop diagrams Practice with CLDs Putting a simple SD model together – product adoption
  • 7. 7 Overview Agricultural value chains present a number of challenges in their analysis • Complexity • Data collection (primary and secondary data) • Dynamics and evolution over time • Impact assessment (qualitative vs. quantitative) • Engagement with policy processes • Resolution of analysis Over-reliance on qualitative, descriptive methods
  • 8. 8 Overview Systems approaches hold promise as a means to overcome some of these challenges. System dynamics (SD) – a platform for modelling and simulating agricultural value chains (Rich et al. 2011) Provides a way to visualize/understand a host of prospective outcomes to inform development interventions and investment options Picture credit: Jared Berends 2019 (Palaw, Myanmar) Source: Dizyee et al. (2017)
  • 9. 9 What is system dynamics? System dynamics is a computer-aided approach to policy analysis and design. It applies to dynamic problems arising in complex social, managerial, economic, or ecological systems — literally any dynamic systems characterized by interdependence, mutual interaction, information feedback, and circular causality. (System Dynamics Society) A methodology for studying complex dynamic systems that include nonlinearities, delays, and feedback loops. Source: https://commons.wikimedia.org/wiki/File:Feedback_Loops_in_a_System_Dynamics_ Model.jpg#/media/File:Feedback_Loops_in_a_System_Dynamics_Model.jpg; Public Domain
  • 10. 10 Origins Founded by Jay W. Forrester of MIT in 1950s Industrial Dynamics (Forrester 1961) Urban Dynamics (Forrester 1969) World Dynamics (Forrester 1971) Graphical Simulators: Dynamo, iThink, Powersim, Vensim, etc. (1985 – later) System dynamics is currently applied in economics, public policy, environmental studies, defense, commodity cycles, management, etc.
  • 11. 11 Concepts Stocks (accumulation) Flows (change overtime – rate/time unit) Feedback loops (circular causality) Delays
  • 12. 12 Building blocks: stocks A stock symbolizes anything that accumulates (builds stock) or drains (loses stock) over time. At time t, the value of any given stock will be what has entered the stock minus anything that has left it. Example: drinking a glass of water Represented in system dynamics as a “box” shape Water in glass
  • 13. 13 Building blocks: flows This leads us directly to our second building block, flows. A flow is the rate of change in a stock. In the previous example, we would have two flows: water entering the glass and water leaving it. Water in glass Water enteringglass Water leavingglass
  • 14. 14 Building blocks: converters Flows cannot change by themselves – there are various factors that influence these rates In system dynamics, we define converters (or parameters) to define variable that take an input and translate them into a relationship to calibrate flows and other variables These converters can be numbers, equations, or defined by tables or graphs What kinds of parameters might be defined in our water example? Water in glass Water enteringglass Converter
  • 15. 15 Building blocks: converters Water in glass Water enteringglass Water leavingglass Angle holdingglass S peed of drinking S peed of pouring
  • 16. 16 Feedback Feedback is “the process wherein one component of the model initiates changes in other components, and those modifications lead to further changes in the component that set the process in motion” (McGarvey and Hannon 2004: 6). More simply, feedback determines the dynamic process of a system and how things evolve over time. Feedback can be positive or negative. Positive feedback is self-reinforcing (R). It amplifies what happens in the system. Negative feedback is self-correcting (B). It counteracts and opposes change the system. (examples coming!)
  • 17. 17 Causal loop diagrams Causal loop diagrams (CLDs) are a qualitative way of developing intuition about complex systems They highlight cause and effects relationships within systems and help us visualize feedback effects Provide insights on leverage points that could improve desired system behavior Combinations of these loops specify specific behavior of a system over time.
  • 18. 18 Causal loop diagrams Links in a CLD can go in only one of two directions They can move in the same direction (denoted by “s” or +) They can move in opposite directions (denoted by “o” or -) Sales Profits s Incidence of disease o Vaccination ”More sales leads to more profits” ”More vaccination leads to less incidence of disease”
  • 19. 19 Online facilitation of CLD development We can easily facilitate the collaborative development of CLDs in real-time online via Jamboard (http://jamboard.google.com). Once a Google Jamboard link is set up, those with the link address can anonymously contribute to its development. Sticky notes can be used for each node of the CLD. Arrows (and polarity, + or -) can be drawn with the freehand writing icon. Icon for freehand writing (icon below is to erase) Icon for sticky notes
  • 20. 20 Feedback loops A reinforcing loop can have only “s” links or an even number of “o” links Funds for investment Customers Sales revenue Profits Source: Sherwood (2002) s s s s
  • 21. 21 Feedback loops A reinforcing loop can have only “s” links or an even number of “o” links The even number of “o” links “cancel” out (like a double negative). Source: Sherwood (2002) Strain on management Workload Coping ability Incidence of errors o s o s
  • 22. 22 Reinforcing loops – system behavior Time System state Time System state OR System state Time Question: how might this system behavior happen? 21 Reinforcing loops – system behavior Time System state Time System state System state Time
  • 23. 23 Reinforcing loops – system behavior Funds for investment Customers Sales revenue Profits Source: Sherwood (2002) s s s s
  • 24. 24 Funds for investment Customers Sales revenue Profits Source: Sherwood (2002) s o s s External shock s External shock o External shock o External shock o What external shocks might we consider? Reinforcing loops - dangles
  • 25. 25 Reinforcing loops – dangles These external influences on the system as in the previous slide are called dangles. They can either provide input into the system (as in the diagram) or being a consequence of system behavior (output dangles). Dangles can be purely externally driven (a shock) or can be a policy choice of decision maker – a lever for decision making. Funds for investment Customers Sales revenue Profits Source: Sherwood (2002) s o s s External shock s External shock o External shock o Returns to investors s
  • 26. 26 Balancing loops Balancing loops, by contrast, counteract and resist change. In a balancing loop, the system converges on a goal or target. Example: pouring a cup of coffee Source: Sherwood (2002) Actual level of coffee in the cup Gap between target and actual levels Physical action Source: Sherwood (2002) s s o s Target level of coffee Gap = TARGET-ACTUAL
  • 27. 27 Balancing loops – system behavior Time Time System state
  • 28. 28 Delays Delays are “the process whose output lags behind input.” In any system, it takes time to measure, evaluate, and report information. It takes time for decisions to affect the state of the system. Question – what happens if there’s a delay in the system? Time System state
  • 29. 29 Delays - example Actual temperature Gap between target and actual temperature Adjusting the tap Source: Sherwood (2002) s s o s Target temperature // Indicates a delay
  • 30. 30 Impacts of feedback loops Real-life systems: a combination of positive and negative feedback loops. Specific behaviors induced by different combinations These behaviors can be gleaned qualitatively (systems archetypes) and/or more directly (precisely) through quantitative modeling We’ll focus on the latter, but I’ll provide a couple of examples of the former in a moment Source: https://en.wikipedia.org/wiki/System_archetype#/media/ File:SD_Archetypes.png, CC-BY-SA 4.0
  • 31. 31 Limits to growth Feedback Structure: Switching of the dominance of reinforcing and balancing feedback loops. Causes S-shaped growth Strategies: • Figure out ways to reduce/mitigate causes of limits to growth • How balance growth and balancing processes? Time System state
  • 32. Funds for investment Customers Sales revenue Profits s s s s Market size Market share o s s o Source: Sherwood (2002)
  • 33. Funds for investment Customers Sales revenue Profits s s s s Market size Market share o s s o Regulation What are impacts? Source: Sherwood (2002)
  • 34. 34 Fixes that fail Application of short term fix create long- term consequences, requiring more short- term fixes in the future Root cause of the problem not addressed. Strategies: • Focus on root causes of the problem • Increase awareness of unintended consequences • Focus on long-term, including metrics for performance Source: https://commons.wikimedia.org/wiki/File:Fixes_that_fail.PNG, CC- BY-SA 3.0 https://en.wikipedia.org/wiki/Fixes_that_fail#/media/File:Ftfgraph.png, CC-BY 3.0
  • 35. 35 A's success A's activity with B B's success B's activity with A + + + + R1 A's actions to improve A's results B's actions to improve B's results - + + - B1 B2 A's unintended obstruction of B's success B's unintended obstruction of A's success + - + - R2 Source: Lie et al. (2016), based on Kemeny (1994) Leverage points: • Review conditions that were basis for coordination – were they appropriate? • What internal incentives drive external system behavior? • Directly demostrate effects of each other’s behavior’s (simulation) • Develop broader goals and metrics that align behavior • Communication strategies Accidental adversaries
  • 36. 36 Accidental adversaries Source: Lie et al. (2016) + Cooperative strength relative to smallholders' strength Cooperative influence over smallholders Degree of smallholders' autonomy Smallholders' non-cooperative activities Smallholders' asset base - + - + - + + Dairy strength relative to cooperative strength Dairy influence over cooperative Degree of cooperative autonomy Ability to achieve non-partnership cooperative-specific objectives Health of the cooperative + - + + - + - Leverage points e.g. Level of trust - - Market strength relative to processor strength Market influence over processor Degree of processor autonomy Ability to achieve processor and partnership obligations Health of the processor + + - - + + + Individual smallholders' success + Cooperative success + - + R R R R R R B B B
  • 37. 37 Causal loop diagrams – some pointers (1) Know your boundaries – try to stay relevant! Start somewhere interesting: ask “What are the key external drivers?/What are the key results? What are the key items related to the problem wanted to be solved?” Ask “What does this drive/cause?” and “What is this driven by?” Don’t get cluttered Use nouns not verbs Don’t use words like “increase in” or “decrease in” Source: https://en.wikipedia.org/wiki/System_archetype#/media/File:Tragedy_of_the_com mons.PNG, CC-SA-BY 3.0
  • 38. 38 Causal loop diagrams – some pointers (2) Don’t be afraid of unusual terms Define s and o (or + and -) as you go Keep going!! Ensure reality in your diagram by users Don’t fall in love with your diagrams – they can (will) change! Note that no diagram is ever finished! Picture credit: K.M. Rich 2019 (Hanoi, Vietnam)
  • 39. 39 Recap The utility of systems thinking – what it is, why it matters The language of systems thinking: stocks, flows, converters, feedback loops. The roles of feedback loops and CLDs in revealing patterns of dynamic behavior. Source: https://commons.wikimedia.org/wiki/File:Augustus_Edwin_Mulready_A_London_ Newsboy.jpg; public domain
  • 40. 40 Exercises (offline or online) In plenary: Competition for resources (ch. 5 of Sherwood) In small groups: Group applications based on group interest/background (to be given by facilitator) Source: https://commons.wikimedia.org/wiki/File:Man_Lifting_Barbell_Cartoon.svg CC-BY-SA 4.0"
  • 41. 41 A model of new product adoption Let’s put our systems thinking knowledge to use to co- develop a simple model using our new vocabulary. Main idea: process by which new products or ideas diffuse in a population (think technology, extension, etc.); see Bass (1969) Transitions between two populations: • Potential adopters, who have not adopted a technology • Actual adopters that have What would influence the adoption decision? Source: https://commons.wikimedia.org/wiki/File:Bass_diffusion_model.svg, public domain
  • 42. 42 A model of new product adoption: drivers • http://www.nzdl.org/gsdlmod?e=d-00000-00---off-0hdl--00-0---- 0-10-0---0---0direct-10---4-------0-1l--11-en-50---20-about---00-0- 1-00-0--4----0-0-11-10-0utfZz-8- 00&a=d&cl=CL1.1&d=HASHf4ce87f94c88c31e4a2d70.7.fc Source: https://commons.wikimedia.org/wiki/File:Goat_detail,_Bock,_stock_beer_advertising_poster,_1 889_(cropped).jpg, public domain PEER EFFECTS (OR WORD OF MOUTH) – what drives this? ADVERTISING – what drives this?
  • 43. 43 Translating the product adoption model into SD Let’s put this in a systems thinking framework using STELLA Architect icons for visualization Some leading questions: 1) We have two populations (potential adopters and actual adopters) – how would we represent this in system dynamics (what would they be: a stock, a flow, or a converter?) 2) How do we consider the transition of populations i.e. from potential adopters to actual adopters? Is this a stock, flow, or converter? 3) How do we represent the drivers of adoption – are they stocks, flows, or converters?
  • 44. 44 Translating the product adoption model into SD Actual adopters Potential adopters 1) Our two populations are stocks (number of people at a given period in time). In STELLA, we represent as a rectangle. 2) Moving from potential to actual adopters is a flow: a change in a stock over time. Here, it is a biflow to consider disadoption. 3) Drivers of adoption (advertising, peer effects) are converters: they contain data or equations that influence the rate of change of our flow. Actual adopters Potential adopters Adoption rate Actual adopters Potential adopters Adoption rate Adoption from peer effects Adoption from advertising
  • 45. 45 Translating the product adoption model into SD How do we define “adoption from advertising”? This will depend on how good advertising is and the number of those that have not adopted. We define this as a multiplicative relationship, defining a new converter, “Effectiveness of advertising” and linking it and the stock “Potential adopters” to it. Actual adopters Potential adopters Adoption rate Adoption from peer effects Adoption from advertising Effectiveness of advertising
  • 46. 46 Translating the product adoption model into SD Now, how do we define adoption by word of mouth? This will depend on: • The mixing of adopters and potential adopters • The rate of contact between them (stock, flow, or converter?) • The percentage of those contacted that adopt (stock, flow, or converter) • The total population in the system (stock, flow, or converter?) Actual adopters Total population Potential adopters Adoption rate Contact rate Adoption fraction Adoption from peer effects Adoption from advertising Effectiveness of advertising Change in population Population growth rate
  • 47. 47 Results and extensions Let’s show some results from STELLA Architect based on this model. What happens if we change the parameters for contact rate, advertising effectiveness, and fraction adopted. Why? Some extensions: What if products do not last forever? How might this model changes if consumers have to discard old products to get new ones? What about learning or price effects? What about links to other systems? Weeks 0 500000 1000000 1.00 25.75 50.50 75.25 100.00 Potential adopters Actual adopters
  • 48. 48 Wrap-up: modeling considerations Taking a modular approach – consider interfaces between system phenomena: biophysical relationships, trade, adoption, cashflow (credit), social dynamics, etc. Simplicity vs. modeling “everything” Role of participatory approaches (means of bringing diverse stakeholders together) for data and validation. This is the topic for the next two sessions! Animal disease dynamics Animal production Market dynamics Investment dynamics Environmental impact biosecurity Resource constraints sales
  • 49. 49 References Bass, F. M. (1969). A new product growth for model consumer durables. Management Science, 15(5), 215-227. Lie, H., Brønn, C., & Rich, K.M. (2016). A systems perspective on partnership governance in smallholder agricultural value chains. Paper presented at the International Agribusiness and Food Management Association Annual Meetings, Aarhus, Denmark, June 2016. Sherwood, D. (2002). Seeing the forest for the trees: a manager's guide to applying systems thinking. London, Nicholas Brealey International. Wanyoike, F. & Rich, K.M., 2007. Socio-Economic Impacts of the 2007 Rift Valley Fever Outbreak in Kenya: A Case Study of the North Eastern Province Livestock Marketing Chain. Unpublished report for the USAID project, “Learning the Lessons of Rift Valley Fever: Improved Detection and Mitigation of Outbreaks,” Nairobi, Kenya: ILRI.
  • 50. THANK YOU Picture credit: K.M. Rich 2019 (Niamey, Niger)

Editor's Notes

  1. moving it to the heart of livestock agendas and investments and driving technical and transformational interventions so women can achieve better lives through livestock
  2. Maputo declaration- 10% of public resources to agriculture
  3. LMP, GLAD, TASSL and ADGG in particular
  4. Maputo declaration- 10% of public resources to agriculture
  5. Maputo declaration- 10% of public resources to agriculture
  6. Maputo declaration- 10% of public resources to agriculture
  7. Maputo declaration- 10% of public resources to agriculture
  8. Maputo declaration- 10% of public resources to agriculture
  9. Maputo declaration- 10% of public resources to agriculture
  10. Maputo declaration- 10% of public resources to agriculture
  11. Maputo declaration- 10% of public resources to agriculture
  12. moving it to the heart of livestock agendas and investments and driving technical and transformational interventions so women can achieve better lives through livestock
  13. Maputo declaration- 10% of public resources to agriculture
  14. Maputo declaration- 10% of public resources to agriculture
  15. Maputo declaration- 10% of public resources to agriculture
  16. Maputo declaration- 10% of public resources to agriculture
  17. Maputo declaration- 10% of public resources to agriculture
  18. Maputo declaration- 10% of public resources to agriculture
  19. Maputo declaration- 10% of public resources to agriculture
  20. moving it to the heart of livestock agendas and investments and driving technical and transformational interventions so women can achieve better lives through livestock
  21. moving it to the heart of livestock agendas and investments and driving technical and transformational interventions so women can achieve better lives through livestock
  22. LMP, GLAD, TASSL and ADGG in particular