Download as PDF, PPTX
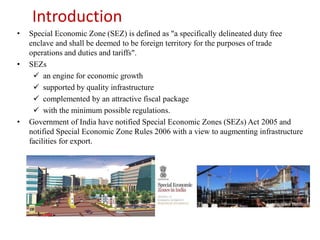
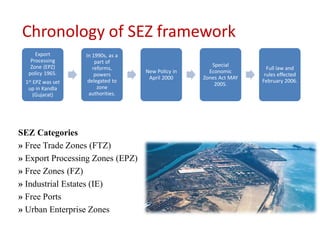
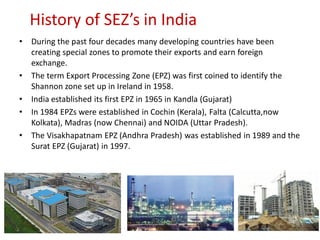
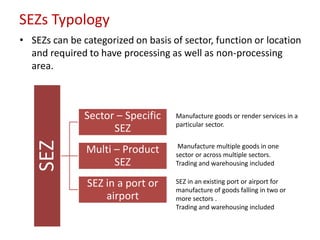
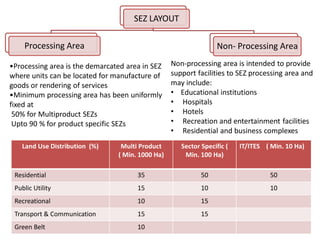
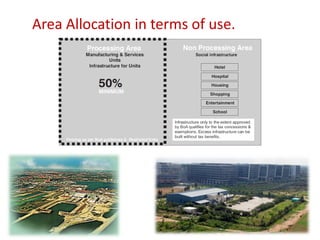
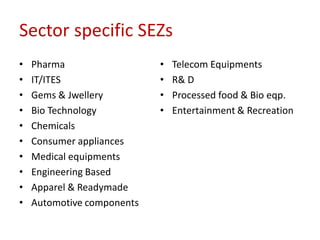
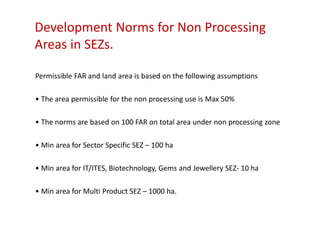
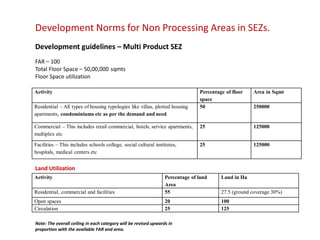
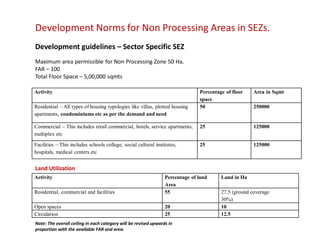
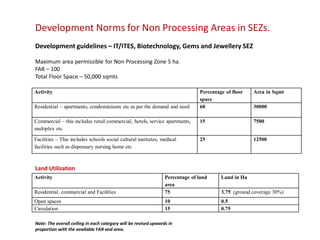
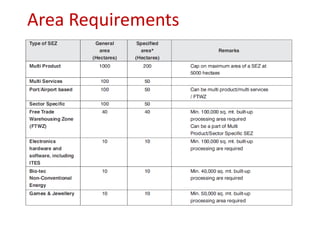
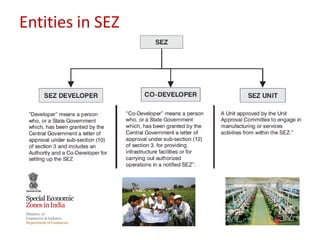
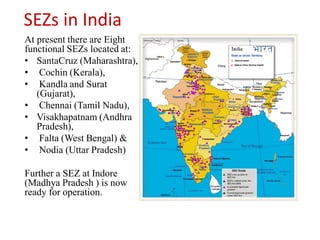
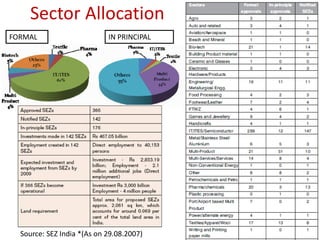

The document provides information on Special Economic Zones (SEZs) in India. It discusses that SEZs are specifically delineated duty free enclaves considered foreign territory for trade. SEZs are intended to be an engine for economic growth supported by quality infrastructure and an attractive fiscal package with minimum regulations. The history and categories of SEZs in India are described. Key objectives of the SEZ Act of 2005 include generation of economic activity, promotion of exports and investment, and creation of employment opportunities. Benefits of SEZs include job creation, skill formation, attracting investors, technology upgrading, and growth of exports and manufacturing. Development norms for processing and non-processing areas in SEZs are also


![final Fahd Albulaiteeh's C[1]. V.FINAL GENERAL](https://cdn.slidesharecdn.com/ss_thumbnails/b0d3257a-0ce5-4d46-887f-3340cfa19705-150310020313-conversion-gate01-thumbnail.jpg?width=640&height=640&fit=bounds)


