Download to read offline


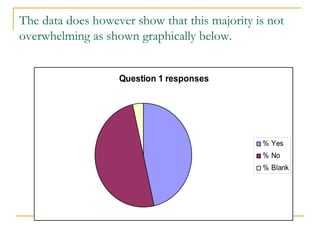
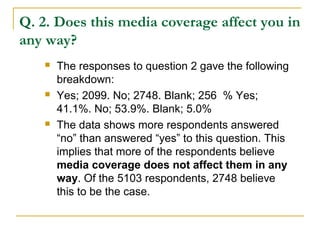

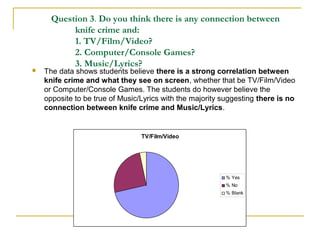
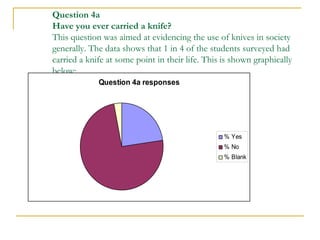


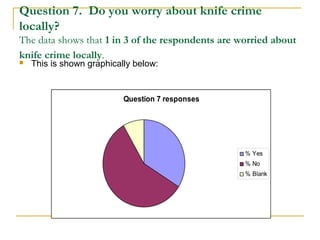


This document summarizes the results of a knife crime survey of over 5,000 students in West Yorkshire. Key findings include: - Slightly over 50% of students believed media coverage of knife crime is inaccurate. - Over 50% felt media coverage does not affect them personally. - Students saw a strong connection between knife crime and TV/films but not music. - Around 25% had carried a knife at some point, usually for legitimate reasons like cooking. - Around 1 in 50 students reported regularly carrying a knife, usually citing protection as the reason. - 1 in 4 students knew someone who carries a knife. - 1 in 3 students reported worrying about local knife crime and the


![Hall_Elizabeth_Unit_Two_Written_assignment[1]](https://cdn.slidesharecdn.com/ss_thumbnails/3569544-thumbnail.jpg?width=640&height=640&fit=bounds)


