Download as PDF, PPTX


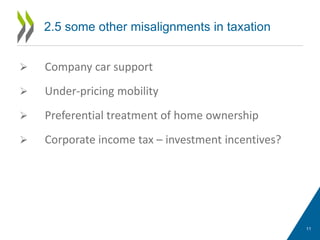


This document discusses the challenges of transforming the global economic system to address climate change through green fiscal reform and growth. It notes misalignments in current tax structures that do not incentivize low-carbon transformation. While concerns exist around equity, competitiveness and growth, the document finds that well-designed environmental policies with revenue recycling need not harm, and may even benefit, economic outcomes if implemented in a coordinated manner across countries. Stringent climate policies that price carbon and support clean innovation are still needed to meet emissions targets.


