Download to read offline
![Sensornets and Global Change Invited Talk Greenovation Forum: Sensing and Sustainability [email_address] December 2, 2009 Dr. Larry Smarr Director, California Institute for Telecommunications and Information Technology Harry E. Gruber Professor, Dept. of Computer Science and Engineering Jacobs School of Engineering, UCSD Follow me on Twitter: http://twitter.com/lsmarr](https://image.slidesharecdn.com/tcalit2widewebextranethtmlnewsroompresentationslsmarr2009pptgreenovationsensornets120209-091202180834-phpapp01/75/Sensornets-and-Global-Change-1-2048.jpg)
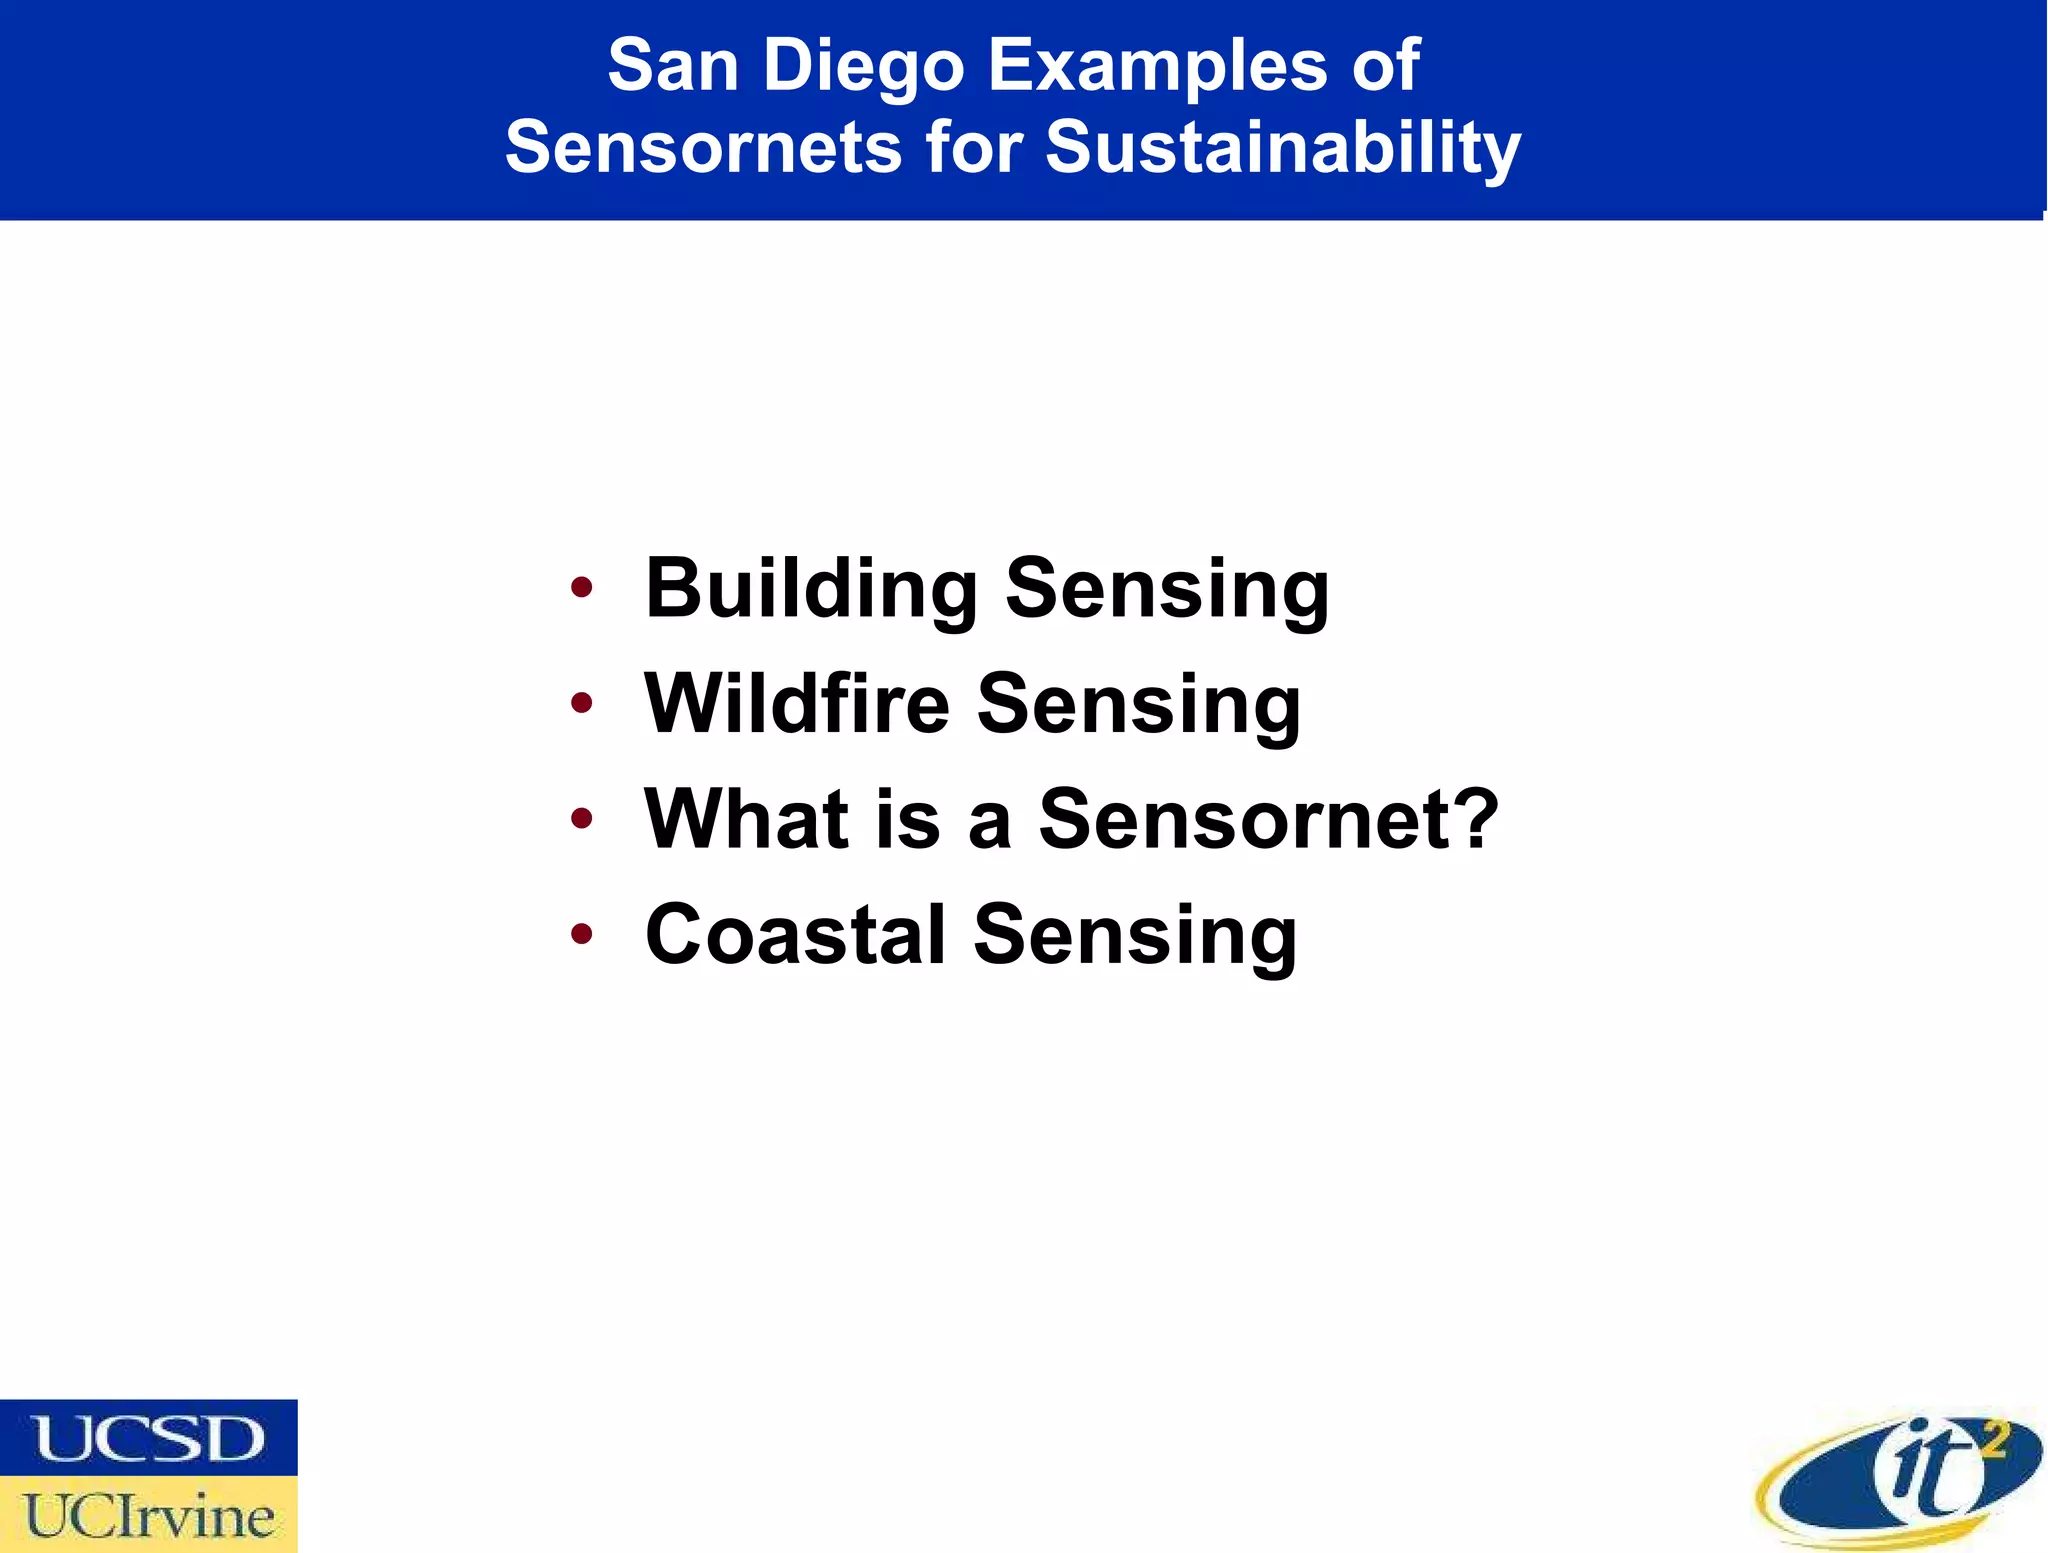
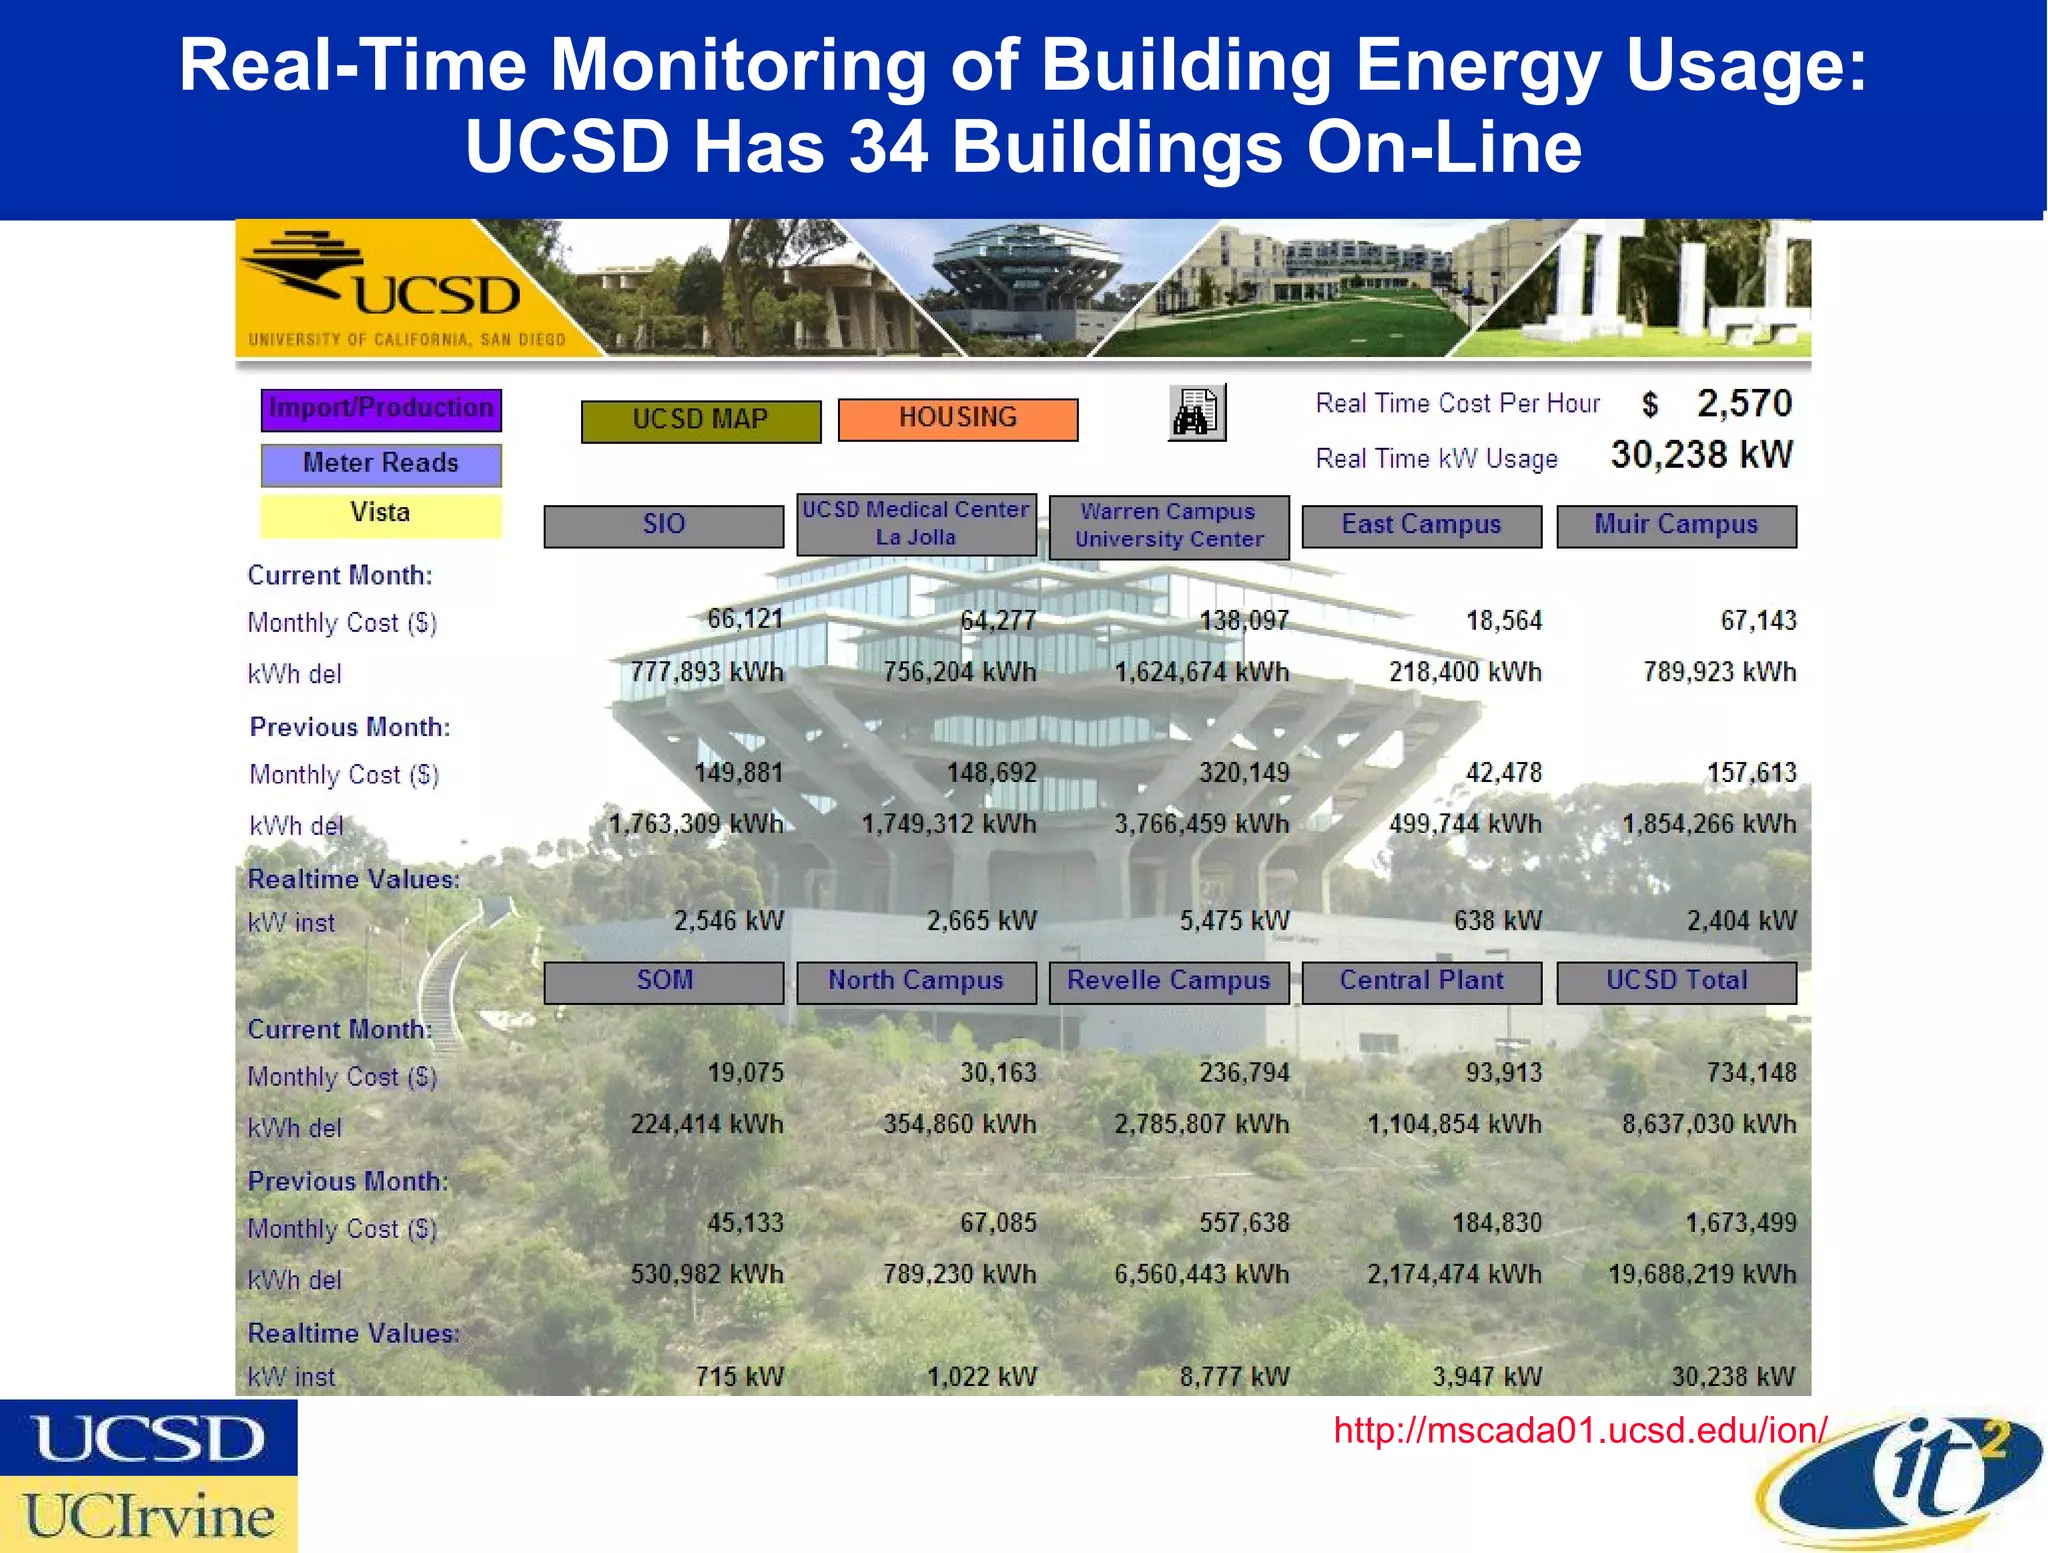


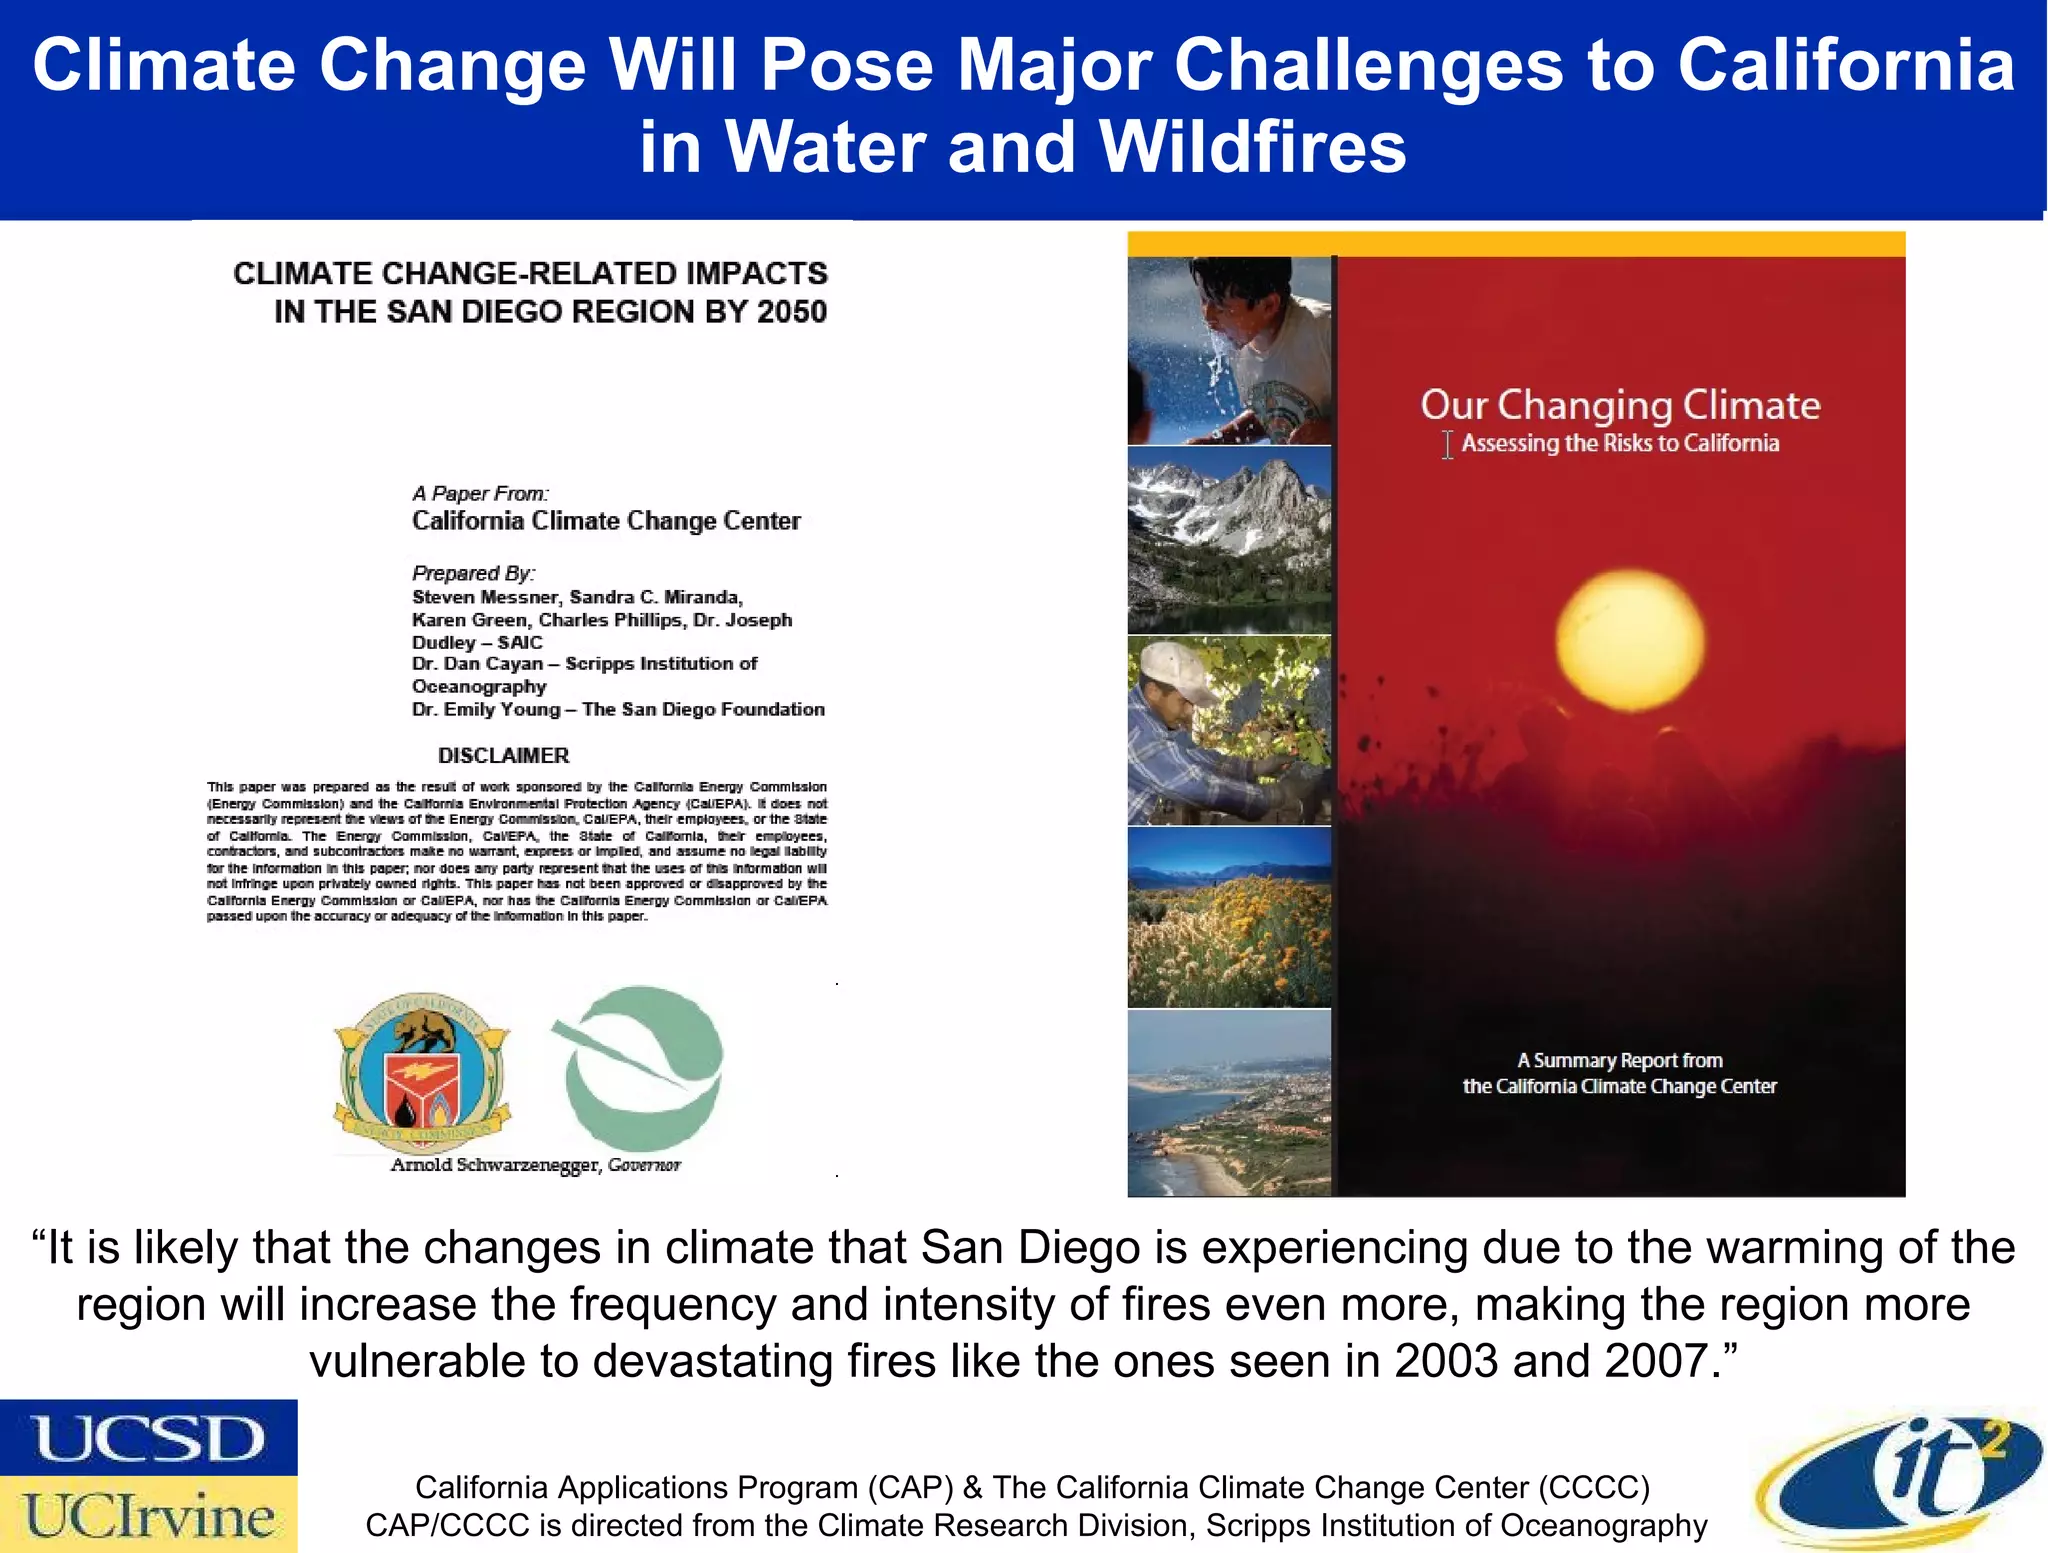
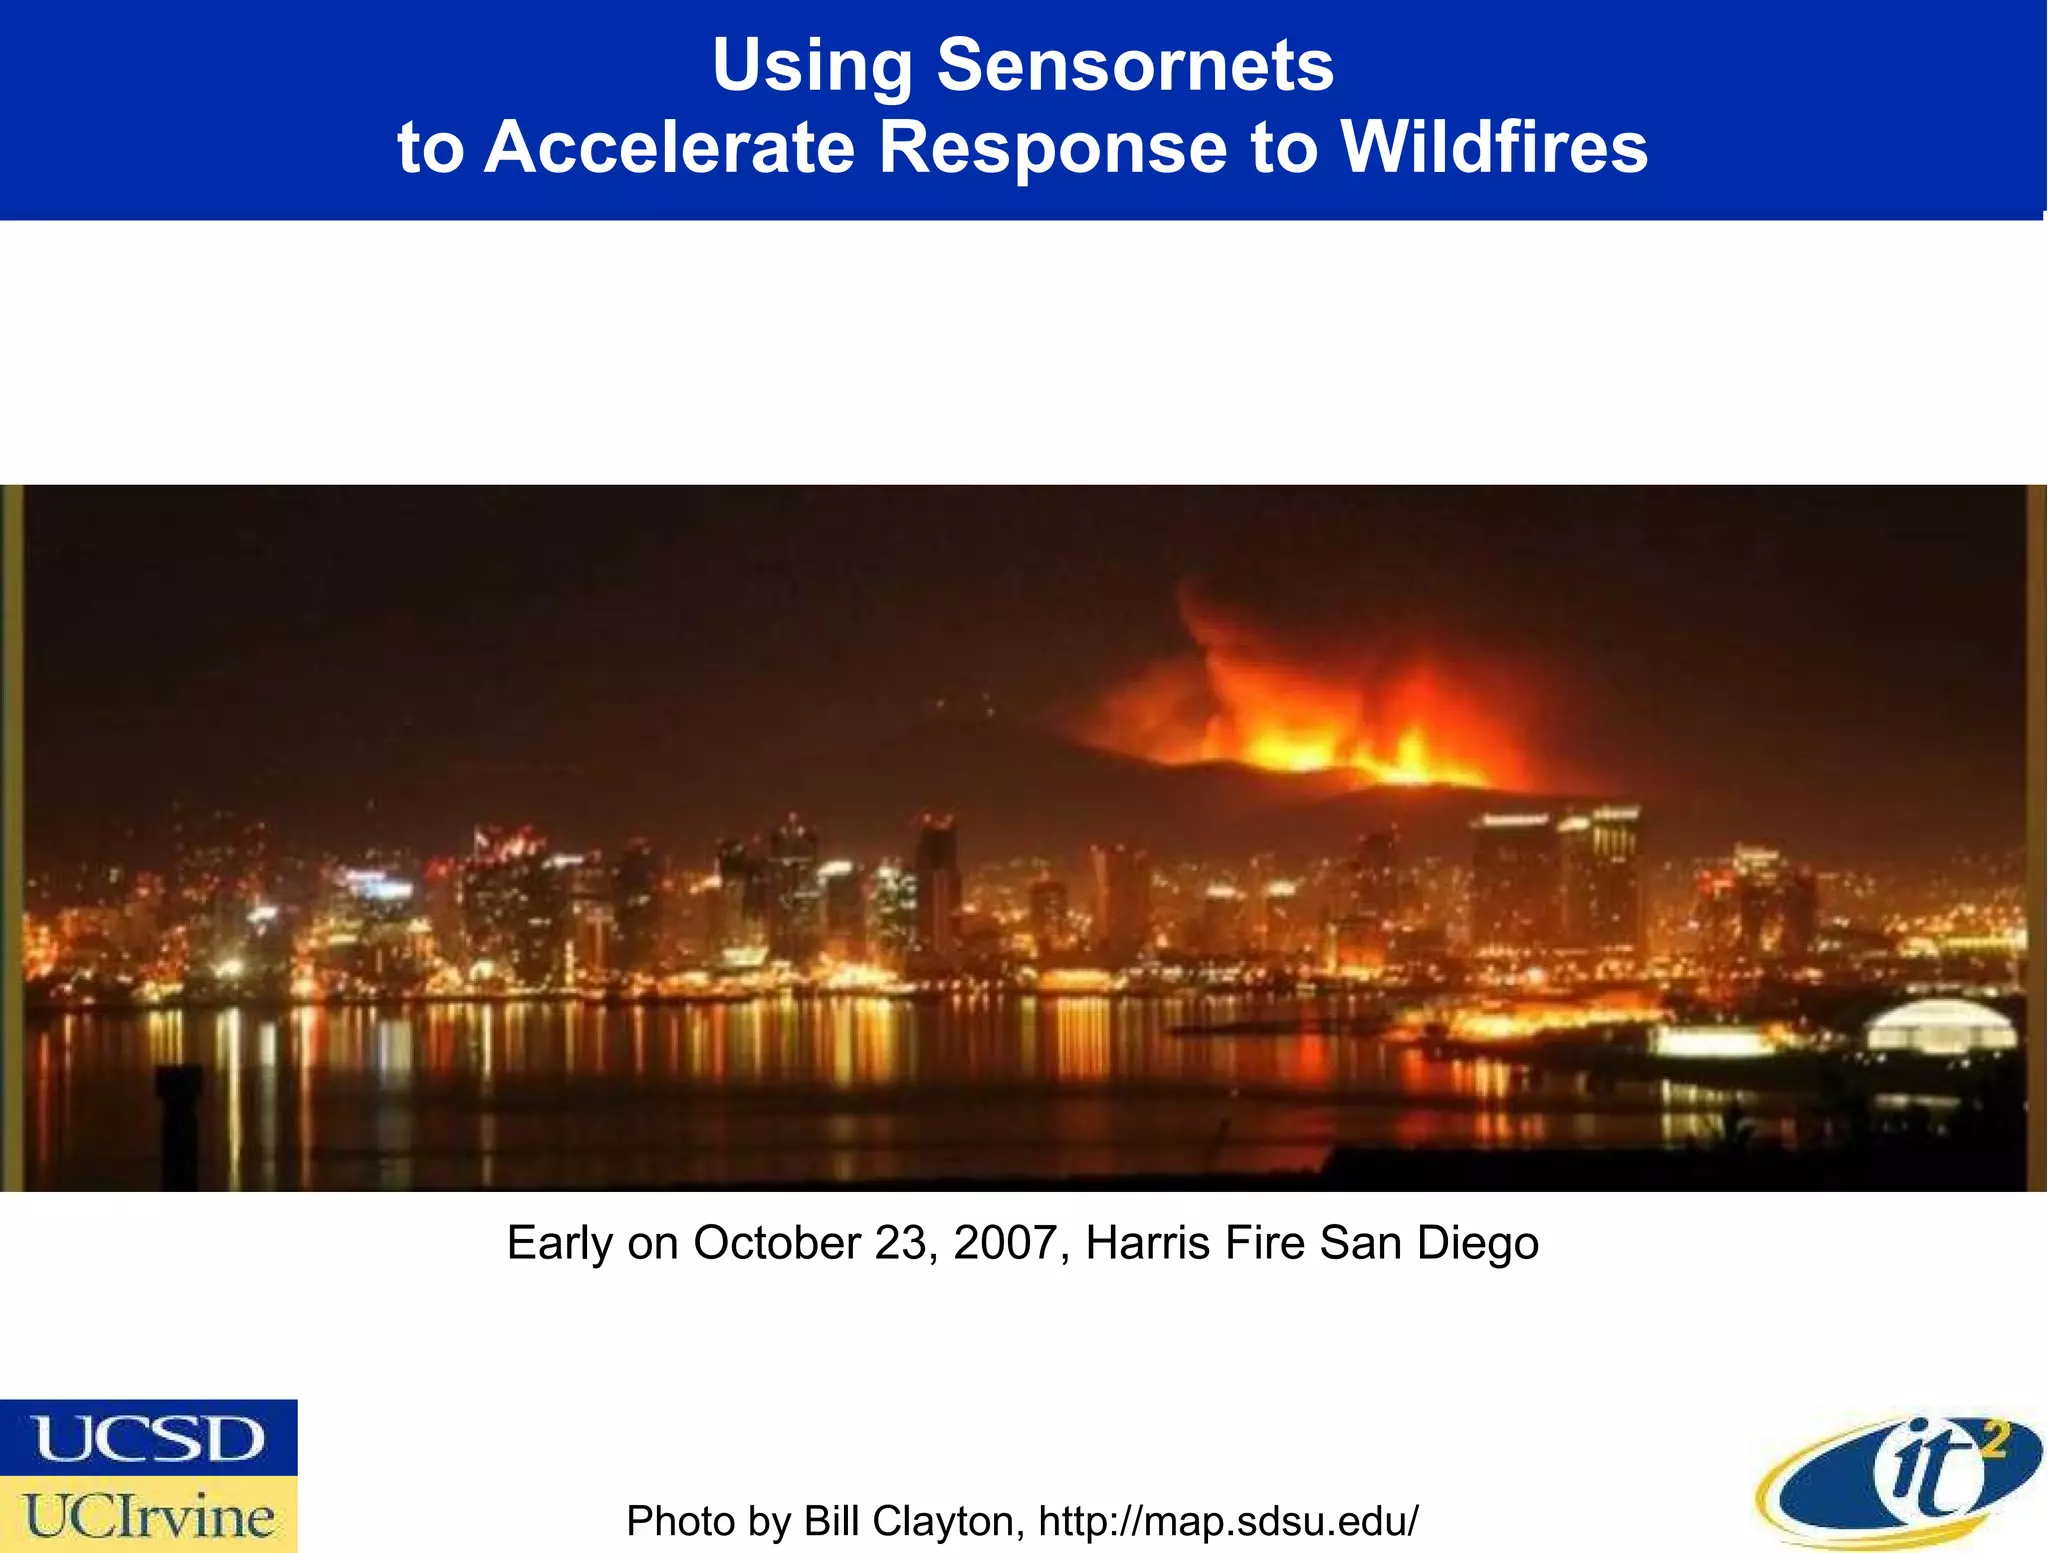
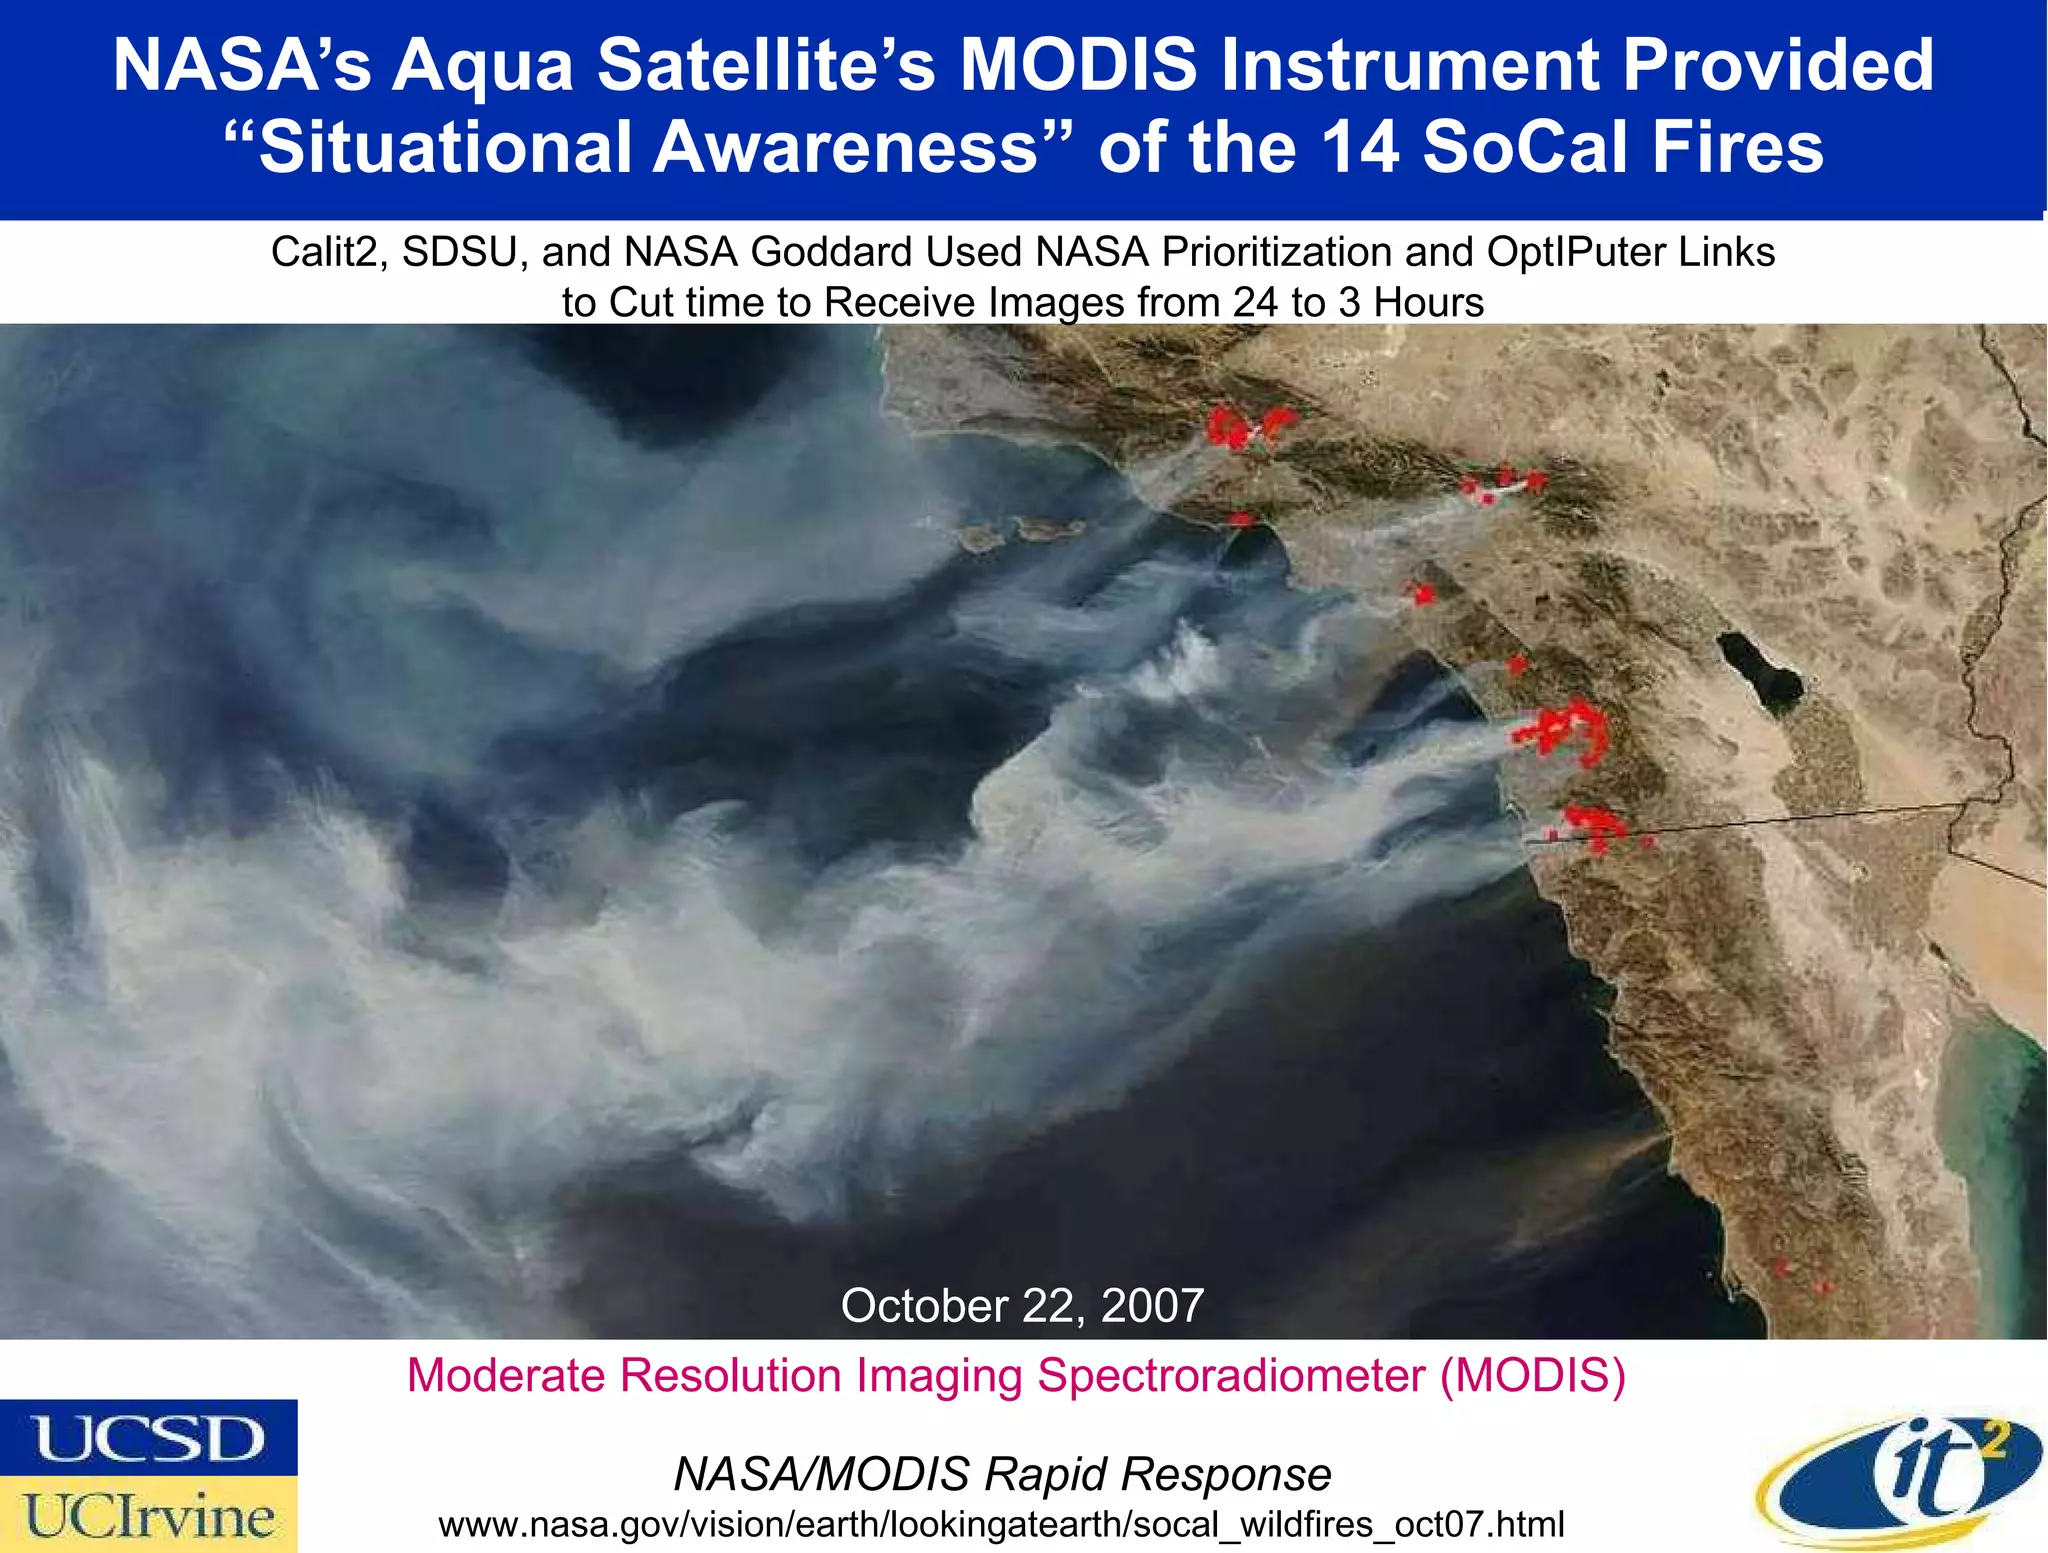
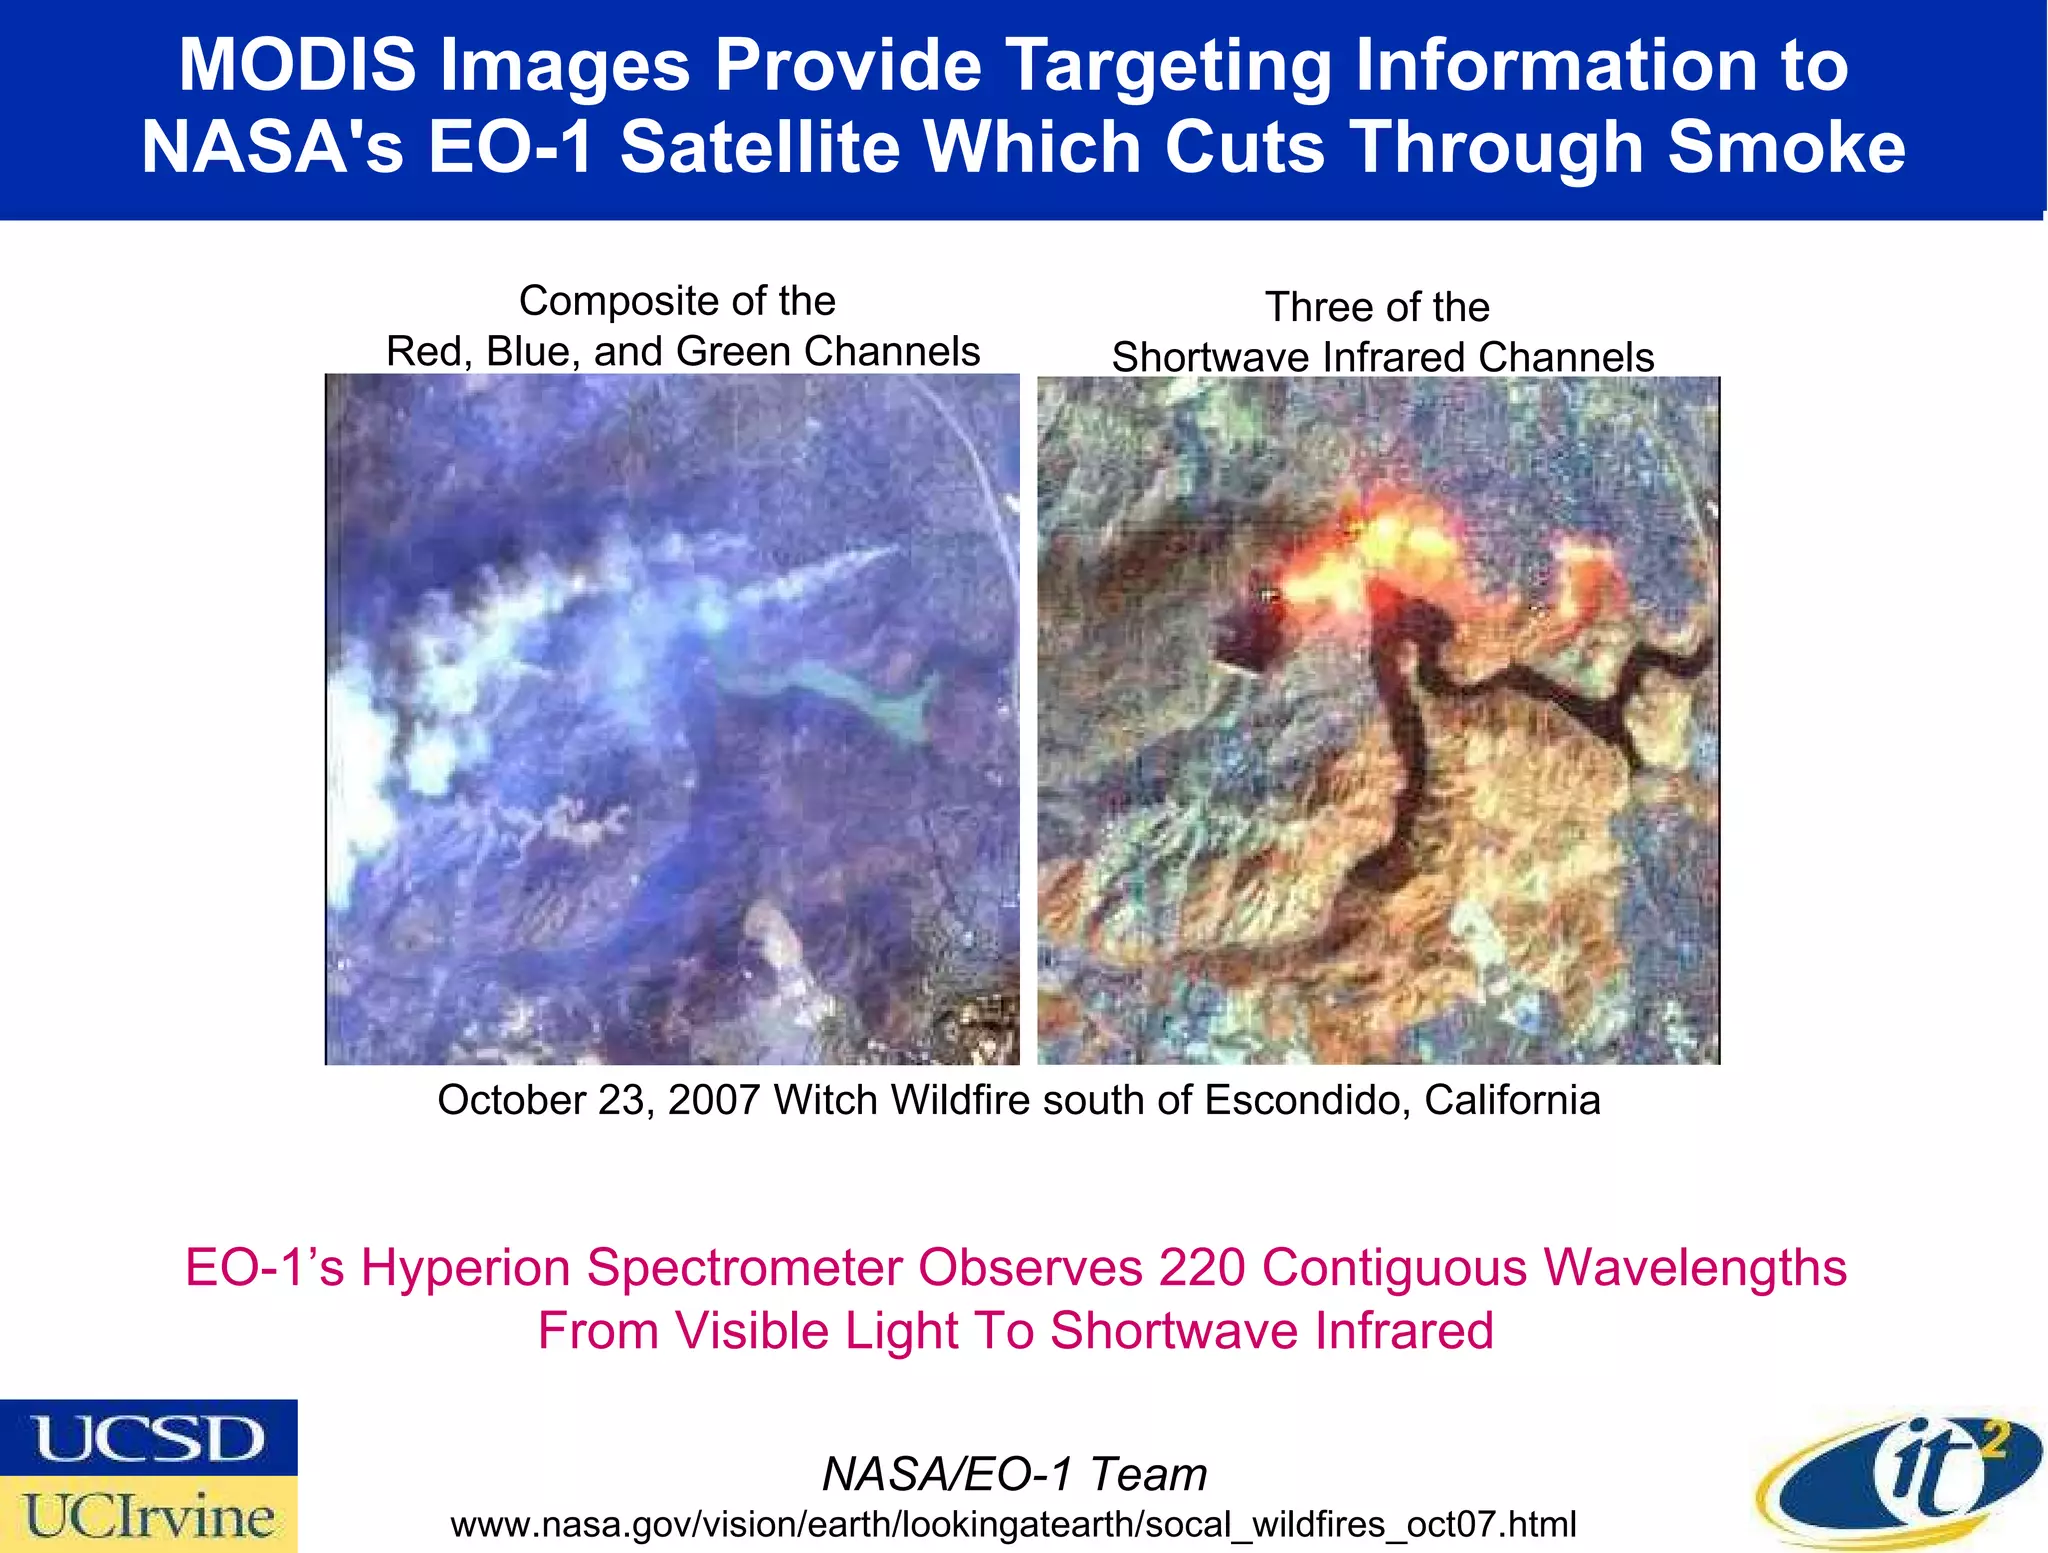
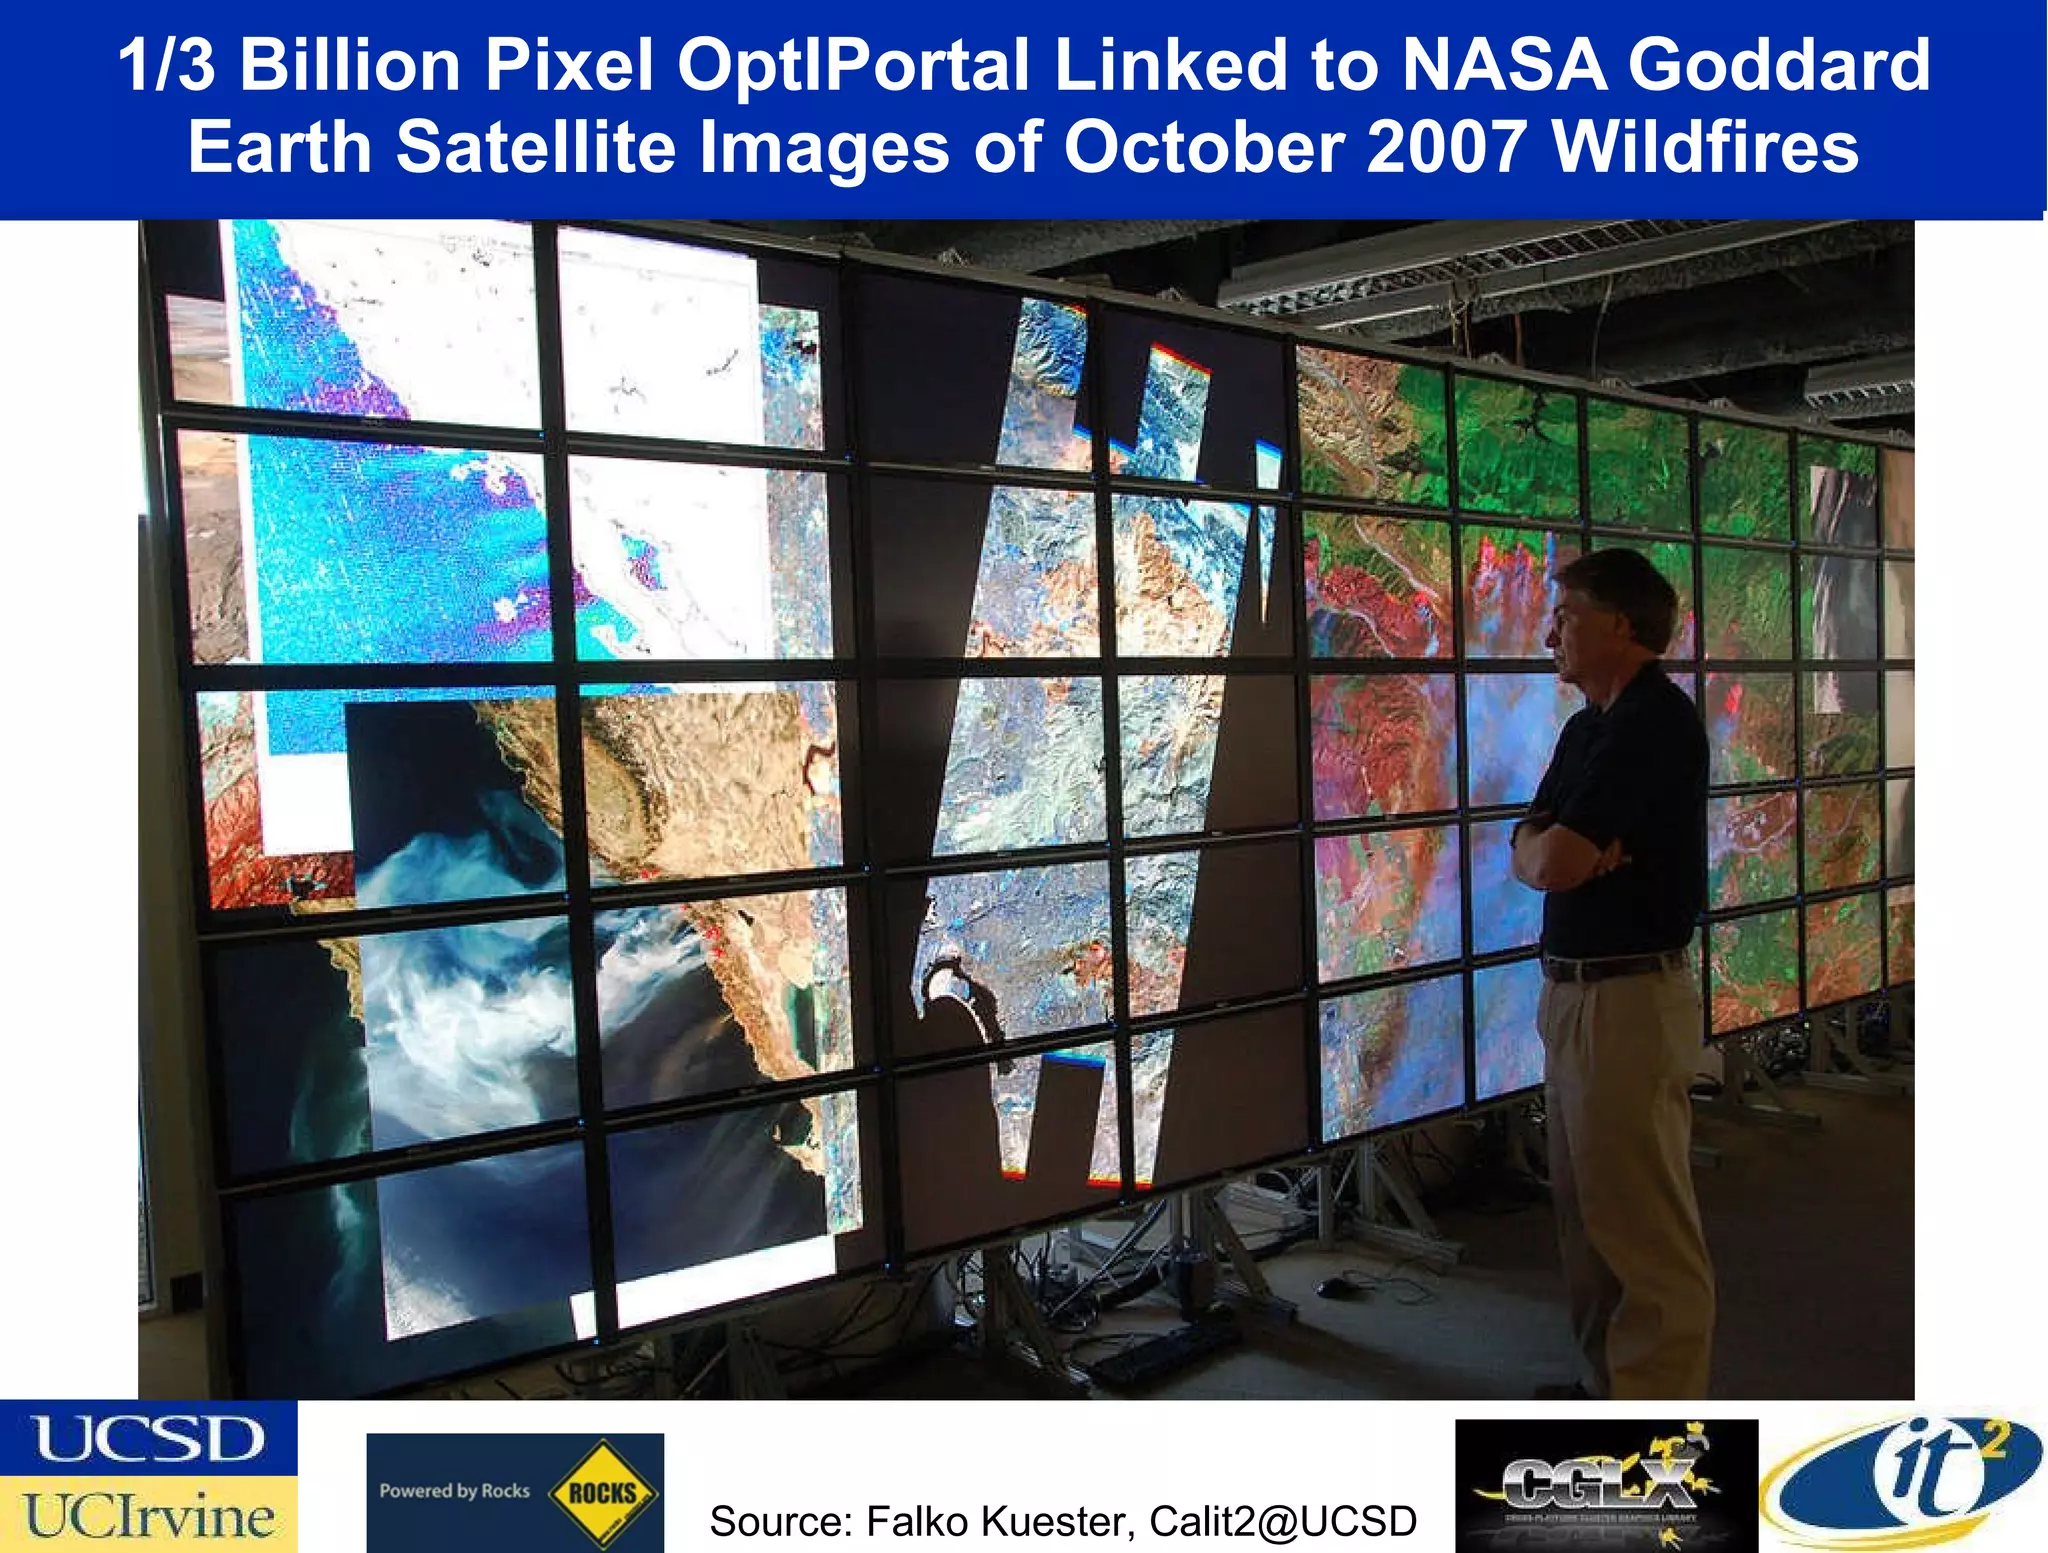
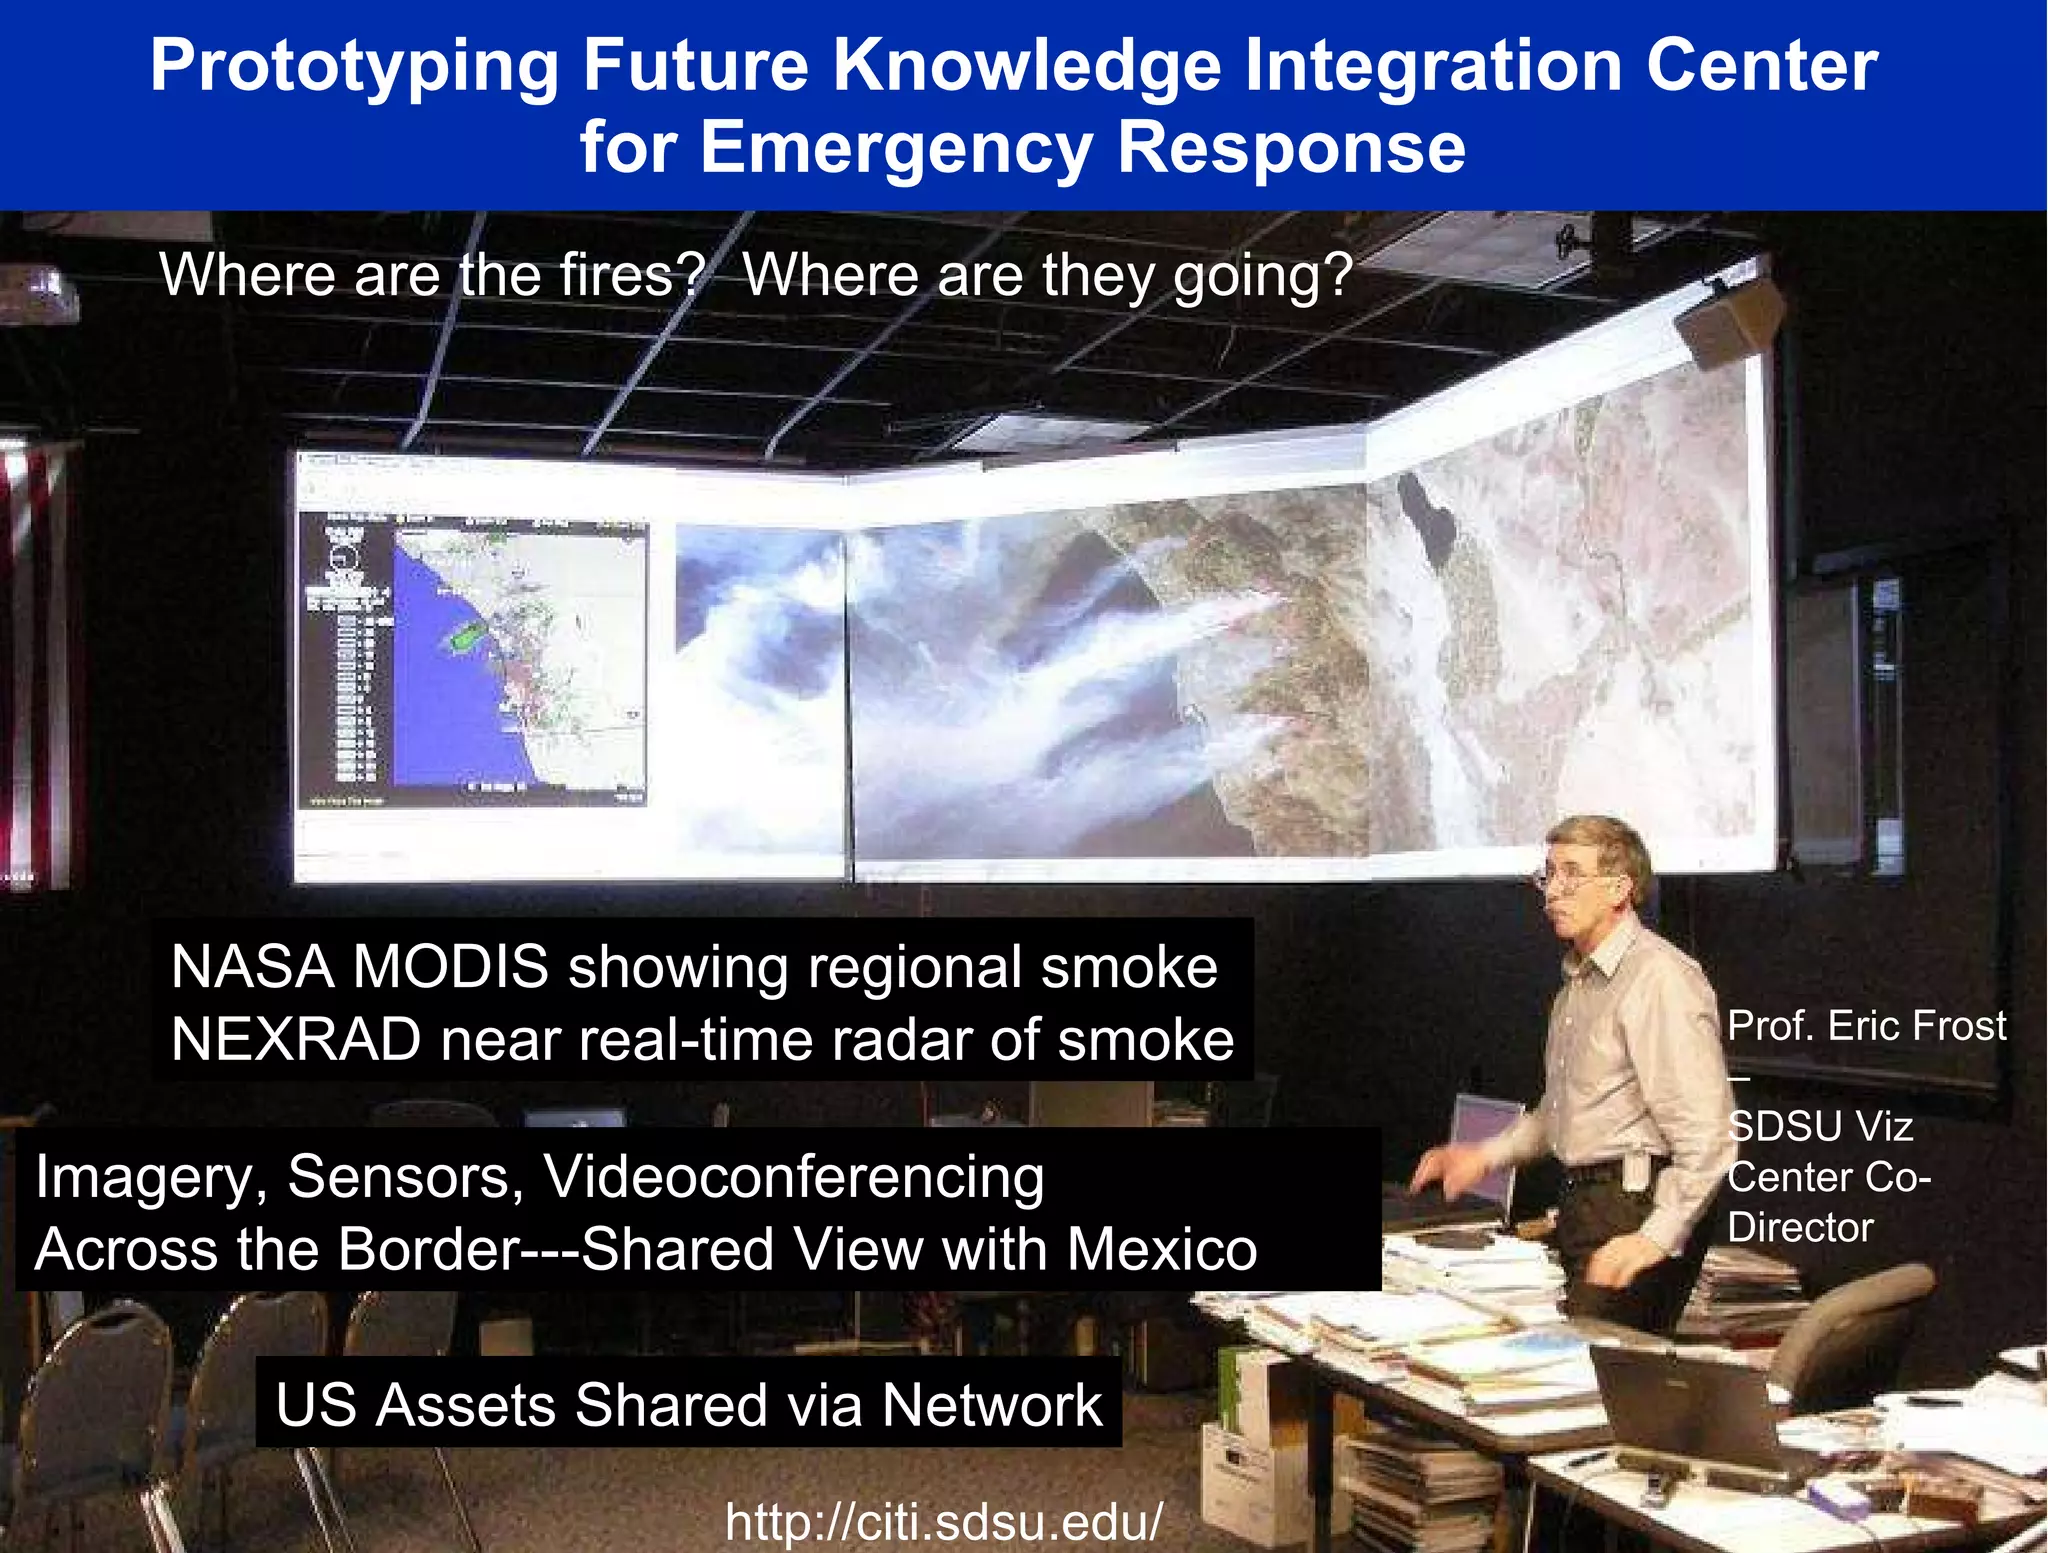
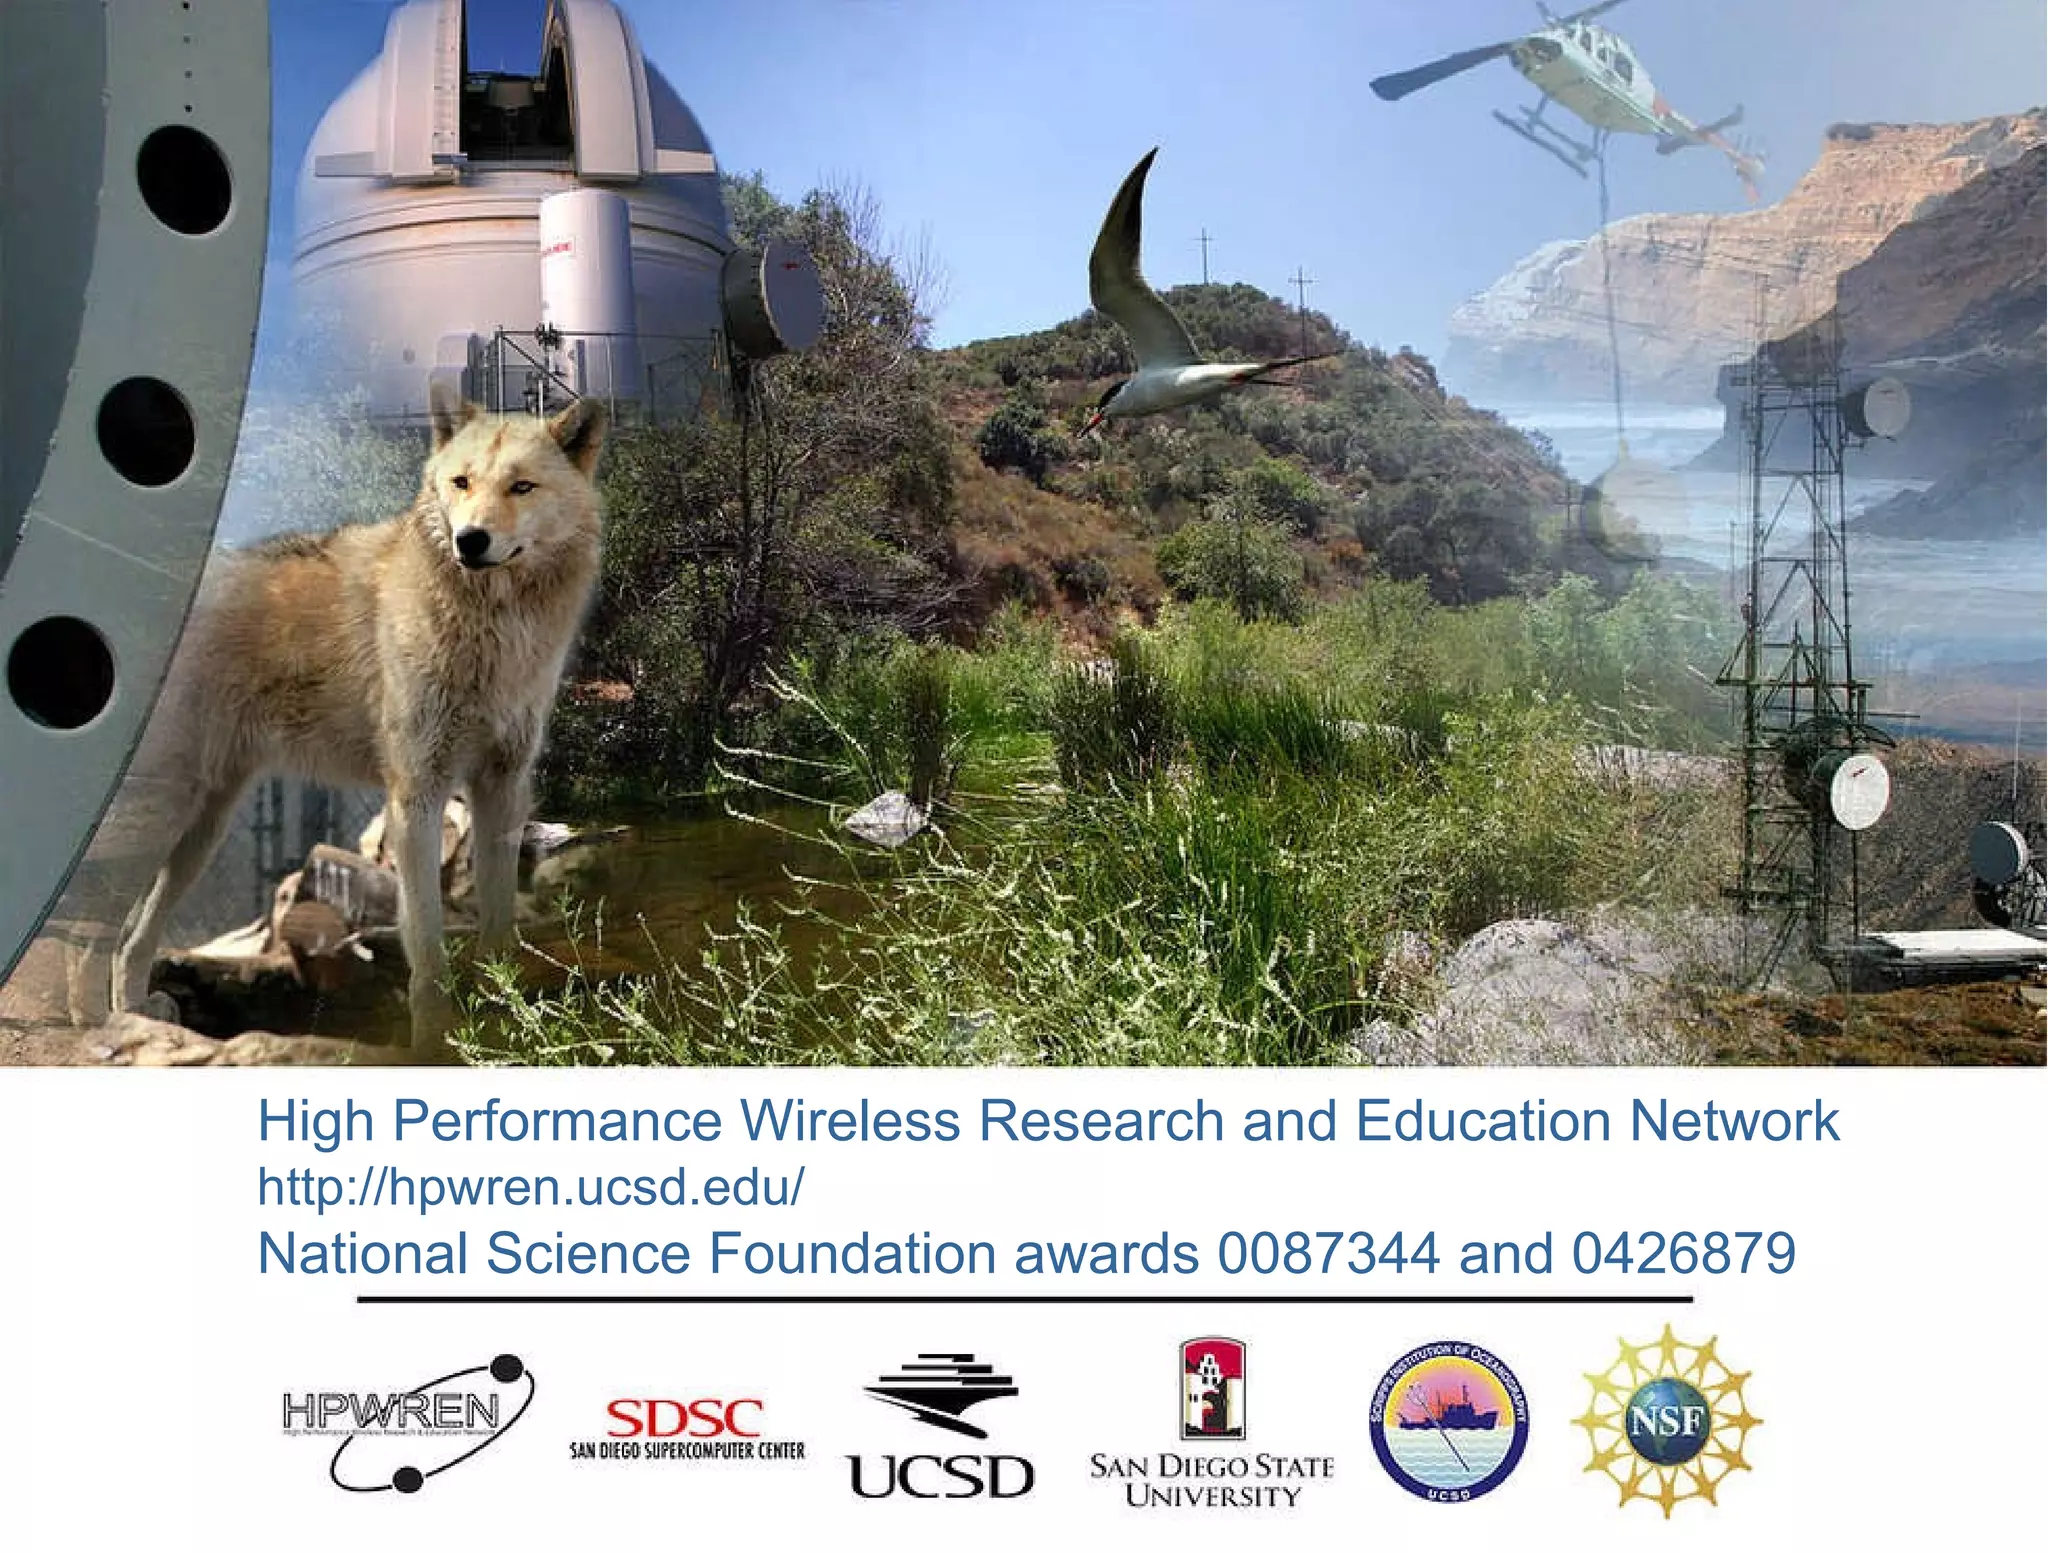
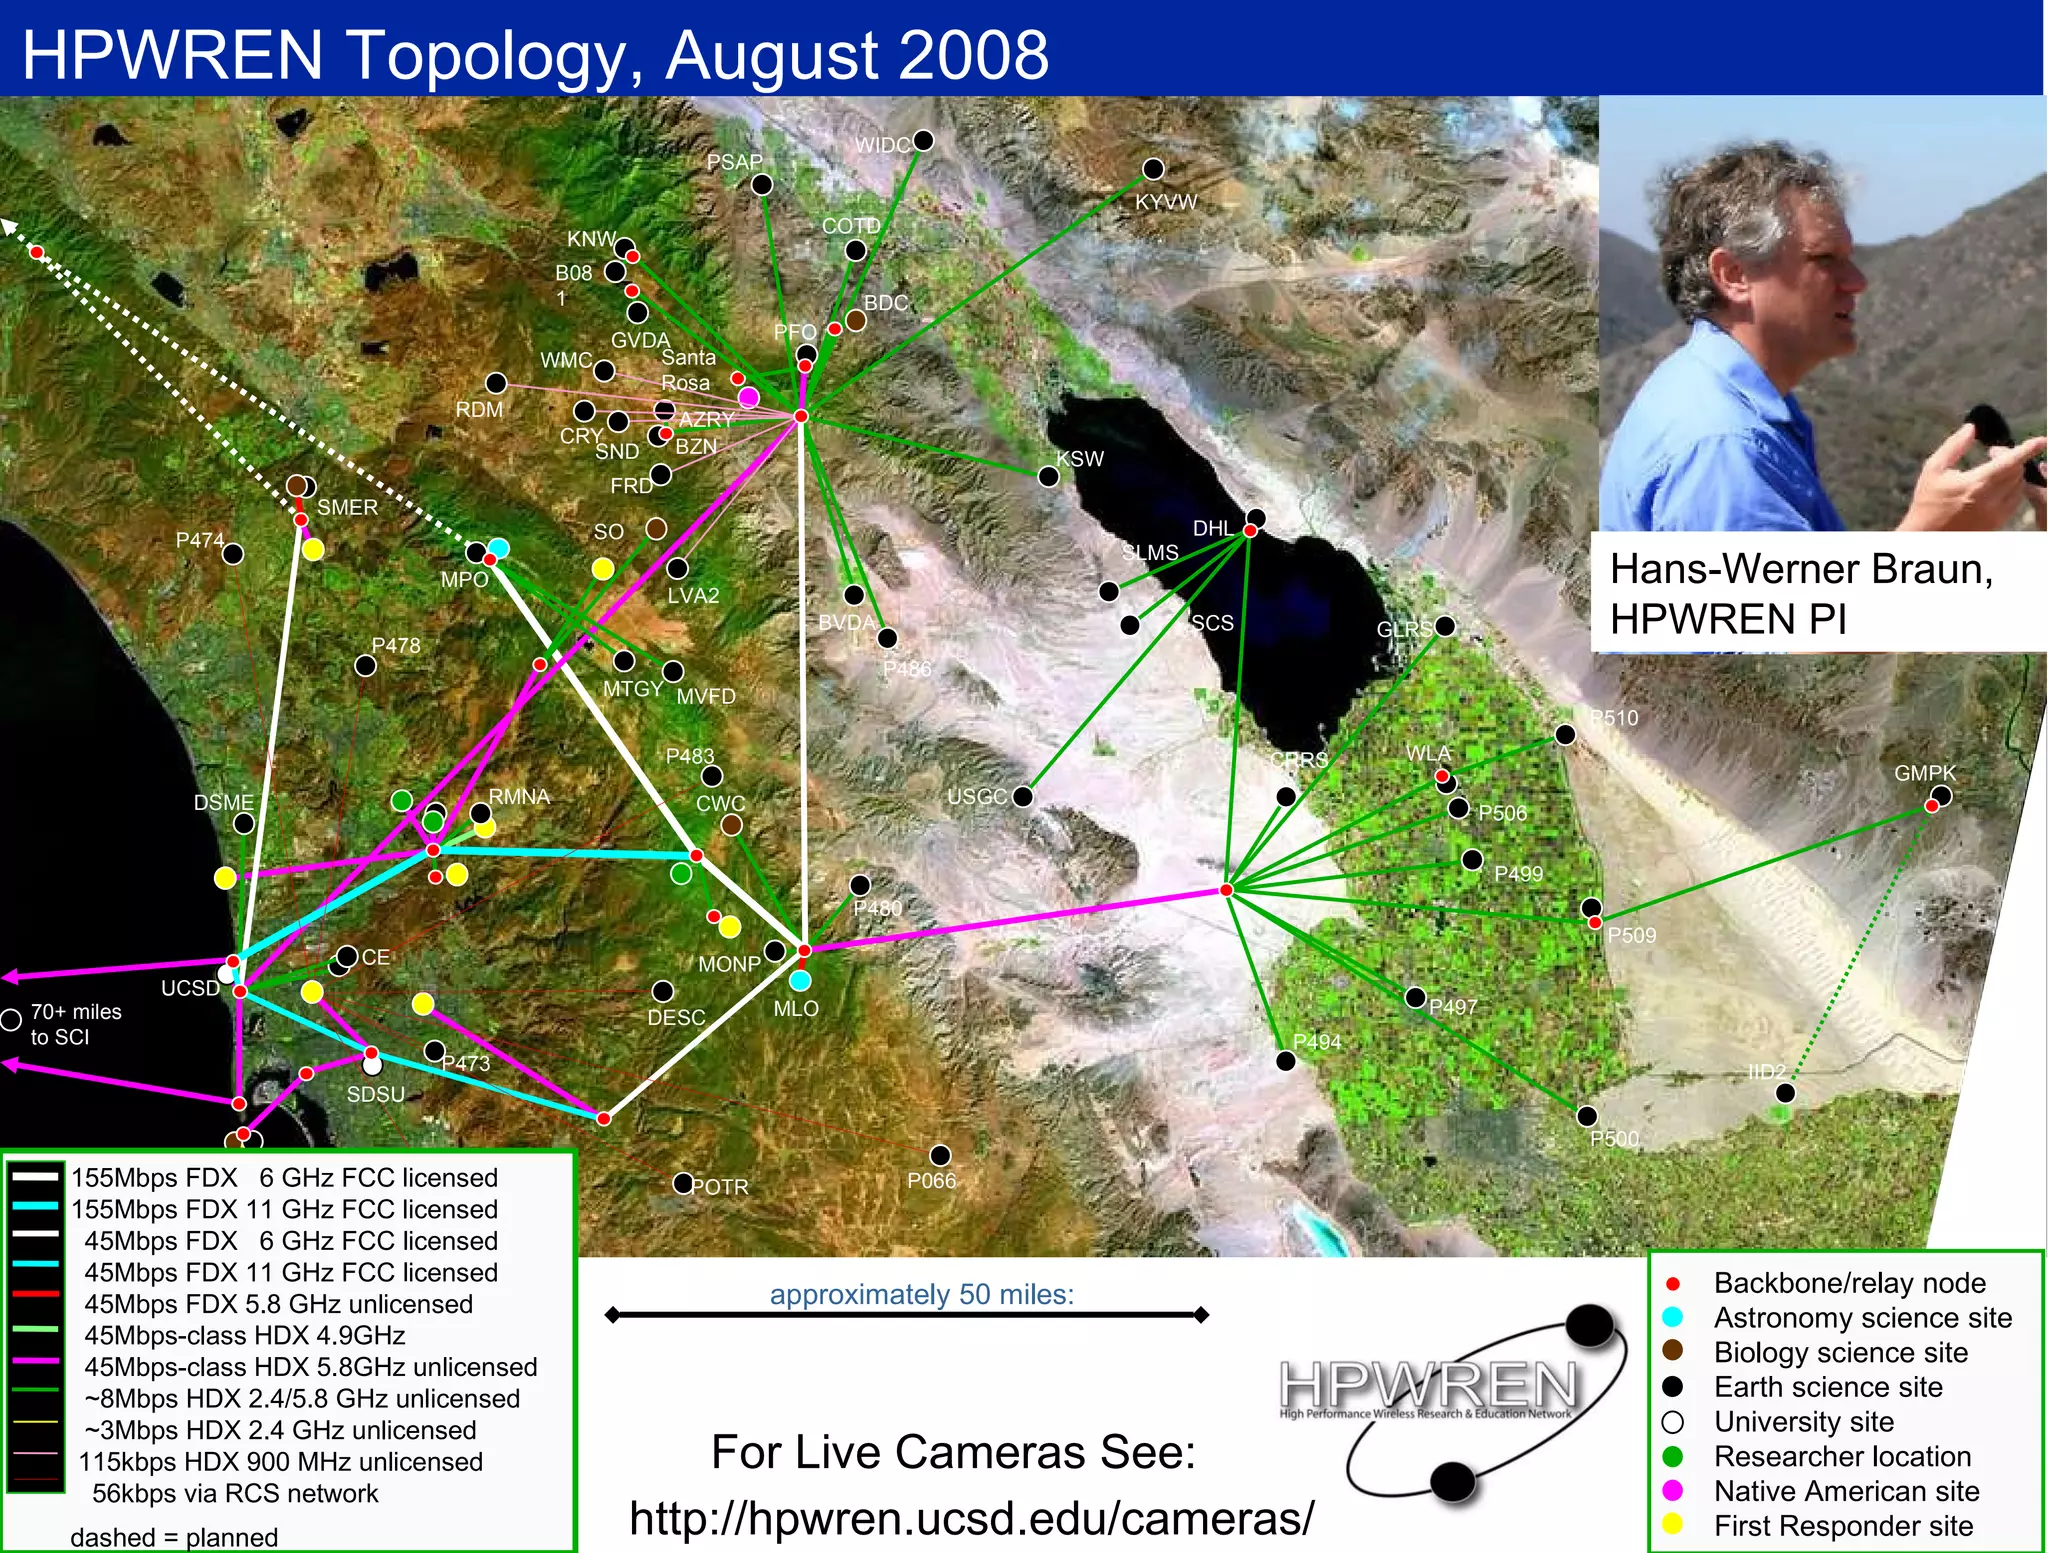
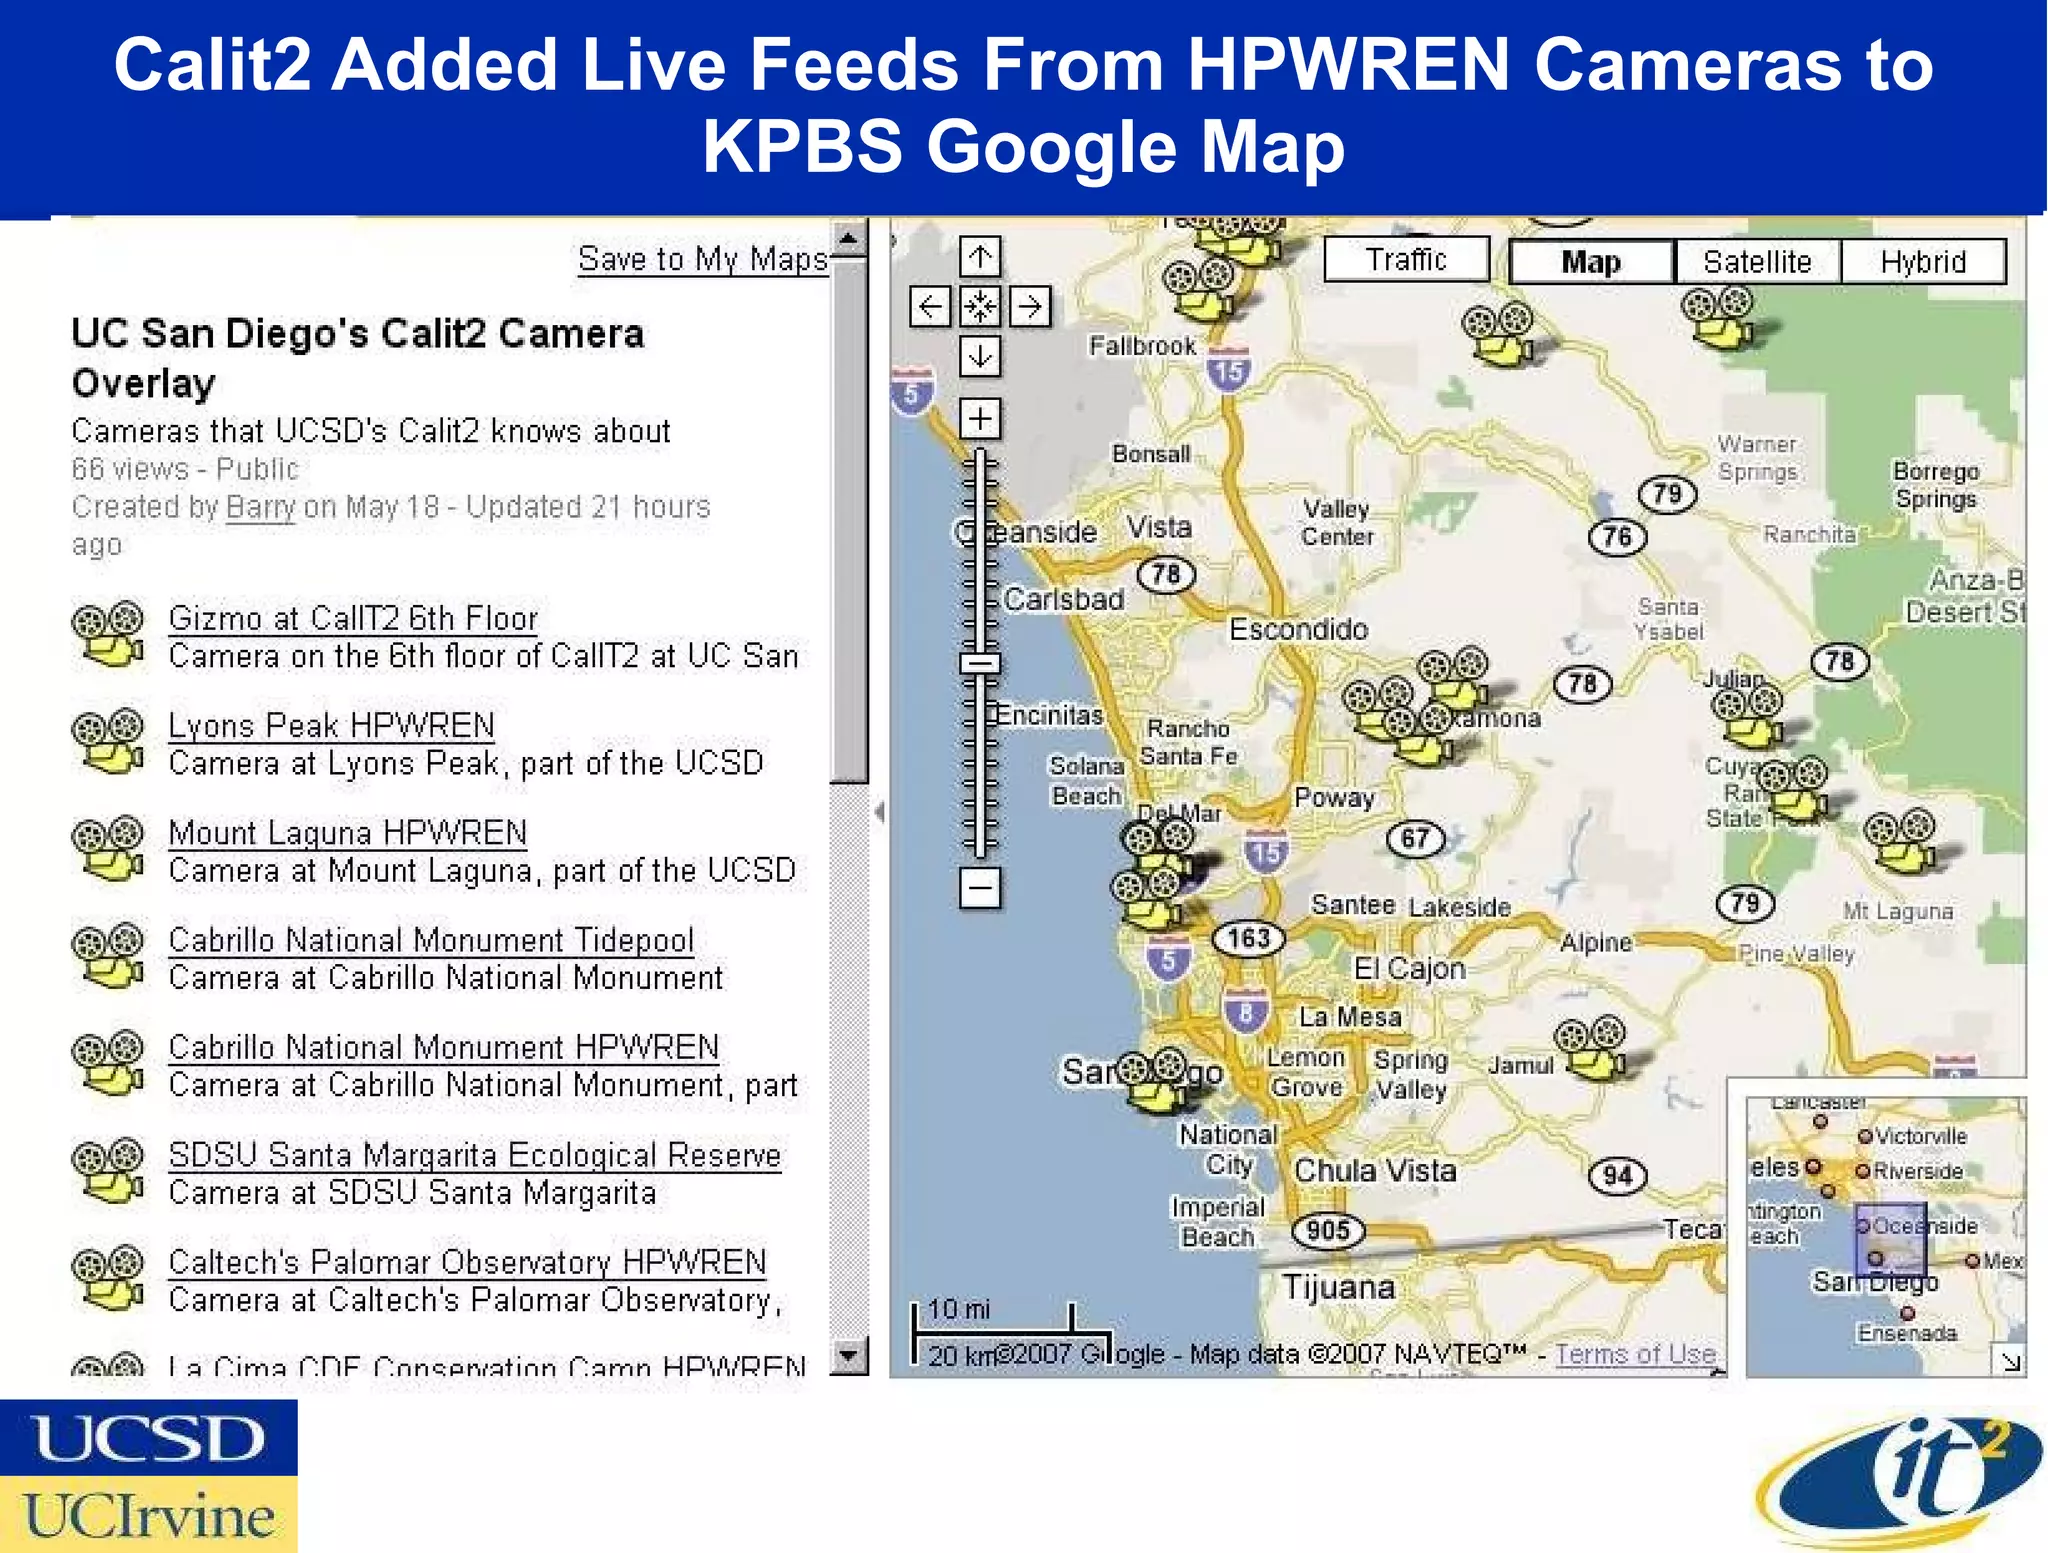
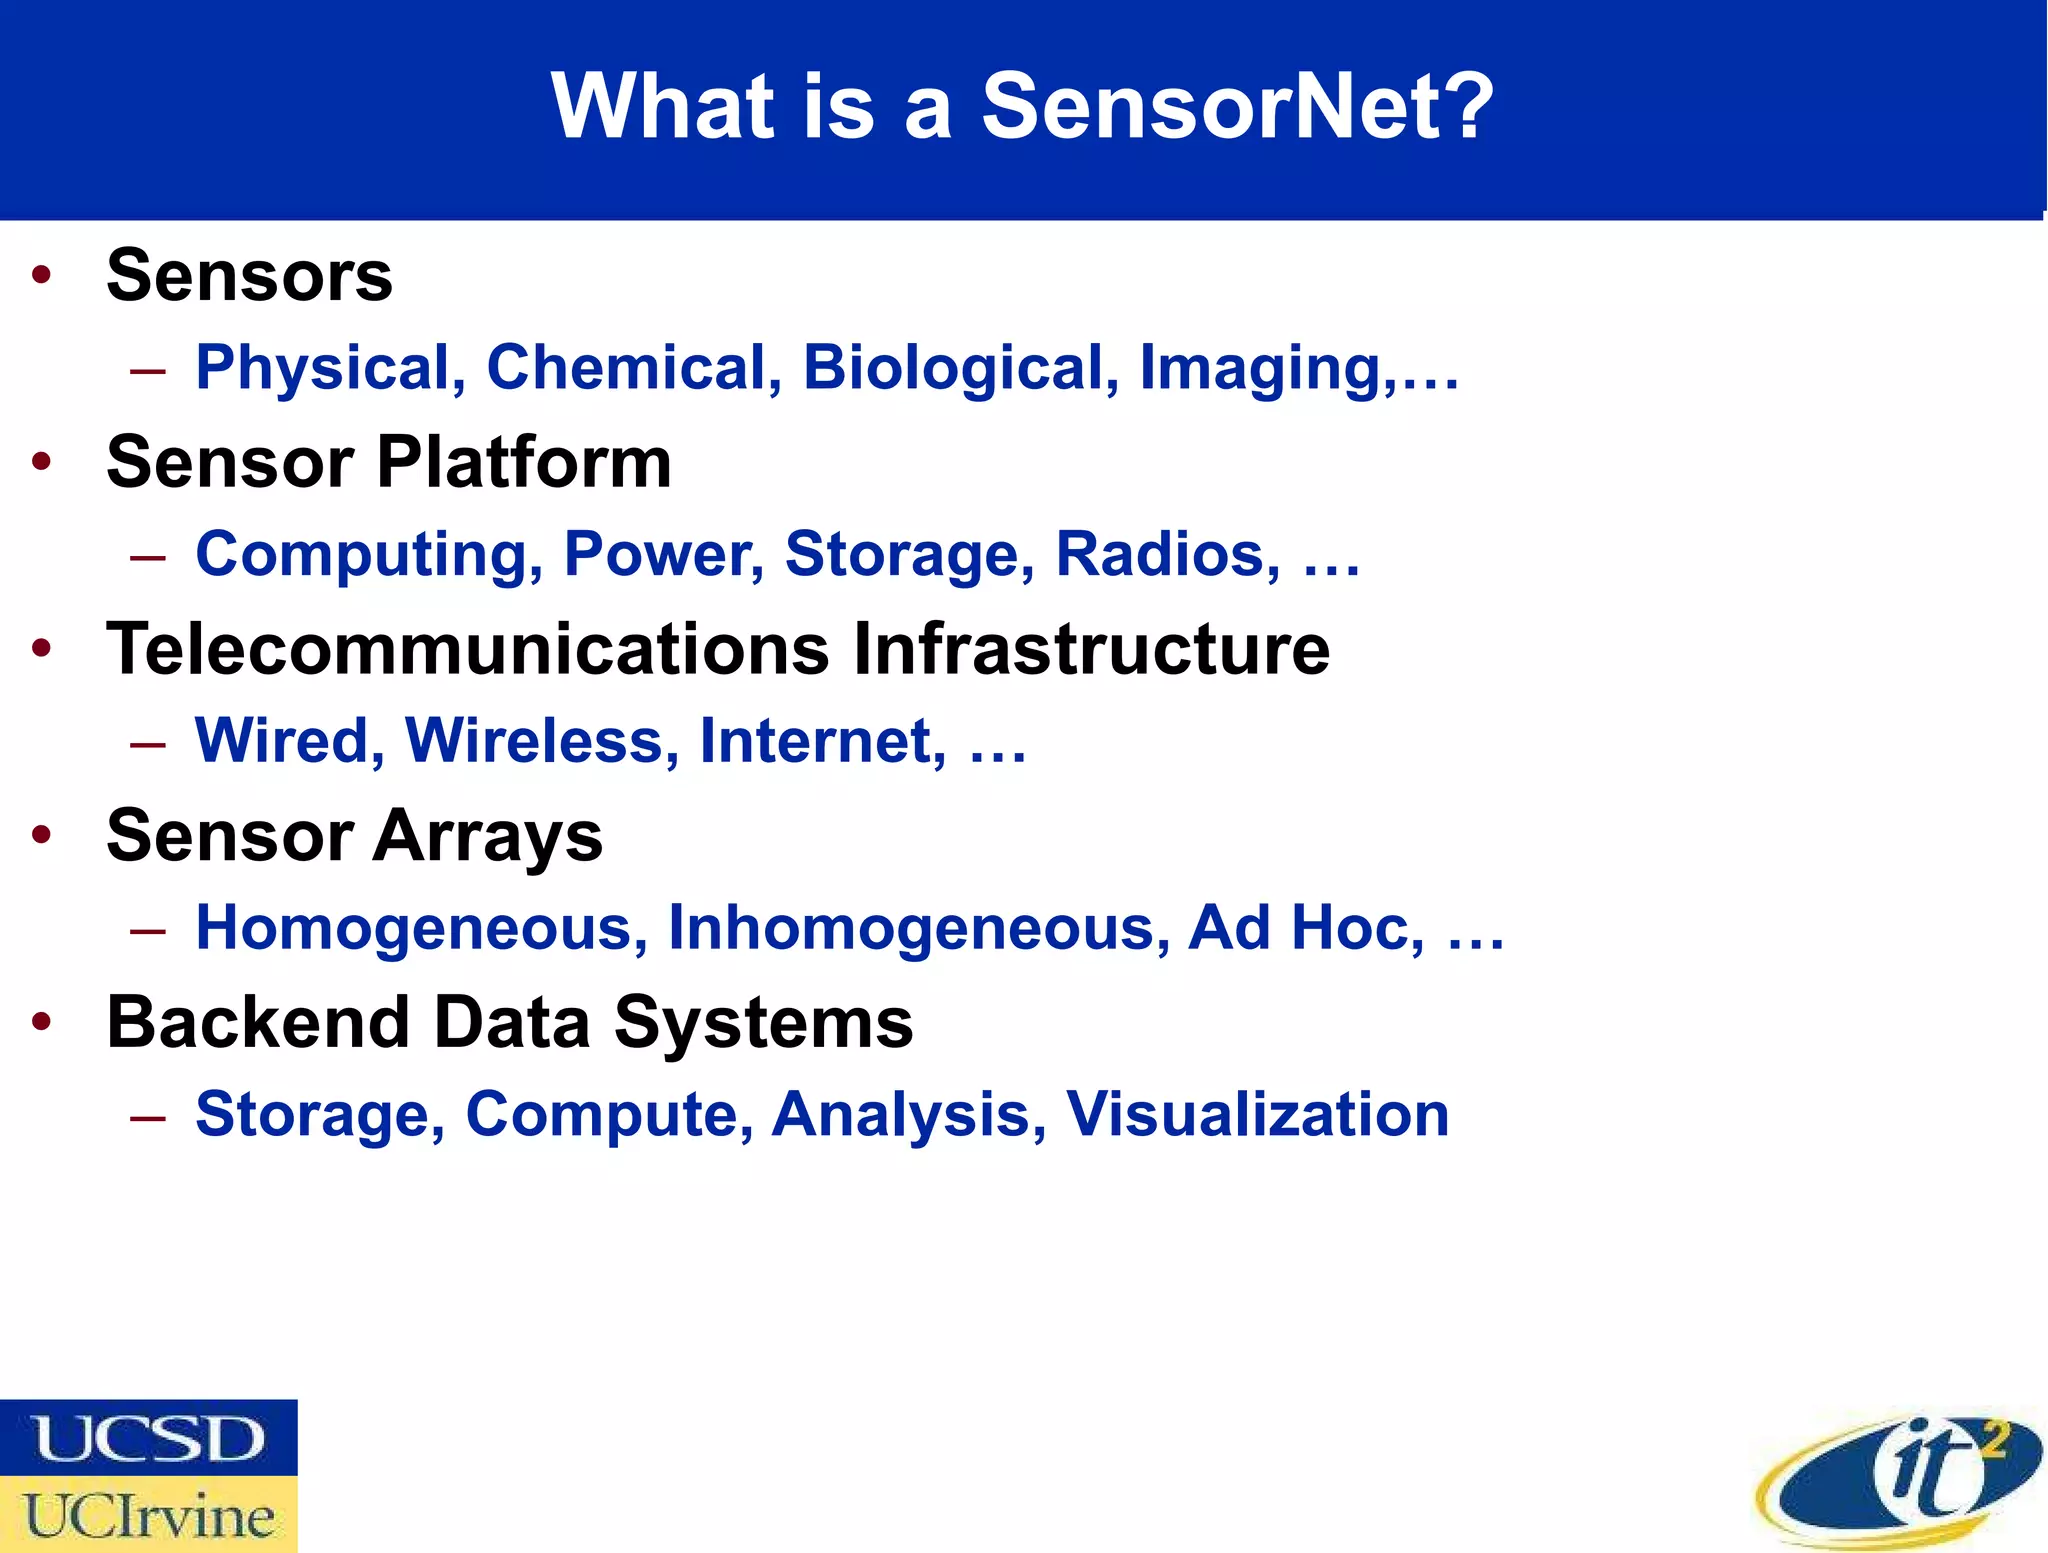
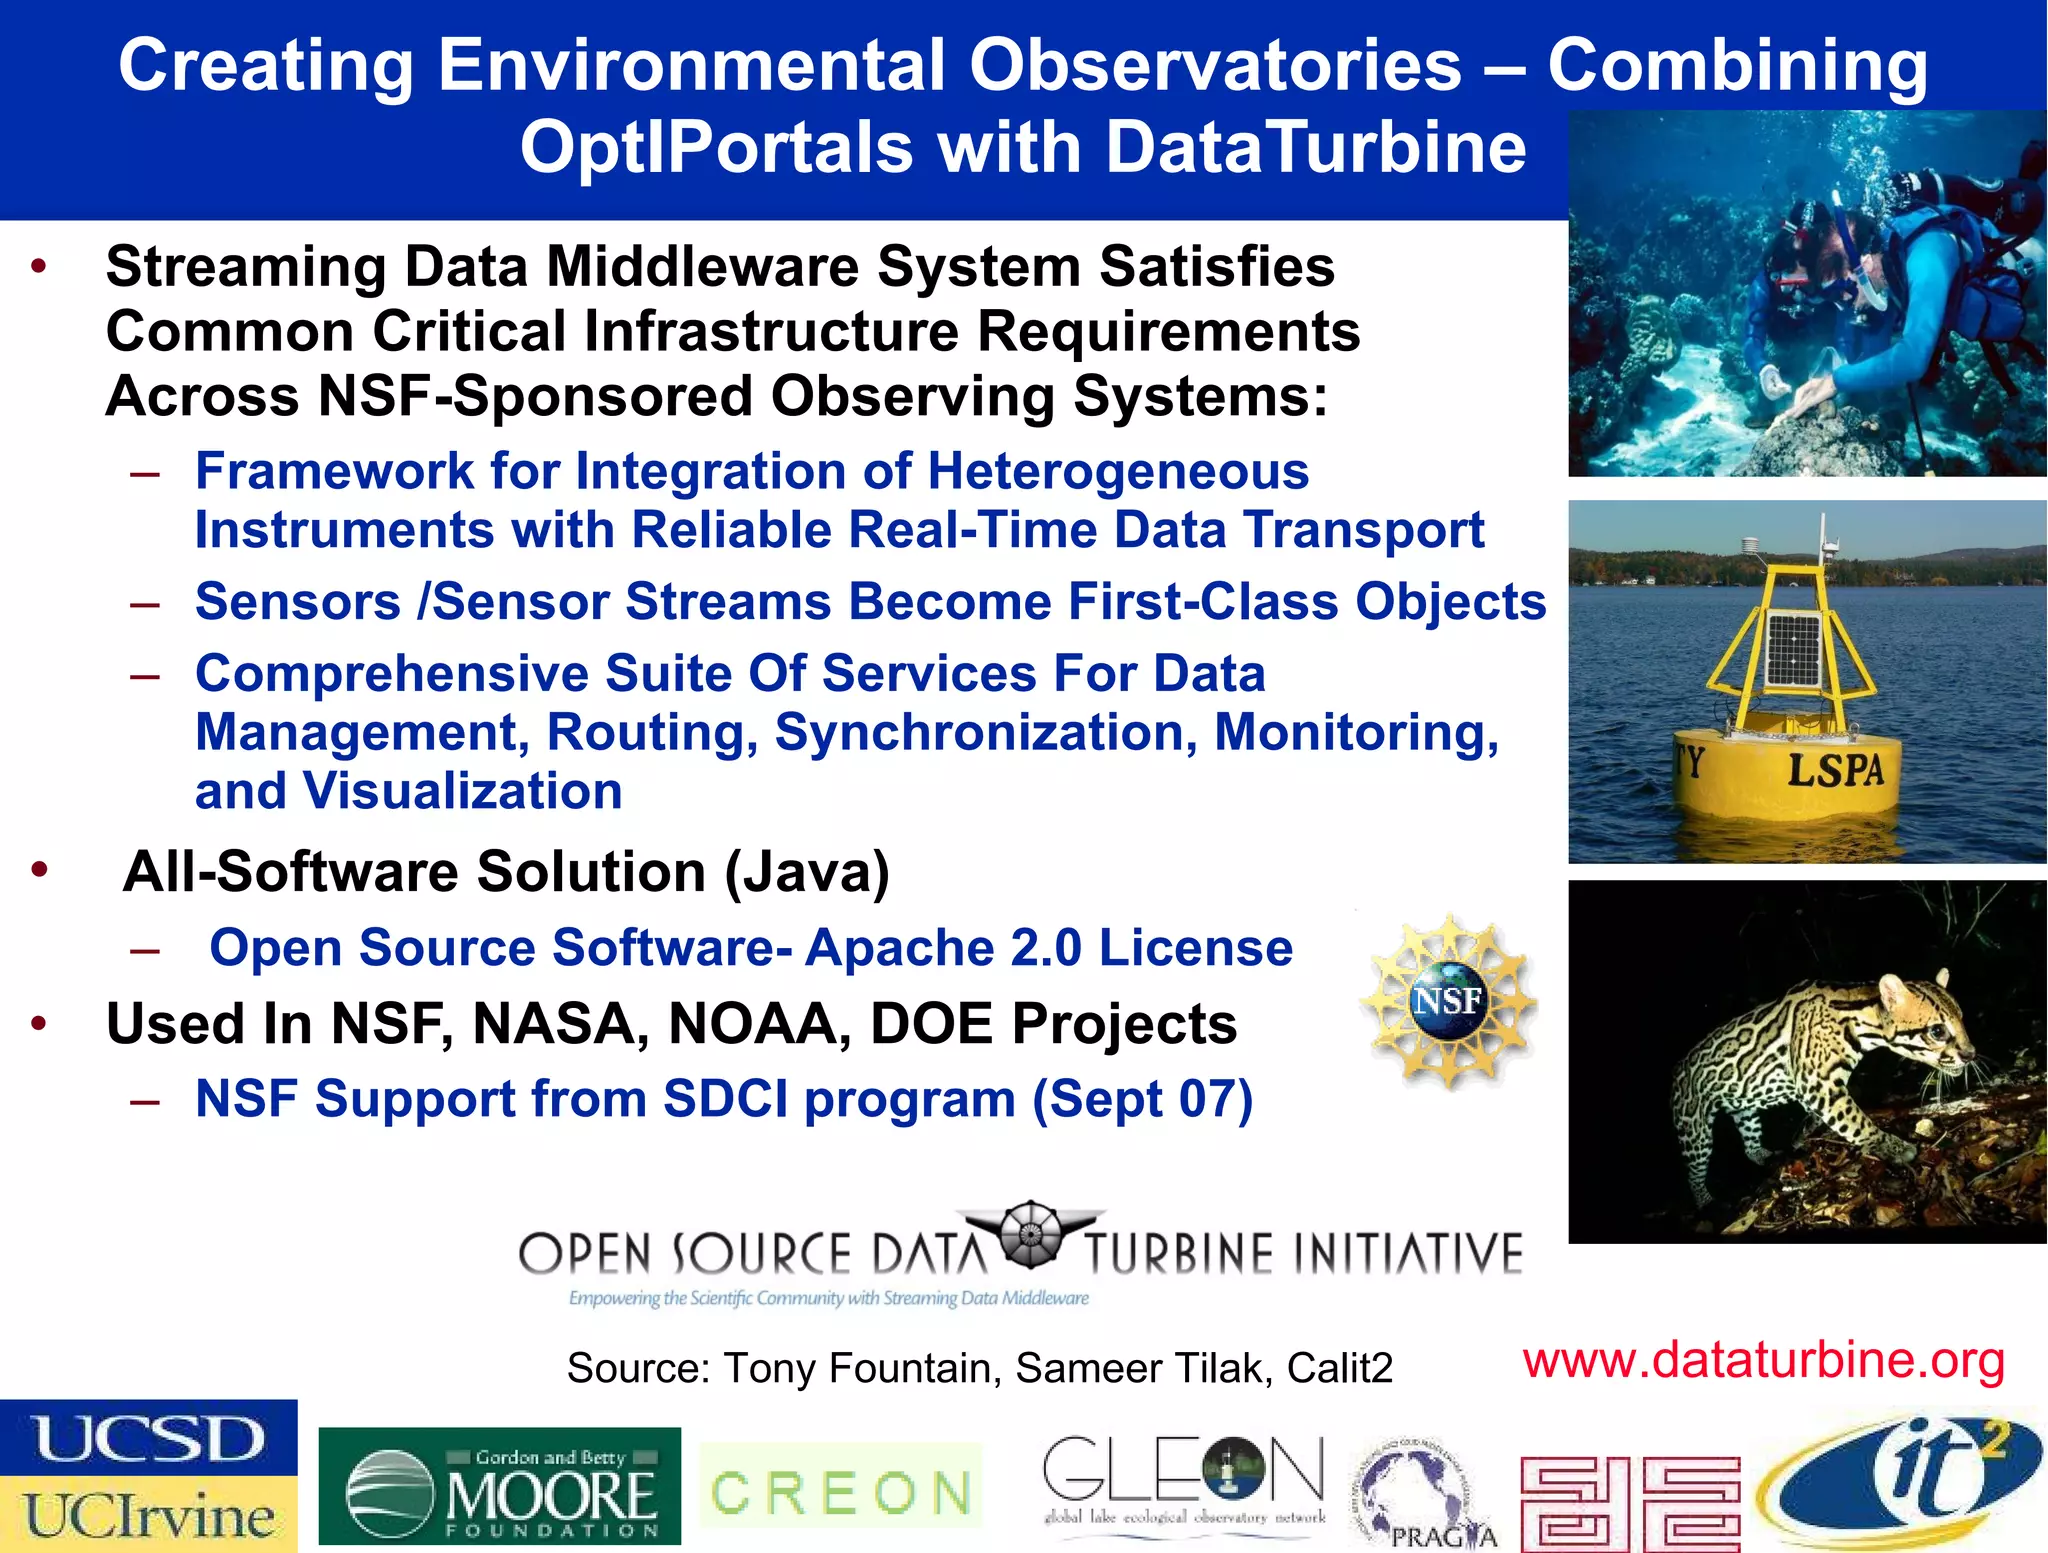
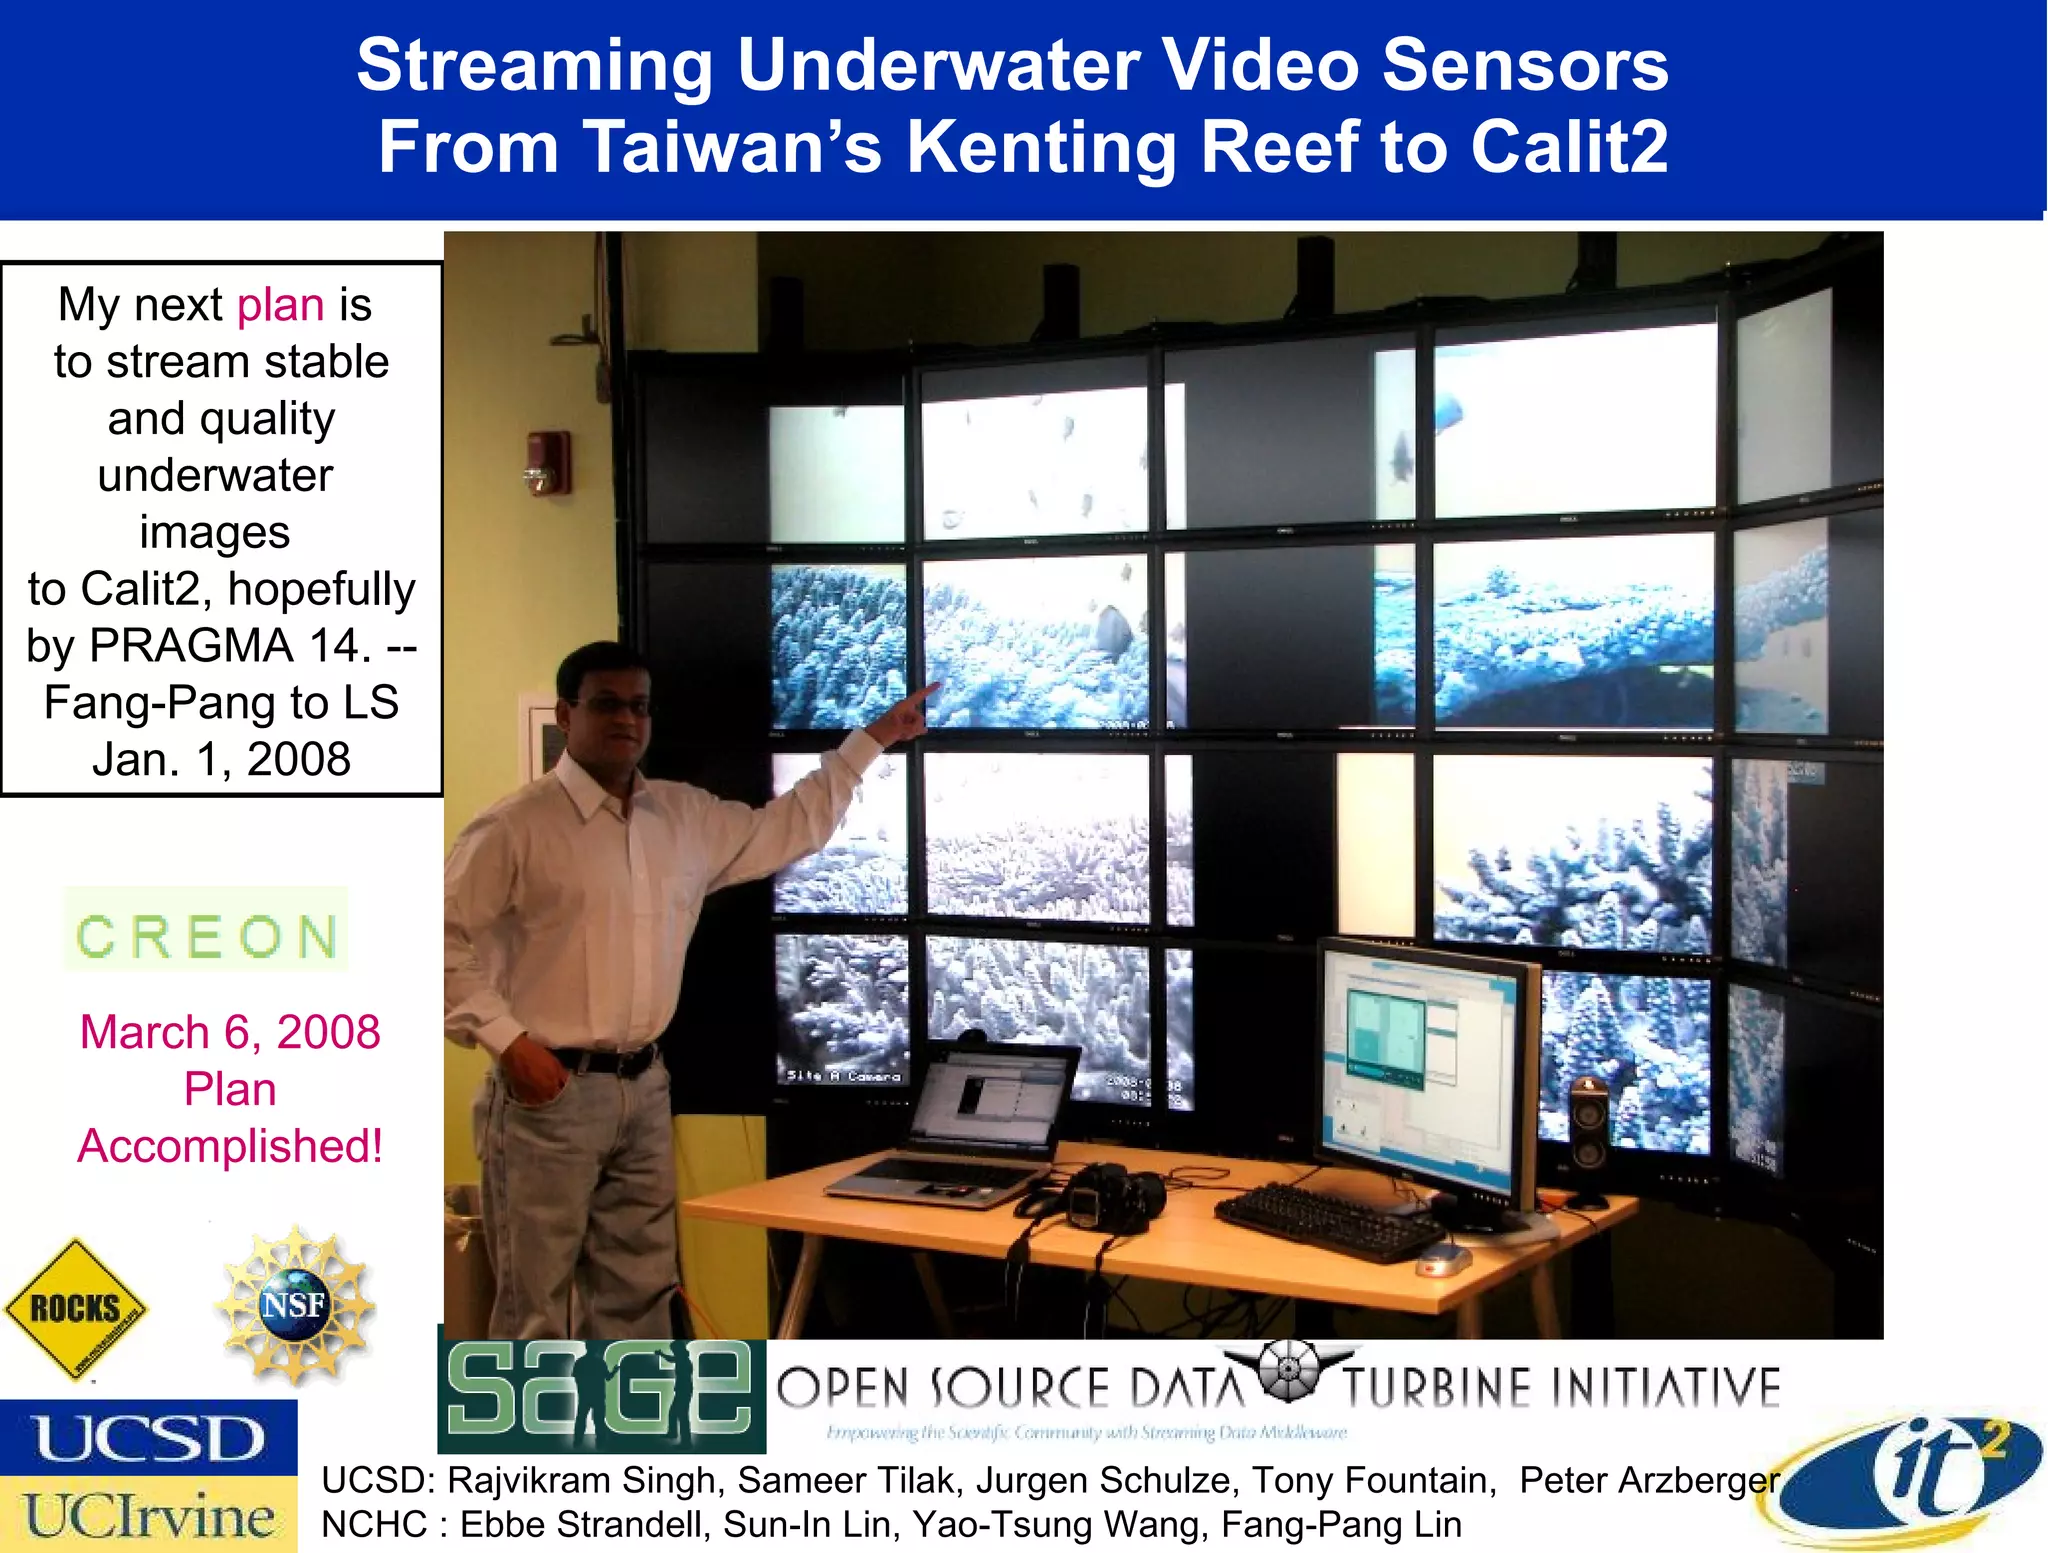
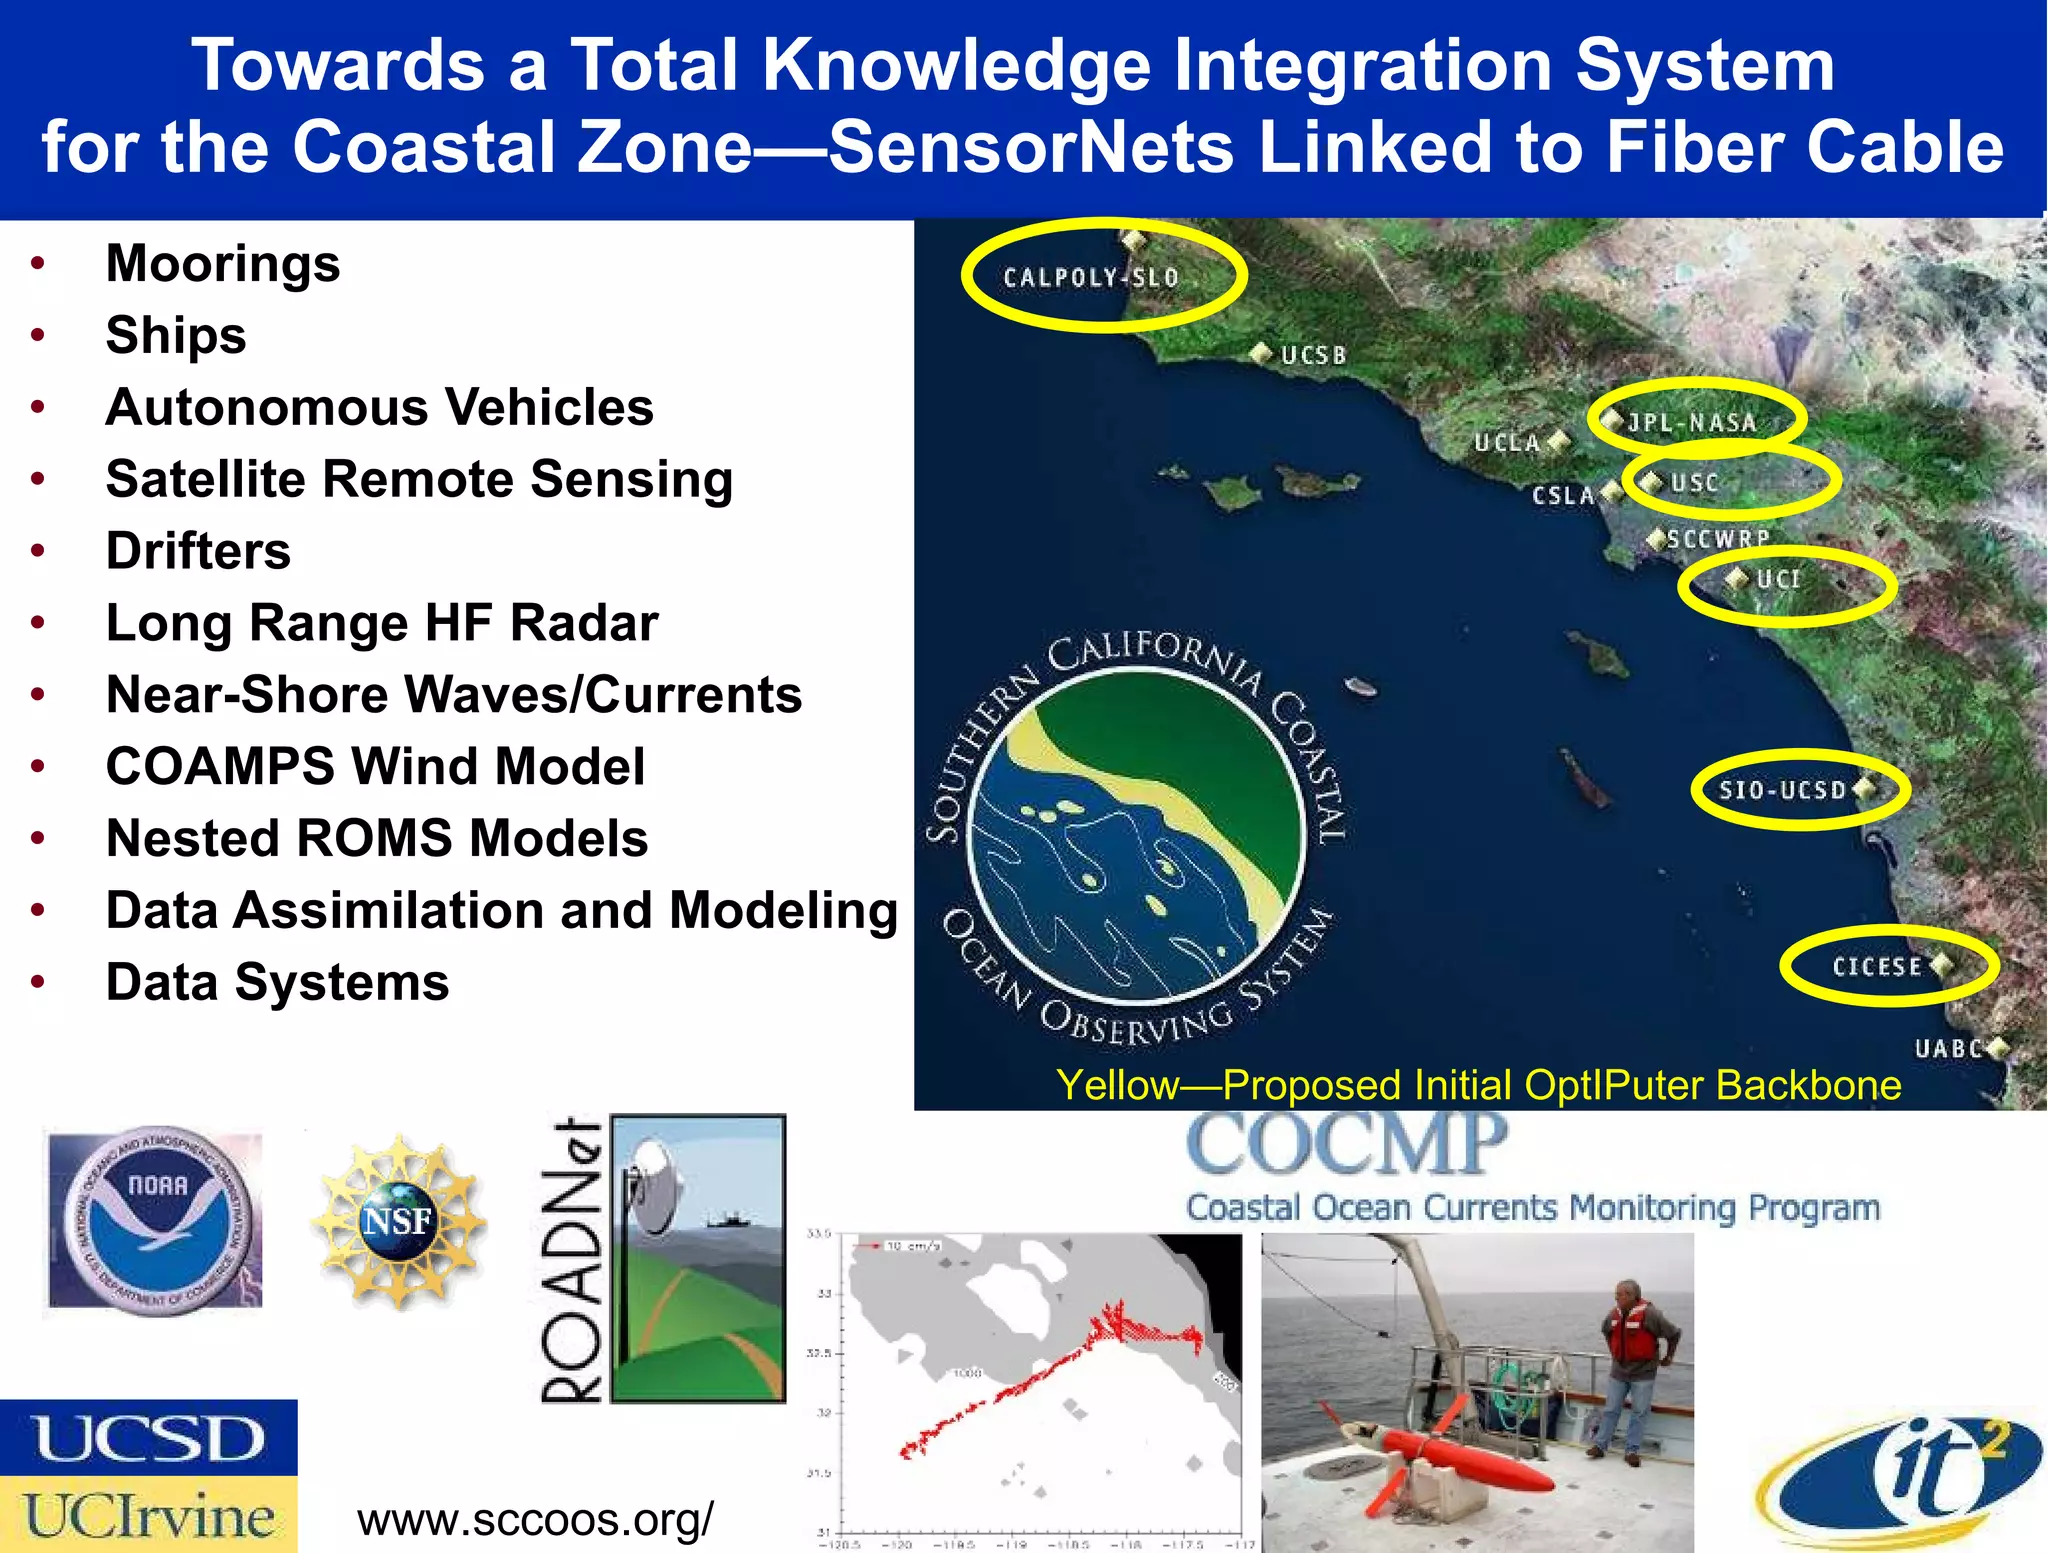
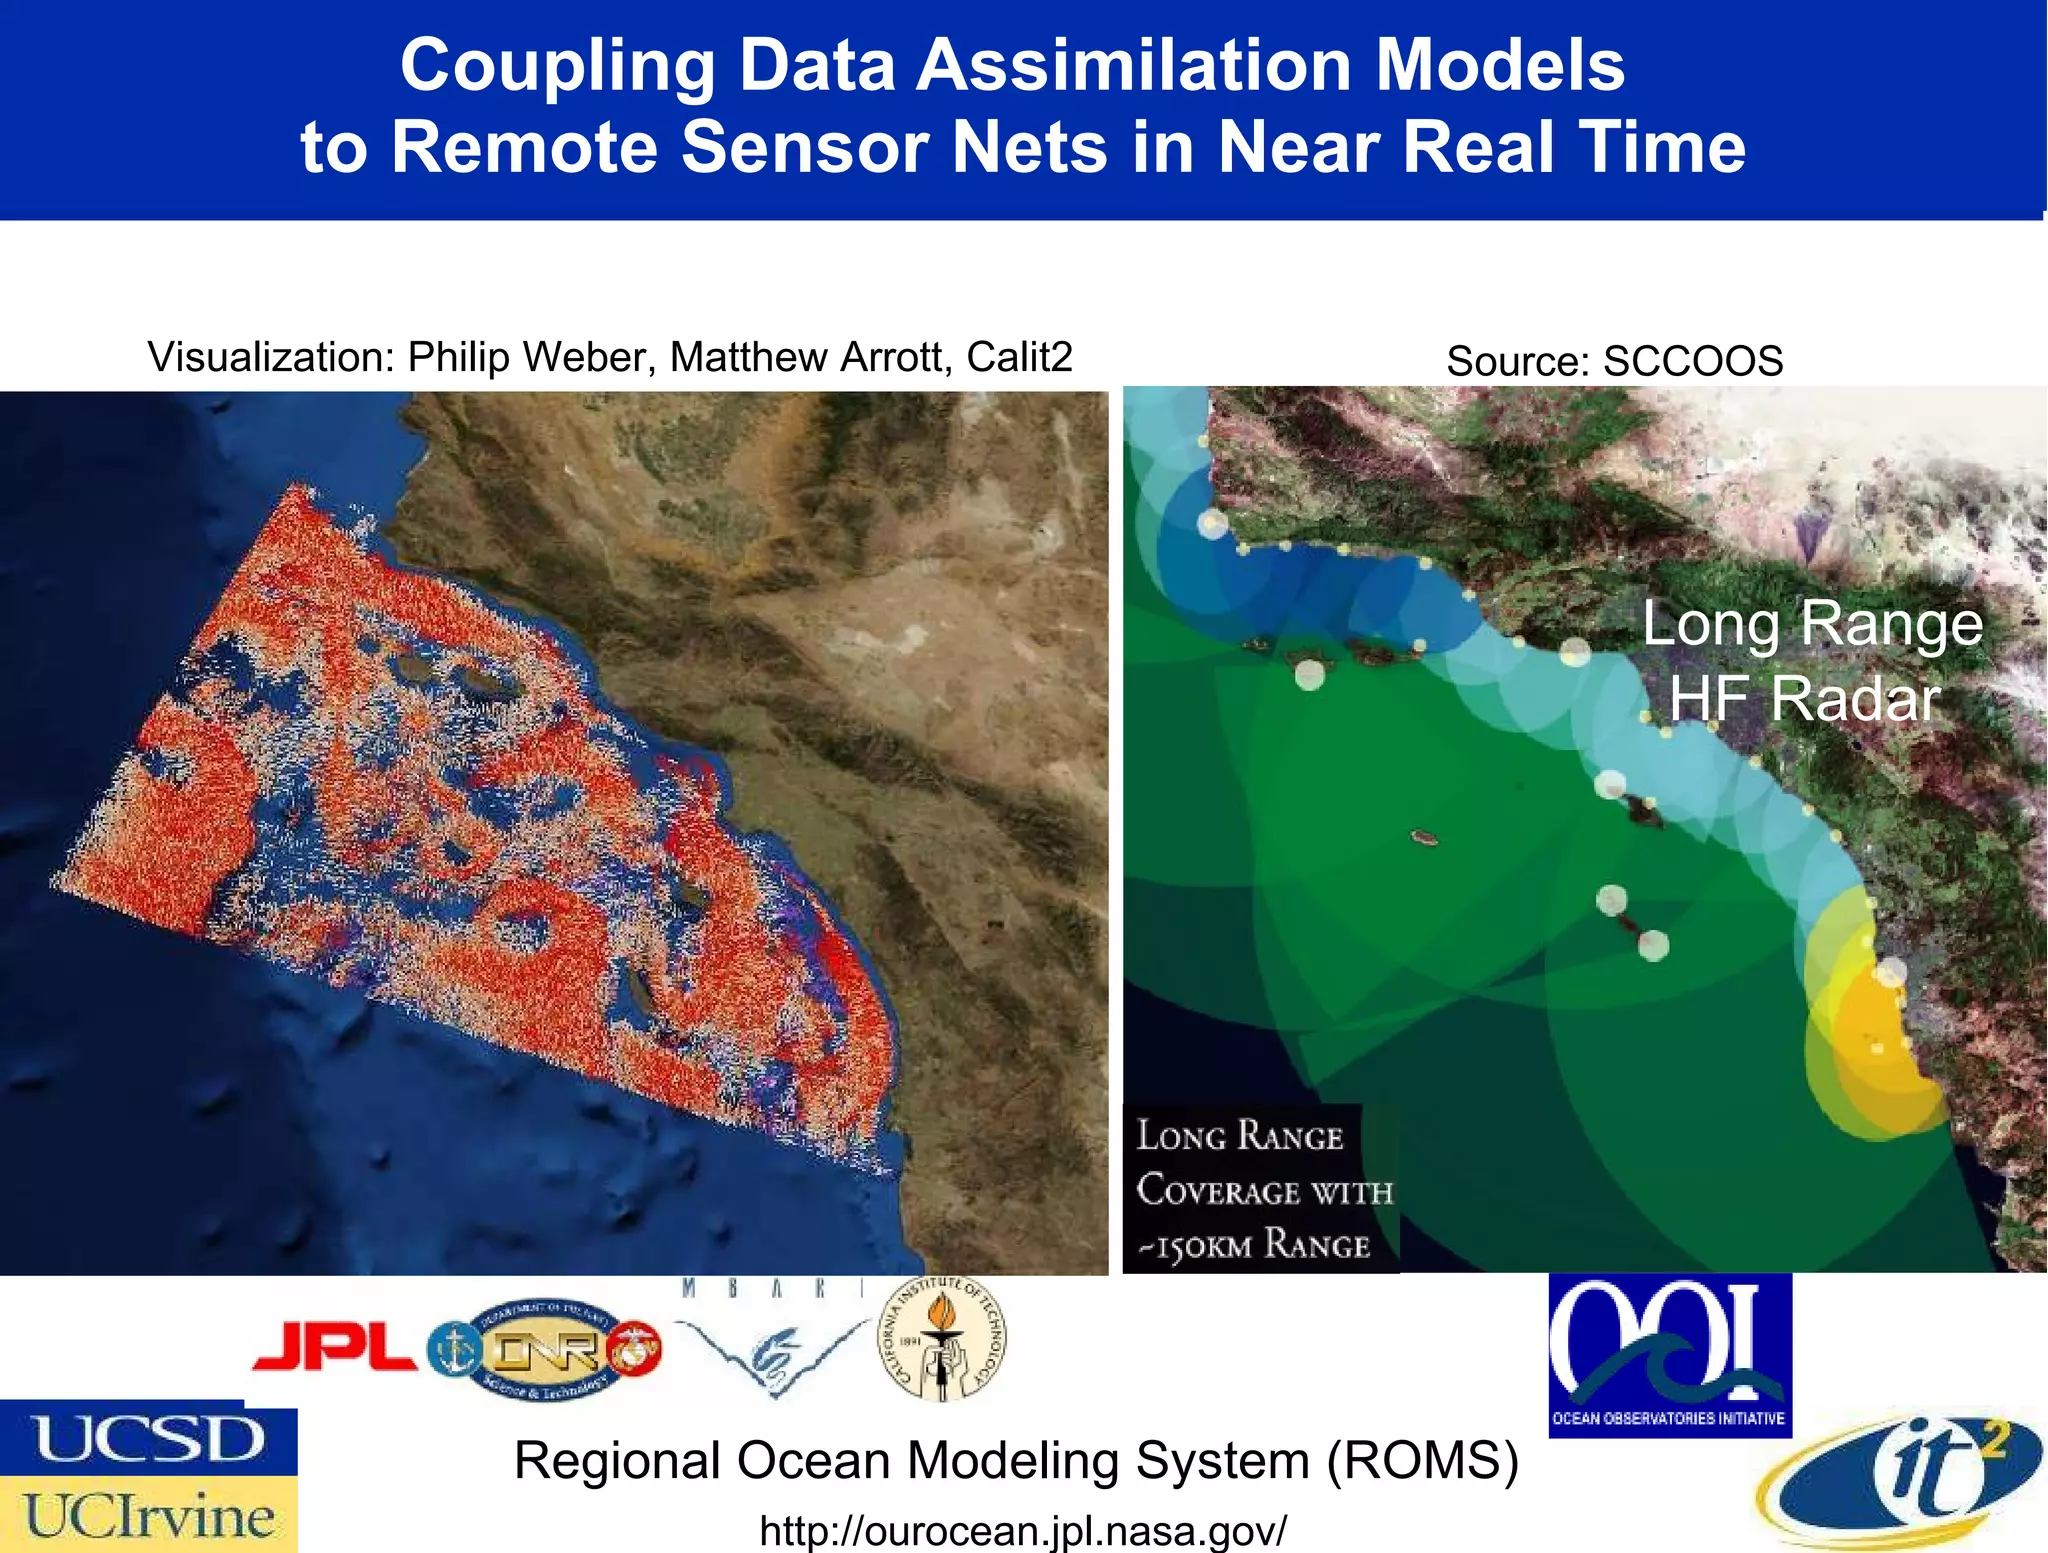
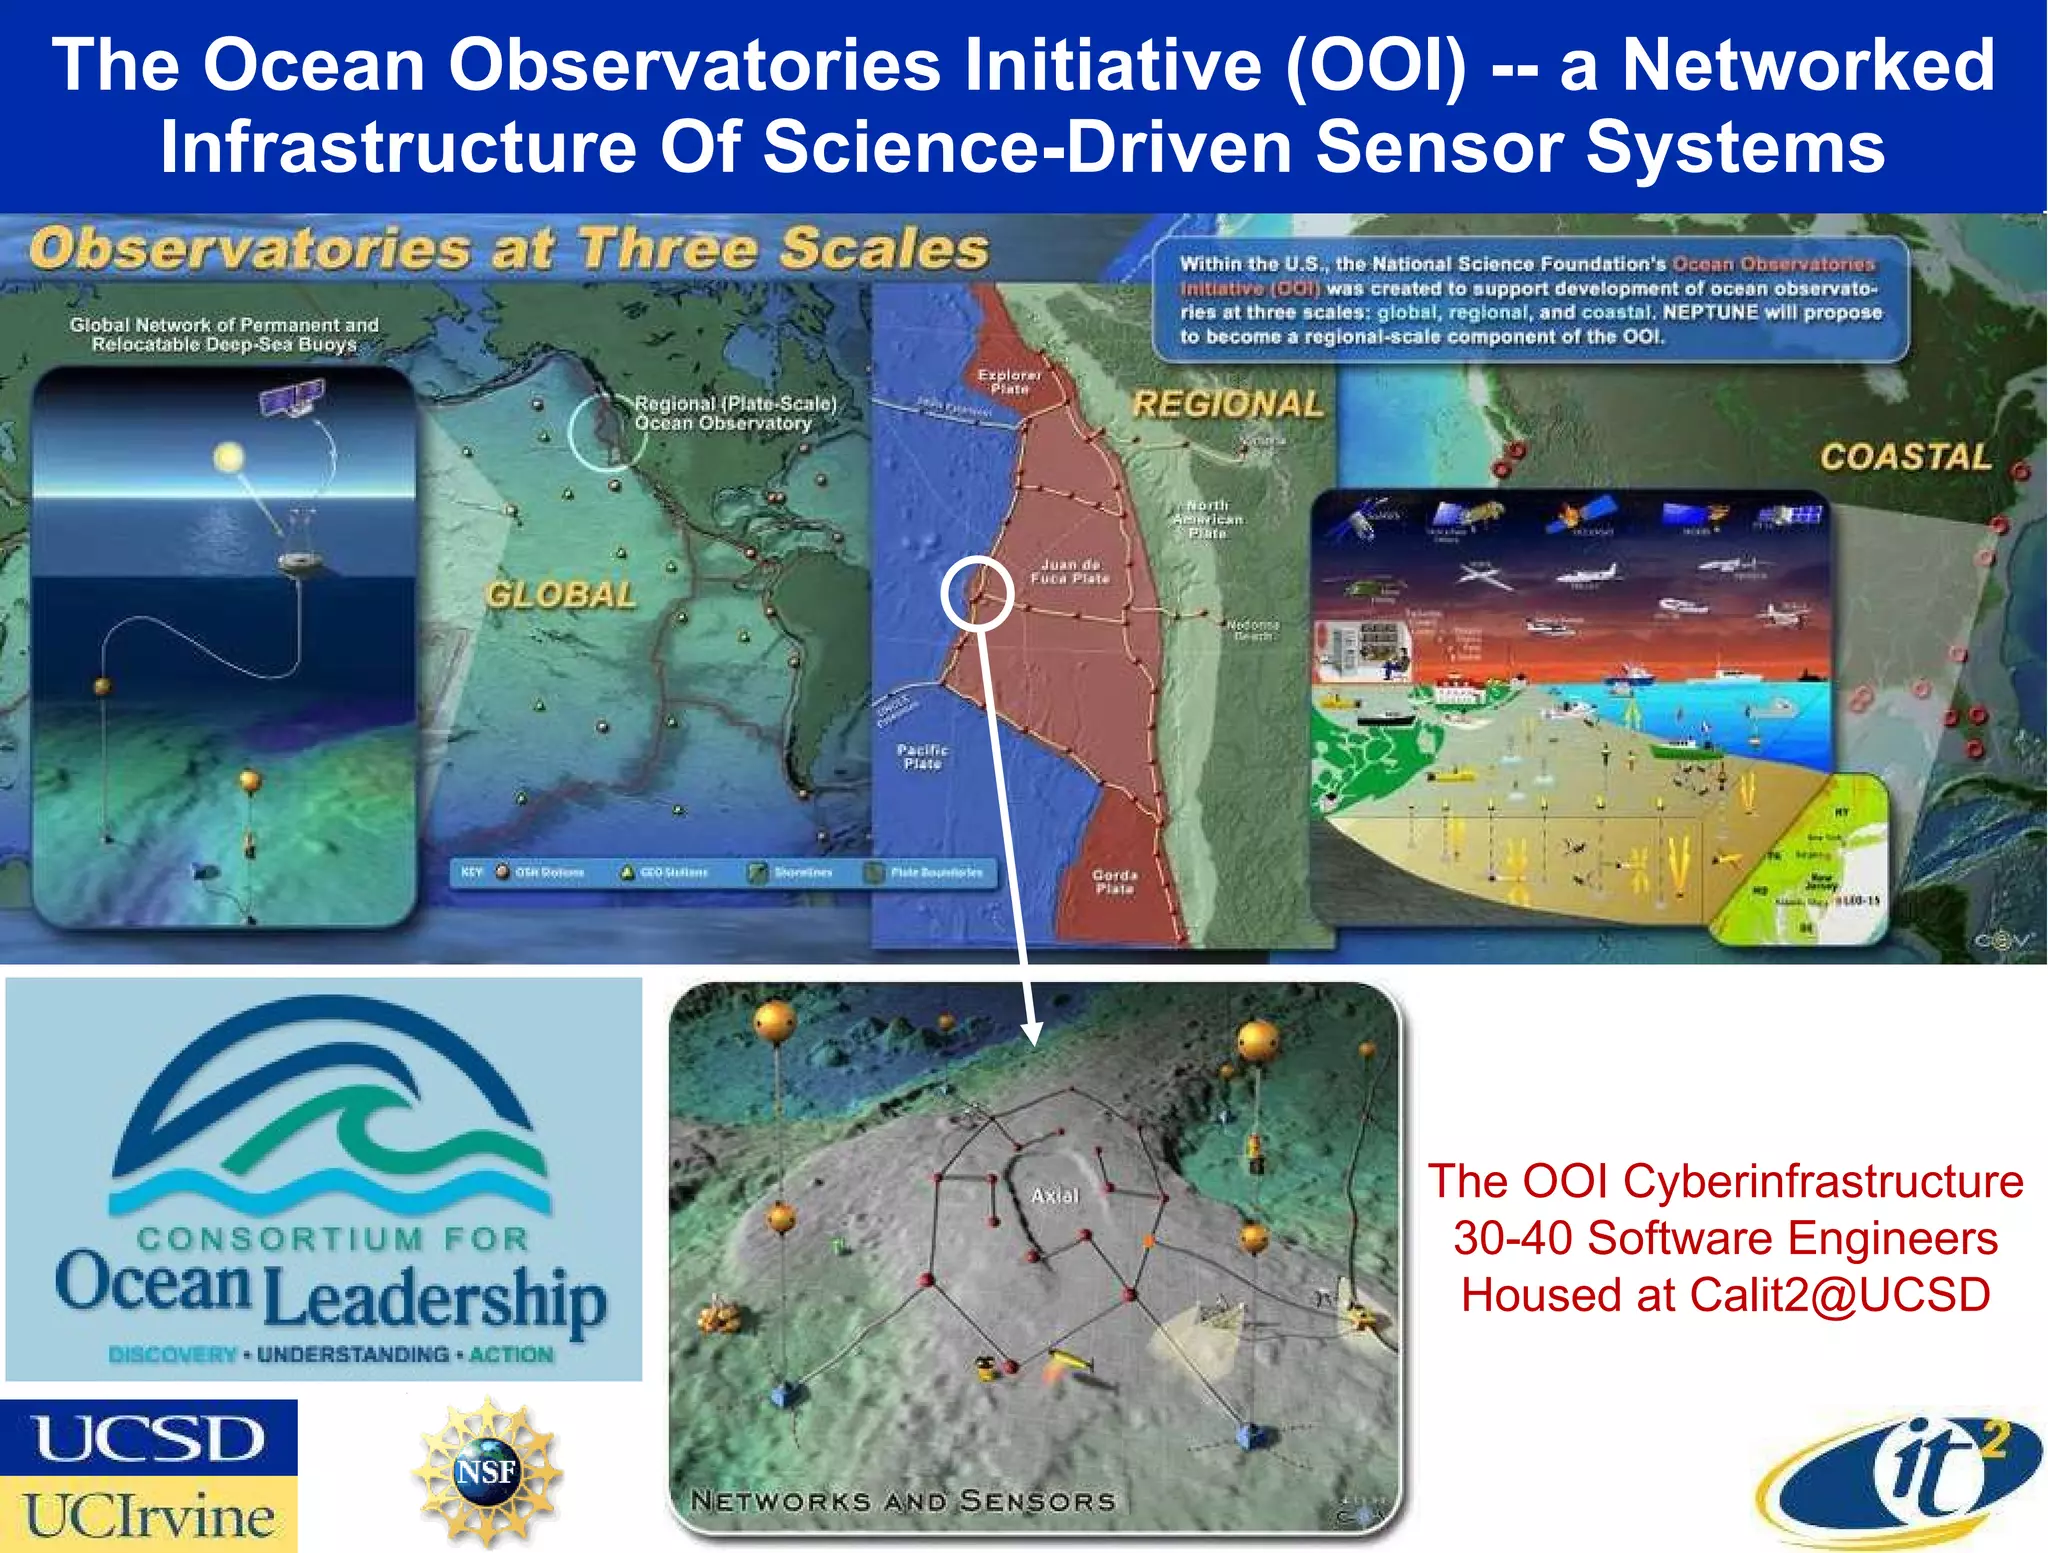
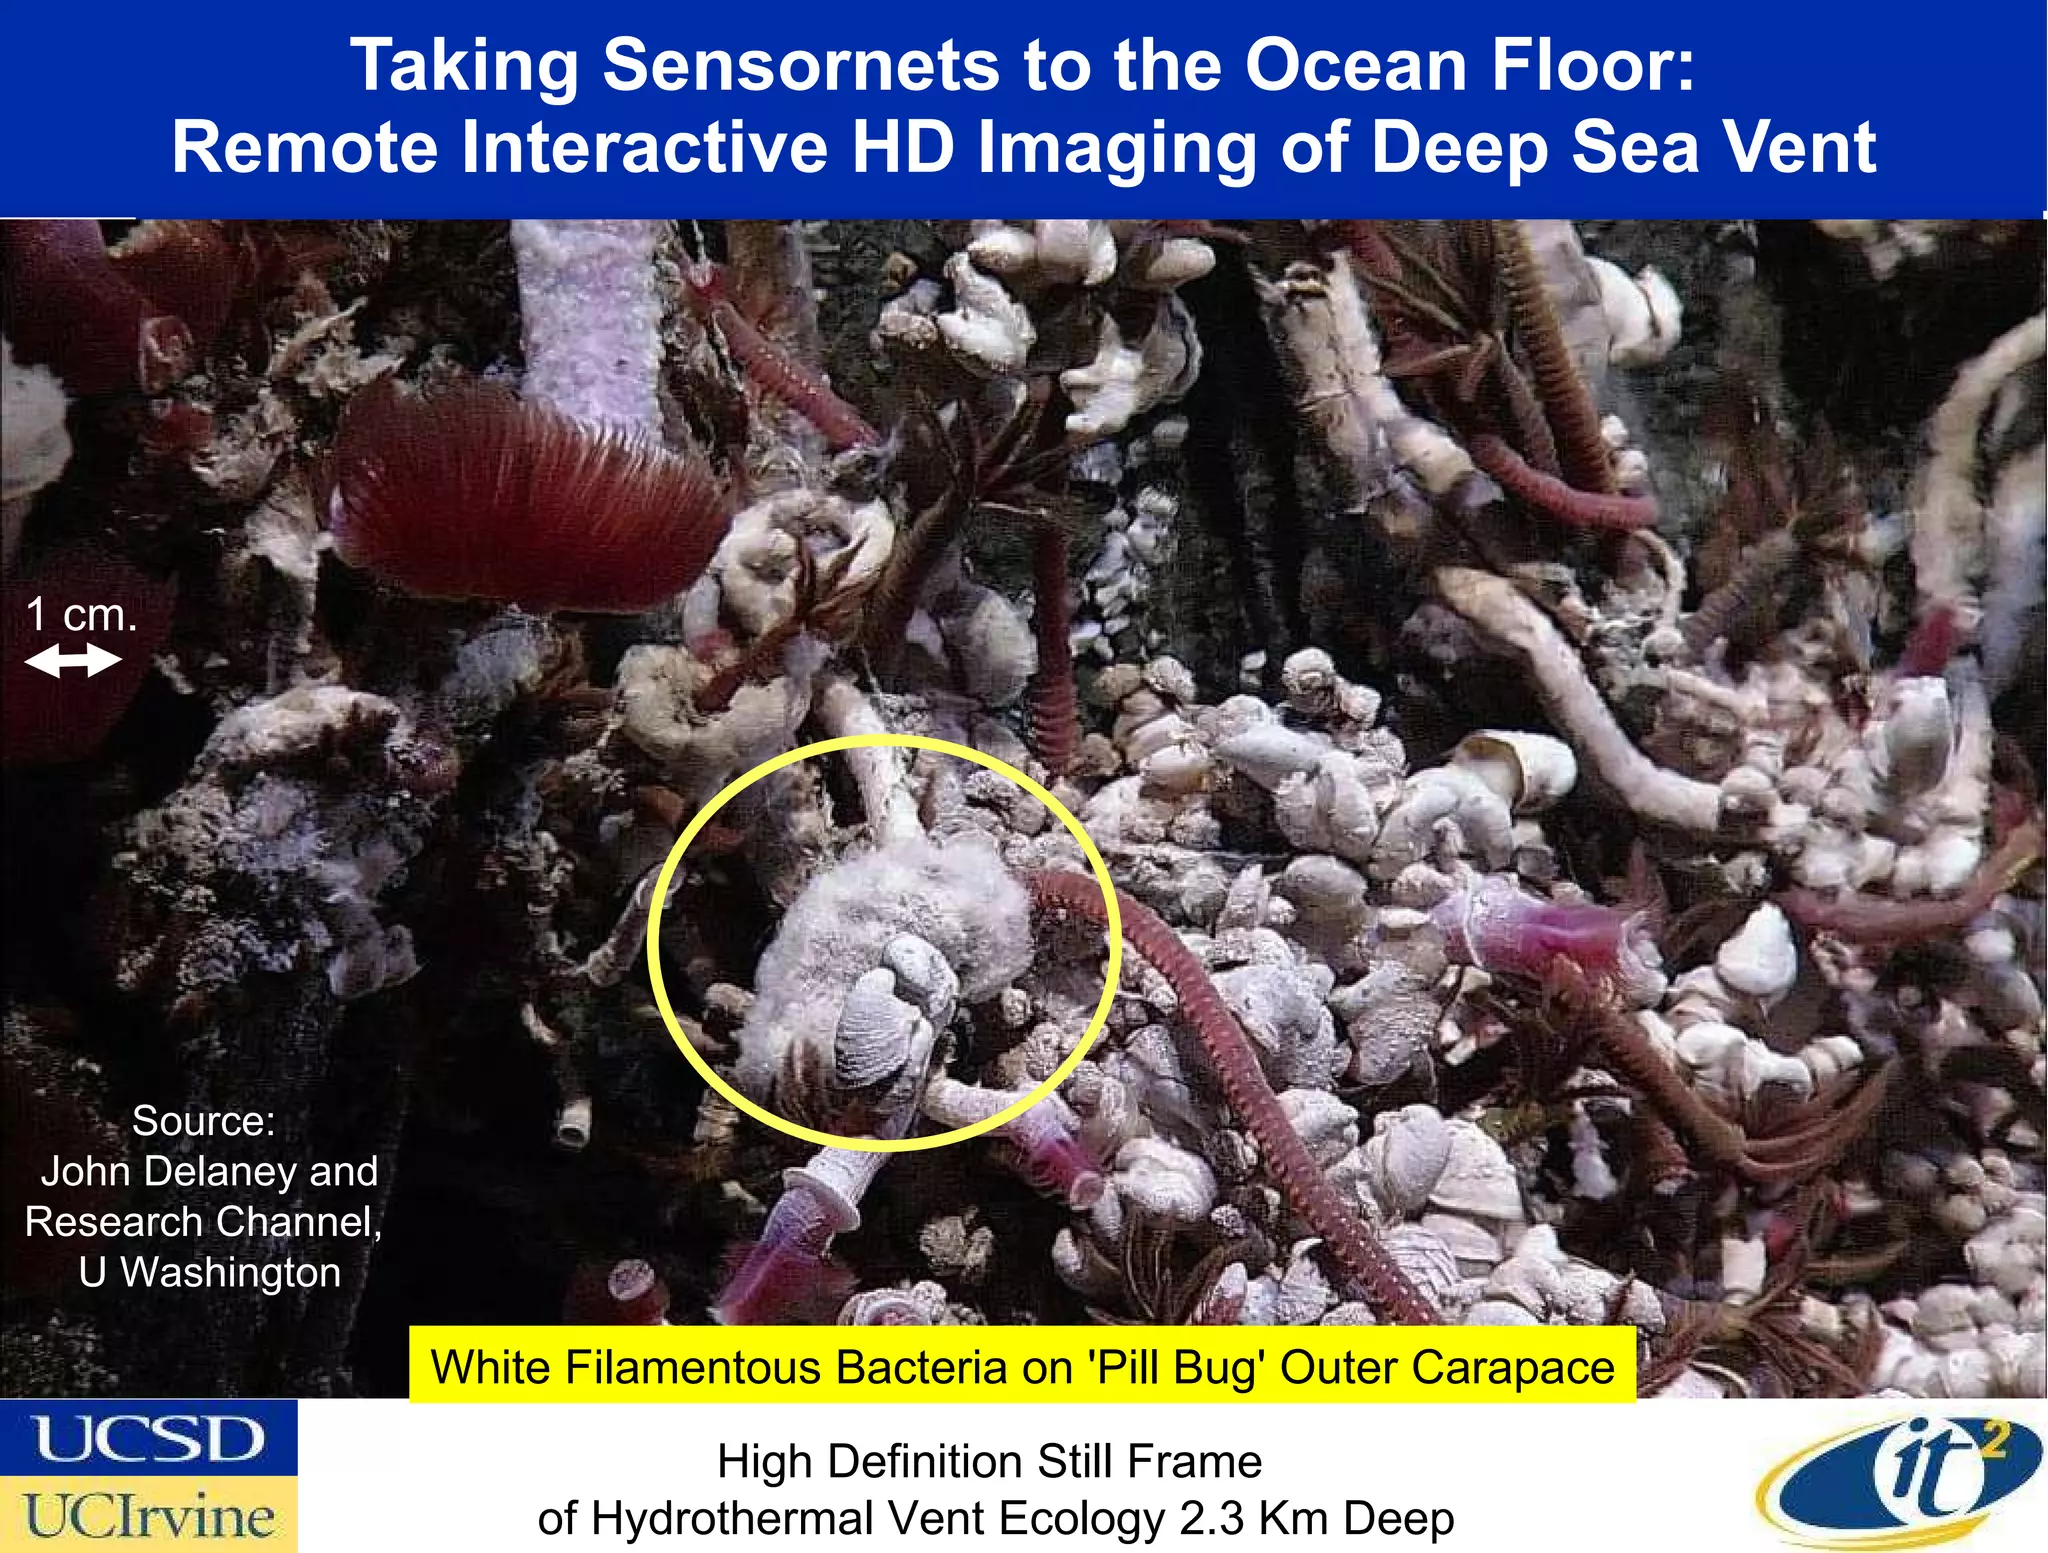

The document discusses the application of sensor networks ('sensornets') to enhance sustainability and respond to challenges posed by climate change, particularly in California. It highlights various sensing technologies used for real-time monitoring, wildfire detection, and building energy usage, emphasizing the integration of these systems for effective environmental management. The presentation showcases collaborations among institutions and technologies aimed at improving situational awareness during natural disasters like wildfires.