SlideShare a Scribd company logo
The SpaceForce One
Cody Foss∗, Colfax Putt†, Ernesto Ramirez‡, Yuhan Roh§, and Benjamin Ye¶
Purdue University, West Lafayette, IN, 47906
∗cfoss@purdue.edu
†cputt@purdue.edu
‡ramire80@purdue.edu
§rohy@purdue.edu
¶ye146@purdue.edu
Executive Summary
This document describes how the SpaceForce One aircraft was designed, built, and tested by the
SpaceForce team. Based on the constraints and limitations set forth by the customer in the request
for proposal (RFP), the team formulated a mission that involved carrying a 1.5 kg payload that
could travel 25 miles in 30 minutes or less. The contents of this payload may include blood samples,
medicine, or vaccines. The purpose of transporting these contents with a UAS is to help alleviate
the access barrier that many rural residents face when it comes to healthcare services. The focus
of the design was centered on a 3D printed, electric powered, remotely piloted fixed-wing aircraft
with vertical takeoff and landing (VTOL) capability. After plenty of research and a thorough
down-selecting process, the team determined that the best design for the SpaceForce One aircraft
was a flying wing tailsitter.
After selecting the aircraft concept, the SpaceForce team focused on the sizing of the UAS based on
historical data. The team knew that a lot of design aspects at this point were prone to change, but it
was necessary to complete this step to move onto the more critical aspects of the design, like the
propulsion system.
The propulsion system was established in the following order: (1) APC 15x10e propeller, (2)
Sunnysky 3525 520 KV brushless motor, (3) YEP 100 Amp electronic speed controller, and (4)
Turnigy 3000 mAh 4S 40c lithium polymer battery. These components were based on the power
required for a cruise, a thrust-to-weight ratio for VTOL, and the highest efficiency possible. The
final aircraft propulsion system consisted of 4 pairs of each of these components, for a total of four
thrust vectors.
When it came to the aerodynamic analysis, XFLR5 was used intensively. The chosen airfoil was the
MH106. The wing had a span of 1.79 m, with an aspect ratio of 4.71. Apart from the wing geometry,
other key parameters that resulted from this analysis were CLcruise = 0.35 and αcruise = 5 degrees,
where the desired cruise speed was 22.352 m/s. The stability of the aircraft was also analyzed in
XLFR5, where it was discovered that the SpaceForce One was naturally stable longitudinally, but
not in all of the lateral modes.
The structural skeleton of the aircraft initially contained a combination of 3D-printed and carbon
fiber parts. However, after structural testing, the 3D printed parts were replaced by aluminum and
more carbon fiber parts
Finally, the flight testing of the SpaceForce One aircraft consisted of three attempts, of which two of
them achieved flight. The two times that the aircraft was airborne, physical components came off,
which caused it to crash before transitioning from VTOL to cruise configuration.
Table of Contents
I Multiview of Assembled Aircraft 1
II Introduction 2
III Mission 2
III.A Mission Statement . . . . . . . . . . . . . . . . . . . . . . . . . . . . . . . 2
III.B Customers . . . . . . . . . . . . . . . . . . . . . . . . . . . . . . . . . . . 2
III.C Stakeholders . . . . . . . . . . . . . . . . . . . . . . . . . . . . . . . . . . 3
III.D Mission Profile . . . . . . . . . . . . . . . . . . . . . . . . . . . . . . . . 3
III.E Mission Requirements . . . . . . . . . . . . . . . . . . . . . . . . . . . . . 3
IV Concept Selection and Design 4
V Vehicle Sizing 6
VI Aerodynamics 8
VI.A Wing Design . . . . . . . . . . . . . . . . . . . . . . . . . . . . . . . . . . 8
VI.B Aerodynamic Performance . . . . . . . . . . . . . . . . . . . . . . . . . . 9
VII Stability 11
VII.A CG and NP Location . . . . . . . . . . . . . . . . . . . . . . . . . . . . . . 11
VII.B Longitudinal Static Stability . . . . . . . . . . . . . . . . . . . . . . . . . . 12
VII.C Lateral Static Stability . . . . . . . . . . . . . . . . . . . . . . . . . . . . . 13
VII.D Control Surface Sizing . . . . . . . . . . . . . . . . . . . . . . . . . . . . . 14
VIII Structures 15
VIII.A Internal Structure . . . . . . . . . . . . . . . . . . . . . . . . . . . . . . . 15
VIII.B Structural Limits . . . . . . . . . . . . . . . . . . . . . . . . . . . . . . . . 15
VIII.C Torsional Analysis . . . . . . . . . . . . . . . . . . . . . . . . . . . . . . . 16
VIII.D Skin Thickness Approximations . . . . . . . . . . . . . . . . . . . . . . . . . 17
VIII.E Wing Tip Deflection . . . . . . . . . . . . . . . . . . . . . . . . . . . . . . . 17
IX Propulsion 18
X Performance Results 22
X.A Structures and Propulsion Testing . . . . . . . . . . . . . . . . . . . . . . . 22
X.B Flight Test . . . . . . . . . . . . . . . . . . . . . . . . . . . . . . . . . . . 22
XI Conclusion 24
I. Multiview of Assembled Aircraft
The final design of the aircraft can be seen in Figures 1 and 2 below. As seen in Figure 1, the
aircraft was designed using CATIA software, and the outer parts were made transparent to show the
internal structure in the assembly. Figure 2 shows a beautiful picture of the SpaceForce One after
completion and just before its maiden flight.
Figure 1: Multiview of the SpaceForce One Aircraft CAD Model
Figure 2: Photograph of the Completed Aircraft
1
II. Introduction
Today, unmanned aerial systems (UAS) are used for a variety of applications ranging from agriculture
to combat. The rise of UAS also comes at a time where 3D printing capabilities are growing rapidly.
The intersection of these two modern technologies yields an interesting opportunity. Implementing
3D-printing into aircraft manufacturing increases the capability for customization and overall
construction efficiency. The SpaceForce One aircraft was designed as a 3D-printed UAS with the
intent to take advantage of this technology and to help people in rural areas who have limited access
to healthcare services.
III. Mission
A. Mission Statement
When it comes to healthcare services, residents of rural areas in the United States face a variety
of access barriers. Healthcare facilities in rural areas are small and often provide limited services.
Rural residents have to travel greater distances to access specific services. SpaceForce is making an
effort to solve this problem by building an electric powered, remotely piloted fixed-wing aircraft
that can transport medical items to and from rural healthcare facilities inside a 1.5 kg payload box.
Initially, the aircraft will focus on transporting blood samples, medicine, and vaccines.
B. Customers
The American Red Cross
This organization has agreed to purchase aircraft produced by SpaceForce to provide healthcare
services to underprivileged remote communities across the United States.
Indiana Hospital Association
This organization represents more than 170 hospitals in the state of Indiana. IHA has agreed to
purchase aircraft produced by SpaceForce to further integrate this network of hospitals in Indiana.
Other
SpaceForce plans to expand to other rural areas in the US by the end of 2019. By the end of 2020,
SpaceForce wants to be able to make an impact at the international level. To accomplish this, more
improvements have to be made in terms of aircraft performance and the cost of production.
2
C. Stakeholders
Stakeholders are defined as the people, groups, or organizations that are actively involved or directly
affected by the success or failure of this project. The stakeholders of this project are:
Hospitals - They will be the ones directly using or operating the aircraft.
Patients - They are affected by the proper operation of the aircraft system, since they rely on
the aid that the aircraft system delivers. The failure of this system may result in negative health
consequences to this stakeholder.
Residents of the Operating Environment - It cannot be assumed that the aircraft will always be
operating in an open field or uninhabited settings such as the environment the aircraft will be tested.
The aircraft may be operated in a densely populated setting, and therefore the surrounding people
and properties must be taken into account as well. Failure of the system to operate properly may
result in the injury of residents or the damage of property in the operational settings.
D. Mission Profile
The mission profile of this aircraft includes a vertical takeoff up to a 15 meter height, transition to a
fixed-wing configuration, climb to an altitude of about 61 meters (200 ft), cruise, descent to a height
of 15 meters, transition back to the VTOL configuration, and land vertically in a circular area with a
3 meter diameter. The profile is represented graphically by Figure 3 below.
Figure 3: Graphical Representation the Mission Profile
E. Mission Requirements
The SpaceForce team noted the needs that the RFP document outlined and considered those needs in
reference to each stakeholder, in order to derive a list of requirements as shown in Table 1. They are
broken up into three categories and are given a unique name. There is also a column that provides
the technical areas through which each requirement will be verified.
3
Table 1: SpaceForce One Requirements
Category Name Description Verification
REQ-PF-01
The aircraft must be able to take off and land on a circular
area with a 3 meter diameter.
Flight Test
REQ-PF-02
The aircraft must be able to clear a 15 meter height during
takeoff and landing.
Flight Test
REQ-PF-03
The aircraft must be able to safely carry a 1.5 kg rectangular
payload with dimensions 100mm x 50mm x 20mm.
Propulsion, Structures,
Flight Test
Performance
REQ-PF-04
The aircraft shall cruise at a speed of at least 50 mph and
an altitude of at least 200 feet.
Propulsion, Structures,
Aerodynamics, Flight Test
REQ-PH-01 The aircraft shall be 3D additive manufactured. Structures
REQ-PH-02 The aircraft’s wingspan must be less than six feet.
Structures,
Aerodynamics
REQ-PH-03 The entire propulsion system must be electric. Propulsion
REQ-PH-04
The aircraft must be able to be assembled and prepared for
flight within 10 minutes.
Flight Test
Physical
REQ-PH-05
Modular parts must be easily accessible for replacement or
maintenance.
Structures
REQ-SW-01
The aircraft must be able to complete missions autonomously
using waypoints loaded to a PixHawk flight controller.
Dynamics and Controls,
Flight Test
REQ-SW-02
The flight controller must be able to switch between pilot and
autopilot modes.
Dynamics and Controls,
Flight Test
REQ-SW-03
The flight controller must be able to easily transition from a
VTOL configuration to a fixed-wing configuration.
Dynamics and Controls,
Flight Test
Software
REQ-SW-04
The aircraft must be able to provide the operating pilot/team
with telemetry data.
Dynamics and Controls,
Flight Test
IV. Concept Selection and Design
The SpaceForce team developed eight total concepts during the initial brainstorming sessions. These
concepts were put through the Pugh’s method with the intent to narrow the selection process down.
The eight concepts were judged by the team based on nine different criteria to select the top four
concepts for further consideration. These four concepts can be seen in Figure 4.
4
Figure 4: Quad-Rotor with a Front Propeller (Top-Left), Dual-Propeller Flying Wing (Top-Right),
Tri-Rotor with Two Tilt propellers (Bottom-Left), Wing Quad-Rotor (Bottom-Right)
The four concepts seen in Figure 4 were further analyzed in a weighted decision matrix. The
SpaceForce team took time to set up a process to ensure the final concept selected was objectively
the best choice. The importance and value of each criterion were quantified for the weighted
decision matrix using the method illustrated in Figure 5.
Figure 5: Weighted Decision Matrix Weight and Rating Method
The highest scoring concept, and subsequently the concept selected, in the weighted decision matrix
was the flying wing tail sitter (the top-right design in Figure 4). Though, it should be noted that
the SpaceForce team went through multiple design iterations between this concept and the final
product, which means that at this stage of the design process, the aforementioned model does not
accurately represent the final design.
Based on the decision matrix and preliminary analysis of the flying wing design, a few strengths
and potential problems were noted by the SpaceForce team. The strengths were determined to be:
low part count, low number of control inputs, and relatively low mass fraction. Some potential
5
problems noticed in the design were: stability, transition viability, structural integration/reliability,
and landing gear integration. With all this in mind and a concept selected, the SpaceForce team
moved on to the sizing of the aircraft.
V. Vehicle Sizing
Sizing of the SpaceForce One was initially done through the use of historical data and a constraint
analysis. Figure 6 shows the constraint graph for the SpaceForce One. This marked the starting
point to the aircraft’s limitations, which were iterated upon later in the design process.
Figure 6: Early Developed Constraints Graph
As can be seen in Figure 6, SpaceForce compared wing loading and power loading. For the plane to
function properly, it has to be able to handle both wing loading and power loading values in the
yellow area of the graph. Further analysis of this graph shows that the constraining features of this
plane are the loads during takeoffs, turns, and climb. Although, in later analysis, it was determined
that this plane would have to handle even higher power loading values due to support its weight in
vertical takeoff and landing.
The weight sizing and mass fraction determinations were completed through the analysis of historical
data and the interpolation of that data. From the historical data collected, a graph was created to
further the effectiveness of the analysis [1–6]. This graph can be seen in Figure 7.
6
Figure 7: Graph used to Determine Initial Sizing
From Figure 7 the payload mass fraction of the plane was determined by interpolating between the
range of values found in the historical data to the range dictated by the RFP (25 mi). The result of
this interpolation can be seen displayed as a red dot and line in Figure 7. From this process, it was
determined that the overall mass of the vehicle would be about 7.5 kg. Likewise, the battery mass
fraction was determined to be 0.121, the empty mass fraction was determined to be 0.679, and the
wing area and aspect ratio were 0.343 m2 and 9.7, respectively. Further initial size values are given
in Table 2.
Table 2: Initially Developed Physical Values
Property Description
Wingspan 1.8288 m (6 ft)
Wing Area 0.343 m
Aspect Ratio 9.73
Center Pod Diameter 0.25 m
Wing Control Surfaces Elevons
Payload Mounted at CG
Pod Contents Fixed with Dual-Lock Strips
The values in Table 2 were determined from a combination of historical data and analysis and
changed throughout the design process. These values were not final and were an initial estimation
based on the resources that were available. These values were used to further develop a working
and conservative design. The final mass of the constructed design ended up being 6.5 kg with no
payload and 8.0 kg with a 1.5 kg payload.
7
VI. Aerodynamics
A. Wing Design
For the wing design, taper was decided against because the aircraft did not need to produce a very
high CL during cruise, and induced drag was not a major concern. Additionally, the wing was
produced in segments because of the 3D printer size, which meant that if the wing was tapered, a lot
more unique segments would need to be designed just for the purpose of printing them. Dihedral
was also not implemented in the wing design because of the roll moment that could be created from
sideslip, even though dihedral could provide extra stability.
The team initially considered a twisted swept wing with a high lift airfoil. However, it was discovered
(based on the Northrop YB49 [7]) that critical problems appear with twisted swept wings. A large
amount of twist was required to stabilize the wing because high-cambered airfoils are inefficient at
generating negative lift. Approximately 12 degrees of twist angle with a sweep of more than 35
degrees was required. This pointed at a potential loss of stability in the presence of propeller wash
with high stall speeds. Therefore, a null pitching moment airfoil with a larger chord was a better
choice.
The chosen airfoil design was the MH106. The primary criteria for the airfoil selection was max
Cl/Cd because (Cl/Cd)2 needed to be as high as possible to reach the maximum range. The
maximum Cl/Cd depended on the Reynolds number. Using a cruise airspeed of 22.53 m/s, 10
degrees Celsius air, and a chord width of 0.3 meters, the Reynolds number was calculated to be
around 475,000 according to an equation:
Re =
ρvl
µ
(1)
With the help of airfoil tools.com [8], the UIUC airfoil database was searched to find the airfoild
with the largest Cl/Cd at a Reynolds number of 500,000. With SpaceForce’s configuration, camber
could cause drifting during hover. Therefore, a maximum camber of one degree was considered in
order to minimize such effect. The MH106 was selected as an airfoil because it was the only null
pitching moment airfoil under one degree of camber with the largest Cl/Cd at a Reynolds number
of 500,000. With MH106 airfoil, the wing sweep became irrelevant for its stability. However, a
25-degree sweep allowed for a longer center pod and a more flexible center of gravity adjustment.
Although the wing was swept, any wing section parallel to the center-line of the aircraft was a
non-distorted MH106 airfoil.
8
B. Aerodynamic Performance
Figures 8, 9, and 10 demonstrated that the maximum Cl/Cd for the MH106 airfoil occurred at an
angle of attack of 5 degrees. This required a wing area of 0.698 m2 and a 0.388 m chord to cruise at
22.53 m/s, according to equations:
L =
1
2
ρV2
Cl S (2)
and
S = cB (3)
The drag for the wing was calculated to be 4.2 N according to the Cd drag equation:
D =
1
2
ρV2
CdS (4)
The center pod was an ellipsoid with a reference area of 0.05 m2 and a Cd of 0.06. The landing gear
consisted of carbon plates with 20% reference area of the main wing and a Cd of 0.02. The total
drag of the plane was calculated to be 5.44 N during cruise. Figure 9 demonstrated the maximum
Cl of 1.17 at an angle of attack of 18.5 degrees which yielded at a stall speed of 13 m/s. Figure 9
showed that the wing was stable in the pitch axis.
Figure 8: (Cl/Cd) Vs Alpha
9
Figure 9: Cl Vs Alpha
Figure 10: Cl Vs Cd
10
The final wing characteristics and performance are summarized by Table 3 below.
Table 3: Final Wing Characteristics
VII. Stability
A. CG and NP Location
Two different methods were used to determine the center of gravity (CG) and neutral point (NP) of
the SpaceForce One, with respect to the datum at the nose of the aircraft.
The first method used the definition of the aircraft inertia in XFLR5. This means that each component
of the aircraft was defined with its mass and its distance from the nose of the aircraft. After this,
XFLR5 automatically calculated the aircraft’s CG and NP to be 0.264 m and 0.300 m, respectively.
The second method involved the Cm vs α plot in XFLR5. The first step in this method was to make
sure that the analysis in XFLR5 ignored the aircraft inertia. After this, the CG location was iterated
until Cmα = 0 (i.e. a flat horizontal line appeared in the Cm vs α plot). When the slope of this
curve became approximately zero, it meant that the location of the CG was at the neutral point. The
resulting CG and NP using this method were 0.264 m and 0.296 m, respectively.
It is important to keep in mind that both methods previously discussed were mere approximations,
which is why the SpaceForce team decided to take an average of both results, for a final CG of 0.264
11
m and a final NP of 0.298 m. Using these CG and NP values, the static margin for the aircraft was
calculated to be about 8.763 % MAC, which was obtained with Equation 5.
SM =
XN P − XCG
M AC
(5)
B. Longitudinal Static Stability
There are 4 longitudinal modes of natural stability, but due to symmetry, only two types of
oscillations are considered: short period and phugoid. The root locus shown in Figure 11 gives a
clear representation of the eigenvalues that represent these oscillations on the real-imaginary plane.
Since all the eigenvalues are on the left-hand plane (i.e. the real part of each of these eigenvalues is
negative), it can be concluded that the aircraft is naturally stable in these modes of oscillation.
Figure 11: Longitudinal Stability Eigenvalues
When looking at the CM vs α curve, it became evident that the aircraft needed to be trimmed (i.e.
elevon deflection during cruise) [9]. This is because the aircraft’s cruise speed and angle of attack
were determined to be be 22.352 m/s (50 mph) and 5 degrees, respectively, but the CM vs α curve
indicated a lower cruise α. With a positive elevon deflection during cruise, the necessary α can be
achieved while keeping the aircraft stable. This can be seen in Figure 12 below.
12
Figure 12: CM vs α with trimming such that αeq = αcruise = 5 degrees.
C. Lateral Static Stability
There are 4 lateral modes of natural stability, two of which are symmetric. Therefore, only three
types of oscillations are considered: roll subsidence, dutch roll, and spiral. The root locus shown in
Figure 13 gives a clear representation of the eigenvalues that represent these oscillations on the
real-imaginary plane. Just by looking at the location of the eigenvalues in Figure 13, it can be seen
that the only lateral mode in which the SpaceForce One is stable is roll subsidence. The real part
of the dutch roll and spiral eigenvalues were positive and very close to zero. Because they were
positive, the aircraft is naturally unstable in these modes of oscillation. The behavior stems from
the fact that the SpaceForce One lacks any sort of vertical stabilizing system, such as winglets or a
fin. The team decided not to make any physical additions to stabilize the aircraft in these modes due
to other compromising issues that would arise, such as weight excess. For this reason, the aircraft’s
differential thrust and control system will be the essential tools to compensate for this issue. In
future iterations of the SpaceForce One, however, the team plans to make the aircraft naturally stable
at least in the dutch roll mode. This is an important task to take on, because it increases the chances
for the aircraft to recover in the case of a motor malfunction or other related issues.
13
Figure 13: Lateral Stability Eigenvalues
D. Control Surface Sizing
Figure 14: Elevon Dimensions
The control surfaces were sized primarily using historical data. From chapter 25 of the book, Basics
of R/C Model Aircraft Design [10], it was discovered that a typical RC airplane has ailerons that
cover the outer 40 percent of the rear quarter chord of the wings. Given the double functions of the
elevons on the SpaceForce One aircraft, it was decided that the control surfaces should be larger,
rather than smaller, than those on a similar airplane to achieve the desired control authority without
risking control surface stall. Looking at the YB49 as a reference, it was seen that flying wings can
fly with elevons sized similarly to conventional ailerons [7]. With that, the ailerons were sized to be
the outer 60 percent of the trailing edge of the wing, starting from 3/4 chord to the trailing edge.
These control surfaces are larger than those typically seen on existing full sized flying wings, but
they are not large enough to be expected control or stability issues.
14
VIII. Structures
A. Internal Structure
The most prominent structural challenge for SpaceForce One was the design of an internal structure,
which could withstand the aerodynamic loads during flight. The most substantial, of these loads,
being the moment where the root of the wing meets the internal components of the fuselage. In
a previous iteration of the internal structure, 3D printed connectors were designed to connect the
carbon fiber wing spars to the beams of the internal structure of the fuselage. A wing root moment
test was run for this design, but the 3D printed components did not withstand the applied load of 5
N-m. Due to this failure, a new internal structure comprised of carbon fiber plates was designed.
This design can be seen in Figure 15.
Figure 15: Internal Structural Skeleton
B. Structural Limits
To find the envelope in which the aircraft could operate while keeping its structural integrity, some
assumptions had to be made based on historical data. Based on similar aircraft and the team’s
mission requirements, a turning radius of 50 meters was assumed. This gave a maximum bank
angle of Φ = 45.53o, obtained through Equation 6.
Φ = tan−1
(
V2
rg
) (6)
The Load factor was then calculated to be n = 2.14, which includes a factor of safety of 1.5. This
was obtained from Equation 7
n =
1
cosΦ
( f actor o f sa f ety) (7)
Finally, the maximum lift in turning was calculated using Equation 8, which came out to be
Lmax = 157.53N.
15
Lmax = nW (8)
Using this information, a Matlab code (1 was developed to obtain a visual representation of the
aircraft’s structural envelope. This was based on the stall speed, the cruise speed, the load factor
(previously calculated), and the historical data for a negative load factor limit. This envelope can be
seen in Figure 16.
Figure 16: Aircraft Limits
C. Torsional Analysis
A maximum angle of twist of 1 degree was set as the constraint for the torsional analysis performed.
In order to calculate the angle of twist, SpaceForce needed to determine the torsional constant and
the torque on the wing. Equation 9 was used to determine the torsional constant of 3.9172*10-8.
J = 2.25 ∗ a4
outside − 2.25 ∗ a4
inside (9)
Along with the torsional constant, the torque was needed to determine the twist angle. The torque
was determined to be 49.8124 N-m through a conservative estimation of an integral along the wing
of the vehicle. This estimation involved dividing the wing into several parts and finding the torque
of each part and then summing those torque values. After the torque was determined, a value of
1.2554 degrees was calculated for the angle of twist from Equation 10.
16
φ =
T ∗ b
2
G ∗ J
(10)
This was not below the desired value of 1 degree, but considering that the estimation used for torque
was conservative and that the 1.2554 degrees, if accurate, would still not cause torsion to be the
wings first cause of failure, this value was accepted.
D. Skin Thickness Approximations
In order to derive a thickness for the skin of the wing, SpaceForce approximated the cross-section
of the airfoil as a wing box shown in Figure 17.
Figure 17: Wing Box, Approximation of the Wing
In this theoretical approximation, the height was 40 mm and the chord was 300 mm. In order
to approximate a sufficient skin thickness, the value of the thickness was iterated until the stress
experienced due to the bending moment was less than the yield stress of the material used for the
skin of the wing. The equation for this stress is expressed below, where the I is the area moment of
inertia and is a function of the thickness of the skin.
σ =
M ∗ y
I
(11)
A skin thickness of 0.6 mm was determined for the wing. This was based on the above approximation
and the yield stress of the PLA material used to construct the wing.
E. Wing Tip Deflection
The maximum deflection of the wing tip was a crucial value for SpaceForce to calculate because it
was further used to make sure that the aircraft did not fail due to the deflection of its wings during
flight. To find the wing deflection, it was assumed that the front wing spar could be idealized as a
cylindrical rod fixed to a wall, as shown in Figure 18.
17
Figure 18: Wing spar idealization for the purpose of finding wing deflection
Because there are two spars in the wing, the assumption that the front spar experiences half of the
total load was made. The length of the rod was 775 mm and the maximum force, represented by F
in Figure 18 to be experienced by the rod was 55.125 N. To solve for the maximum wing deflection
and the deflection slope, the following equations were used.
δ =
F ∗ L3
3 ∗ E ∗ I
(12)
θ =
F ∗ L2
2 ∗ E ∗ I
(13)
In these equations, E is the modulus of elasticity of the carbon fiber rod, and I is the moment of
inertia of the cross-section. Using these equations, the max deflection was found to be 4.5 cm, and
the deflection slope was found to be 5o.
IX. Propulsion
This vehicle has both vertical flight and horizontal flight modes that needed to be considered for the
Propulsion Sizing. For vertical flight, it was well established that a quad-rotor with decent handling
capabilities had a minimum thrust to weight ratio of around 1.8-2.0. This meant that each of the
four propellers on the vehicle needed to sustain 36.8 newtons of thrust for the duration of takeoff
and landing. For cruise, each propeller needed to sustain 1.3 newtons of thrust.
The first step in propulsion sizing was picking a propeller. Because the layout required two pairs
of counter-rotating propellers, APC and Master Airscrew were the only manufacturers who had
a usable selection of propellers with data to use. Of the propellers considered, the only set of
counter-rotating propellers, that provided around 70 percent cruise efficiency while not exceeding
2235 Watts during hover, was the APC 15x10e [11]. Using Figures 19, 20, and 21, the thrust and
power values were calculated from the points marked with red x’s, using the following equations:
18
J =
v
nd
(14)
Thrust = Ct ∗ ρ ∗ n3
∗ d4
(15)
Power = Cp ∗ ρ ∗ n3
∗ d5
(16)
Where n is the rotations per second of the propeller.
Figure 19: Ct Vs J
19
Figure 20: Cp Vs J
Figure 21: Efficiency Vs J
This specific propeller requires 1230.4 watts at 7000 RPM to achieve the required 1.8-2.0 thrust-to-
weight ratio. Using the same Ct Vs J plot (Figure 19) and CP Vs J plot (Figure 20), the power
required for cruise was found to be 38.45 watts per propeller at 4250 RPM.
With the required power and RPM for both takeoff and cruise, the motor could be selected. The
three primary criteria for selecting the motor were a low no-load current, power capability, and the
correct resistance and KV to achieve the desired RPM. A low no-load current was important for
efficiency, given the torque equation:
20
Torque = Kt(I − I0) (17)
Where
Kt = 1/KV (18)
The efficiency of a motor at low power output can be extrapolated to be approximately the ratio of the
total current minus the no-load current over the total current. This means that lower no-load current
would result in higher efficiency. Power capability was important because a motor that cannot handle
the power requirements would burn out and fail. The resistance and KV both determined how fast
the motor would spin at 100 % throttle, given the assumed 14.8v battery and power requirement
from the propeller data, as shown in the equation:
Rpm = Kv(V − I ∗ Rm) (19)
With all the requirements listed, the Sunnysky 3525 520Kv motor was selected [12]. It could handle
the power requirement and it had the right KV and IR to provide the right thrust for hover. These
motors were paired with the YEP 100 Amp electronic speed controllers [13], because the calculated
current draw was found to be 97 Amps using the aforementioned equations.
For the power supply, four Turnigy 3000mAh 4s 40c lithium polymer batteries were chosen based
on the following criteria:
• Calculated motor power draw
• 30 minute cruise time
• A 10 percent overhead to provide 45 seconds of takeoff and landing time
• 80 % battery discharge rule in addition to the 20 % overhead for maneuvering and wind
Individually, each of the four motors weighed 243 g, each of the four ESCs weighed 81 g, and each
of the four batteries weighed 330 g, leading to the overall propulsion system weight of 2616 g.
Altogether, the cruise efficiency came out to be 43 % with 74 % propeller efficiency and 58 % motor
efficiency. The propeller efficiency was acceptable. However, the motor efficiency was lower than
expected for tje brushless motor setup. The reason for this was the fact that the cruise thrust was
1/28 the vertical takeoff thrust. A motor that can handle the cruise thrust with 85-90 % efficiency
likely would not survive putting out 28 times as much thrust. While a motor large enough to handle
the takeoff loads would have a high no-load current and low efficiency at low power outputs. All
considered, the final setup was the most efficient setup that was found after many hours of searching.
21
X. Performance Results
A. Structures and Propulsion Testing
Prior to the final flight test, performance tests were conducted to confirm the structural strength of
the vehicle as well as the adequacy of the propulsion system.
For the structural components test, the primary concern was the strength of the connectors which
handled the bending moment of the wings. In order to replicate the conditions of the wingtip test,
a 5-pound weight was placed at the end of the wing spar held up only by the connection device.
Initial attempts with plastic joints failed immediately. The final clamp design was easily able to
pass the test.
For the propulsion system, two tests were conducted. The first test was a no-load test to determine
the motor’s true cruise efficiency. The second test was conducted to determine the maximum static
thrust. The no-load test showed that the motor current draw at no-load was only 1.2 amps as opposed
to the expected value of 1.8 amps. The motor efficiency was actually 68 percent during a cruise,
instead of 58 percent. This increased the overall efficiency from 43 to 50 percent. The thrust stand
test showed a maximum thrust of 3.16 kg. However, it was determined that the thrust stand was
only measuring 85 percent of the overall thrust. Diving 3.16 kg by 0.85, it resulted in a true thrust
of 3.717 kg of thrust which gave the vehicle a total thrust of 32.72 pounds.
B. Flight Test
The flight test plan for the SpaceForce One can be seen in Figure 22 below. The location of the
flight tests was MacAllister Park in Lafayette, IN.
Figure 22: XFLR5 aircraft masses with coordinate system.
22
Attempt #1
The first attempt took place on the 11th of December. During the vertical takeoff, everything was
stable and functioning properly. After about five seconds of hovering, it seemed like the aircraft
attempted to transition on its own. However, an instant later, one of the propellers came off, causing
the aircraft to tilt over and head towards the ground. The impact completely destroyed the pod.
Nothing else was damaged, and the SpaceForce team planned for another attempt later in the week.
Attempt #2
The second attempt to fly took place on the 13th of December at the same location, which wasn’t the
best day to fly as it was raining. When the vertical takeoff was attempted, the plane could not get off
the ground. Rather, it fell on its back and one of the propellers hit the ground, which damaged the
motor mount. The team was able to fix this within a few minutes, but decided not to attempt another
takeoff, since an electrical malfunction was suspected and could have affected the control inputs.
Attempt #3
The third test flight was performed on 14th of December. During the vertical takeoff, the aircraft
soared up at a fast speed in an effort to transition to cruise configuration at a high altitude for safety
purposes. The takeoff was very promising, until pieces of the carbon fiber internal structure came
off due to vibrations, hitting one of the propellers. This caused propeller to break one of the carbon
fiber rods that held one of the motors. The aircraft then fell from the sky and landed right-side up.
Although the landing was impressive, the aircraft damage was beyond repairable and it concluded
the final flight test.
Data from Attempt #3 was retrieved from the flight controller, and through a MATLAB code, the
plots shown in Figures 23 and 24 were obtained.
Figure 23: Aircraft 2D and 3D Trajectory from Test Flight
23
Figure 24: Time History of Aircraft Altitude and Horizontal Speed from Test Flight
XI. Conclusion
The goal of the SpaceForce One was to transport medical supplies to rural, less connected hospitals
in a 25 mile radius, within a 30 minute time frame. The SpaceForce team iterated through each part
of the design process in order to develop the best aircraft that would solve the problem presented.
Sizing, aerodynamics, stability, structures, and propulsion were all thoroughly analyzed in order
to successfully deliver on the defined problem. Multiple tests were performed prior flight, which
served as a proof of concept and allowed the team to move forward with flight. The SpaceForce
team attempted three flights with mild success. The SpaceForce One took off and hovered, but
failed before transitioning into cruise configuration. The flight was semi-successful and with more
time, the SpaceForce team is confident that the aircraft would be able to fully and successfully
complete the mission. If given more time, the SpaceForce team would perform even more tests on
the aircraft, such as a wind tunnel test, more structural testing, propulsion testing, vibration testing,
and more. The team is confident that the implementation of this further testing would result in a
fully successful flight. The SpaceForce team is currently about one full plane iteration away from
being comfortable with the final product, but under the given time constraints, this first iteration
can be seen as a partial success. Once the SpaceForce One flawlessly soars through the skies, the
SpaceForce Team will not let it fly alone for long, because the SpaceForce Two is coming soon.
24
Appendix I: Request for Proposal
Design of a Fixed-Wing UAS for Medical Device Delivery
Background:
Small, affordable, easily launched remotely piloted Unmanned Aerial Systems (UAS) are of great interest to both civil
(e.g., public safety, hazard monitoring), commercial (e.g., crop observation, cargo delivery), and military (e.g.,
surveillance, communications) sectors. While some of these systems will be on quadrotor platforms, to achieve the range
and speed needed for select missions, more efficient fixed-wing aircraft are needed. Many of the small UAS (sUAS) are
manufactured with model airplane techniques imposing constraints on the design. The use of additive manufacturing (3D
printing) will allow customizable UAS optimized for a given mission.
The Design Challenge:
Your challenge is to design, build, and flight test a 3D additive manufactured, electric
powered, remotely piloted fixed-wing aircraft that can satisfy the following mission
requirements.
The aircraft must be able to climb to at least 200 feet, deliver a medical payload, record
flight telemetry (position, altitude and velocity) and must be able to be recovered and
re-launched with no damage. The aircraft may not make use of wheeled landing gear.
The footprint of the launch and landing area is 3 m in diameter. The UAS must clear a
15 m height within the diameter. That is, the launch area is a 3m diameter cylinder 15
m high.
The medical payload is defined as a rectangular box up to 100 mm x 50 mm x 20 mm
and 1.5 kg. The UAS must be able to travel 25 miles in 30 minutes or less.
The aircraft must be able to be controlled autonomously by a PixHawk autopilot.
Flight Test Overview and Design Constraints:
Flight test of your sUAS solution must be safely demonstrated outdoors at the airfield in McAllister Park, Lafayette, IN.
The vehicle should be stable under all flight conditions. More specifically:
 It must demonstrate ease of deployment and flight:
o Be able to set-up and assemble/present for flight to the pilot in the field within 10 minutes
o Be able to commence flight from a stationary position under its own power
o Exhibit features of modularity and proper access to accommodate future swapping of payloads and/or different
batteries
o Be able to safely operate without damage from launch or recovery mission phases
o Be easy to fly for the remote pilot by demonstrating Level 1 flying qualities and a pilot-operated switch to autopilot
mode(s)
 It must demonstrate the ability to record flight telemetry.
Any deviations must be formally requested in writing to the customer and justified using sound engineering and business
logic.
3m
15m
i
Appendix II: Additional Supporting Figures
Concept Selection and Design
Figure 25: The Flying Wing Basic Initial Design
Aerodynamics
Figure 26: Speed vs α when cruise lift is fixed
ii
Stability
Figure 27: XFLR5 aircraft masses with coordinate system.
Figure 28: Longitudinal Stability - Short Period Speed Variations.
iii
Figure 29: Longitudinal Stability - Short Period Pitch Rate and Angle.
[
Figure 30: Longitudinal Stability - Phugoid Speed Variations.
iv
Figure 31: Longitudinal Stability - Phugoid Pitch Rate and Angle.
Figure 32: Lateral Stability - Roll Damping Speed Variation and Roll Rate.
v
Figure 33: Lateral Stability - Roll Damping Yaw Rate and Heading Angle.
Figure 34: Lateral Stability Dutch Roll Speed Variation and Roll Rate.
vi
Figure 35: Lateral Stability Dutch Roll Yaw Rate and Heading Angle.
Figure 36: Lateral Stability - Spiral Speed Variation and Roll Rate.
vii
Figure 37: Lateral Stability - Spiral Yaw and Roll Rate.
Structures
Figure 38: Bending Moment Diagram at αmax and Vcruise
viii
Figure 39: Lift Distribution at Maximum Wing Loading
Propulsion
Figure 40: Sunnysky 3525 520kv Brushless Motor [12]
ix
Figure 41: Yep 100a 6s ESC [13]
Figure 42: Turnigy 4000mAh 4s 40c Lipo [14]
x
Appendix III: Additional Supporting Tables
Concept Selection and Design
Table 4: Pugh’s Matrix
This Pugh’s Matrix, Table 4, was used early in the concept selection process to select 4 final concepts
from the original 8 concepts, that were developed through brainstorming.
xi
Table 5: Weighted Decision Matrix
This Weighted Decision Matrix, Table 5, was used in the concept selection process in order to select
the final concept, from which the rest of the project would be based on. This concept was selected
from a choice of 4 concepts previously chosen from the Pugh’s Matrix.
xii
Vehicle Sizing
Table 6: Inputted Values Used to Create the Constraint Graph
Inputs
Constraint
Constants
Takeoff
Maximum
Speed
Landing Ceiling
Rate of
Climb
Turns
AR 9.738 9.738 9.738 9.738 9.738 9.738 9.738
Cd0 .03 .03 .03 .03 .03 .03 .03
e .8 .8 .8 .8 .8 .8 .8
Prop
Efficiency
.7 .7 .7 .7 .7 .7 .7
Motor
Efficiency
.8 .8 .8 .8 .8 .8 .8
Alt (m) NA 0 60 0 120 45 60
Vel (m/s) NA NA 22.352 22.352 NA NA 22.352
Clmax NA 1.2 NA NA NA NA NA
landing
Dist. (m)
NA NA NA NA NA NA NA
Density
(kg/m^3)
NA NA NA NA 1.225 1.225 1.225
Load Factor NA NA NA NA NA NA 2
Takeoff
Dist. (m)
NA 15 NA NA NA NA NA
Table 6 shows the values that were used in the preliminary constraining of SpaceForce’s aircraft.
These values were preliminary estimations based on historical data. These values helped the team
find a starting point from which they expanded their design.
xiii
Table 7: Historical Data used to Estimate Mass Fraction
Plane
Payload Mass
Fraction
Battery Mass
Fraction
Range
(mi)
Cornell AUVSI
SUAS 2018
0.303 NA 15.5
Raven RQ11 0.09 NA 50
Talon 120LE 0.1136 NA 45
Technion AUVSI
SUAS 2018
NA 0.2 NA
Sherbrooke AUVSI
2017
0.33 NA 21
Cornell AUVSI
SUAS 2017
0.3096 NA 15.5
Table 7 is data that was used in order to create the graph used to find a reasonable payload mass
fraction early in the design[1–6]. This then lead to the calculation of a reasonable expected mass of
the entire aircraft.
xiv
Stability
Table 8: XFLR5 aircraft inertia definition and resulting CG and NP.
Component Mass (kg) x (m) y (m) z (m) CG (m) NP (m)
Batteries 1.320 0.300 0.000 0.000 0.264 0.300
Motor 1 0.243 0.050 0.320 0.000
Motor 2 0.243 0.050 - 0.320 0.000
Motor 3 0.243 0.050 0.000 0.320
Motor 4 0.243 0.050 0.000 -0.320
Payload 1.500 0.264 0.000 0.000
ESC 1 0.058 0.235 0.000 0.000
ESC 2 0.058 0.230 0.000 0.000
ESC 3 0.058 0.225 0.000 0.000
ESC 4 0.058 0.220 0.000 0.000
Pod 1.133 0.230 0.000 0.000
Pixhawk 0.080 0.000 0.000 0.000
Table 9: Eigenvalues of the Longitudinal Stability Modes
Longitudinal Stability Modes
Modes Eigenvalue
Short Period −7.734 − 16.34i
Short Period −7.734 + 16.34i
Phugoid −0.01067 − 0.4114i
Phugoid −0.01067 + 0.4114i
Table 10: Eigenvalues of the Lateral Stability Modes
Lateral Stability Modes
Modes Eigenvalue
Roll Subsidence −14.66
Dutch Roll 0.03922 − 0.8676i
Dutch Roll 0.03922 + 0.8676i
Spiral 0.05918
xv
Appendix IV: Matlab Code
Listing 1: Matlab Script for V-n Diagram (Structures)
1
2
3 %%%%%%%%%%%%%%%%%%%%%%%%%%%%%%%%%%%%%%%%%%%%%%%%%%%%%%%%%%%%%%
4 %
5 % SpaceForce V-n Diagram Code
6 %
7 % Ernesto Ramirez
8 % Benjamin Ye
9 % Cody Foss
10 % Yuhan Roh
11 % Colfax Putt
12 %
13 %%%%%%%%%%%%%%%%%%%%%%%%%%%%%%%%%%%%%%%%%%%%%%%%%%%%%%%%%%%%%%
14 clear;clc;
15
16 v = (0:35);
17 r = 15;
18 g = 9.81;
19
20
21 phi = atan(v.^2./(r*g));
22 n_pos = 1./cos(phi)-1;
23 n_neg = -1./cos(phi)+1;
24 n_lim_pos = linspace(2.14,2.14,36);
25 n_lim_neg = linspace(-2,-2,36);
26 v_max = linspace(22.352,22.352,36);
27 v_stall = linspace(14.5,14.5,36);
28 n_cons = linspace(-5,10,36);
29
30 plot(v,n_pos,'k',v,n_neg,'k')
31 ylim([-5,6])
32 xlim([0,35])
33 hold on
34 plot(v,n_lim_pos,'--r',v,n_lim_neg,'--r',v_max,n_cons,'--r', ...
v_stall,n_cons,'--r')
35 title('V-n Diagram')
36 xlabel('V [m/s]')
37 ylabel('n')
38 grid on
xvi
Listing 2: Matlab Script for Flight Test Performance
1 %%%%%%%%%%%%%%%%%%%%%%%%%%%%%%%%%%%%%%%%%%%%%%%%%%%%%%%%%%%%%%
2 %
3 % SpaceForce Aircraft Flight Test Performance Code
4 %
5 % Ernesto Ramirez
6 % Benjamin Ye
7 % Cody Foss
8 % Yuhan Roh
9 % Colfax Putt
10 %
11 %%%%%%%%%%%%%%%%%%%%%%%%%%%%%%%%%%%%%%%%%%%%%%%%%%%%%%%%%%%%%%
12 clear;clc;
13
14 load('data')
15 time = GPS(1:85,1)./1000; %[seconds]
16 latitude = GPS(1:85,8); %[degrees]
17 longitude = GPS(1:85,9); %[degrees]
18 altitude = GPS(1:85,10); %[m]
19 horizontal_speed = GPS(1:85,11); %[m/s]
20
21 figure
22 plot(longitude,latitude,'LineWidth',2)
23 title('Lateral Trajectory')
24 xlabel('Longitude [deg]')
25 ylabel('Latitude [deg]')
26 grid on
27
28 figure
29 plot(time,altitude,'r','LineWidth',2)
30 title('Altitude')
31 xlabel('Time [s]')
32 ylabel('Altitude [m]')
33 grid on
34
35 figure
36 plot3(longitude,latitude,altitude,'-m','LineWidth',2);
37 title('3-Dimensional Trajectory')
38 xlabel('Longitude [deg]')
39 ylabel('Latitude [deg]')
40 zlabel('Altitude [m]')
41 grid on
42
43 figure
44 plot(time,horizontal_speed,'-k','LineWidth',2)
45 title('Horizontal Speed')
46 xlabel('Time [s]')
47 ylabel('Speed [m/s]')
48 grid on
xvii
Appendix V: Schedule
Figure 43: Gantt Chart
xviii
Acknowledgments
The SpaceForce team thanks Prof. Sullivan, Phil R. Baldwin, and Yao Sun for providing their time
and efforts to helping the team design, build, and test the SpaceForce One aircraft. The team would
also like to thank Purdue University for allowing the use of their facilities to fabricate the aircraft.
References
[1] “Cornell University Unmanned Air Systems 2018 AUVSI SUAS Competition Theia II Technical Design,”
AUVSI SUAS 2018 Journals, 2018. URL http://www.auvsi-suas.org/static/competitions/
2018/journals/auvsi_suas-2018-journals-cornell_university.pdf.
[2] “UAS: RQ-11B Raven,” 2018. URL https://www.avinc.com/uas/view/raven.
[3] “Talon Series Fixed Wing Unmanned Aircraft Systems,” UAV Solutions, 2016. URL
http://uav-solutions.com/wp-content/uploads/2016/05/Fixed-Wing-Brochure-4-
21-2016-Full.pdf.
[4] “Technical Design Paper Vamudes - Universite De Sherbrooke,” AUVSI SUAS 2017 Journals,
2017. URL http://www.auvsi-suas.org/static/competitions/2017/journals/auvsi_
suas-2017-journals-universite_de_sherbrooke.pdf.
[5] “Cornell University Unmanned Air Systems 2017 AUVSI Student UAS Competition,” AUVSI SUAS 2017
Journals, 2017. URL http://www.auvsi-suas.org/static/competitions/2017/journals/
auvsi_suas-2017-journals-cornell_university.pdf.
[6] “Technion Aerial Systems 2018 Technical Design Paper for AUVSI Student-UAS Competition,” AUVSI
SUAS 2018 Journals, 2018. URL http://www.auvsi-suas.org/static/competitions/2018/
journals/auvsi_suas-2018-journals-technion_israel_institute_of_technology.
pdf.
[7] “Northrop YB-49,” National Museum of The US Air Force, 2015. URL https:
//www.nationalmuseum.af.mil/Visit/Museum-Exhibits/Fact-Sheets/Display/
Article/858861/northrop-yb-49/.
[8] “Airfoil Database Search,” 2018. URL http://airfoiltools.com/.
[9] Murman, E., “Introduction to Aircraft Performance and Static Stability,” MIT OpenCourseWare,
2003. URL https://ocw.mit.edu/courses/aeronautics-and-astronautics/16-885j-
aircraft-systems-engineering-fall-2004/lecture-notes/aircraft_murman.pdf.
[10] Lennon, A., Basics of R/C Model Aircraft Design: Practical Techniques for Building Better Models, 1st
ed., Motorbooks Intl, Minneapolis, 1996, Chap. 25.
[11] “Performance Data,” 2018. URL https://www.apcprop.com/technical-information/
performance-data/f.
[12] “SUNNYSKY X3525 BRUSHLESS MOTORS,” 2018. URL https://sunnyskyusa.com/
products/sunnysky-x3525-brushless-motors-520kv-880kv?variant=45197935887.
xix
[13] “YEP 100A (2 6S) SBEC Brushless Speed Controller,” 2018. URL https://hobbyking.com/
en_us/hobbyking-yep-100a-2-6s-sbec-brushless-speed-controller.html?gclid=
CjwKCAjwmJbeBRBCEiwAAY4VVRKyHyKpwylClzzQXhJ4vpdUuzofrGS-hnAtMJpBNEh5R2G0EDIX-
RoC640QAvD_BwE&gclsrc=aw.ds.
[14] “Turnigy 3000mAh 4S 40C Lipo Pack w/XT-60,” 2018. URL https://hobbyking.
com/en_us/turnigy-battery-3000mah-4s-40c-lipo-pack-xt-60.html?gclid=
CjwKCAjwmJbeBRBCEiwAAY4VVab1g4T5cZZH8EnRp1EiEhP7ES0qd1JqjveDgAg1i_
z8wH5r86b3MBoCLlYQAvD_BwE&gclsrc=aw.ds.
xx

More Related Content

What's hot

refrigeration and air conditioning tables complete
refrigeration and air conditioning tables completerefrigeration and air conditioning tables complete
refrigeration and air conditioning tables complete
Shadab Khan
 
Main Project - FINAL COPY 786
Main Project - FINAL  COPY 786Main Project - FINAL  COPY 786
Main Project - FINAL COPY 786Rohit Sai Raj
 
Final Year Project report on quadcopter
Final Year Project report on quadcopter Final Year Project report on quadcopter
Final Year Project report on quadcopter
Er. Ashutosh Mishra
 
EASA Part-66 Module05 mcq's
EASA Part-66 Module05 mcq'sEASA Part-66 Module05 mcq's
EASA Part-66 Module05 mcq's
Armghan Saeed
 
PPT-AIRCRAFT DESIGN PROJECT-II.pptx
 PPT-AIRCRAFT DESIGN PROJECT-II.pptx PPT-AIRCRAFT DESIGN PROJECT-II.pptx
PPT-AIRCRAFT DESIGN PROJECT-II.pptx
ManojRasaily1
 
Quadcopter ppt
Quadcopter pptQuadcopter ppt
Quadcopter ppt
Subhash kumar
 
Aircraft Auto Pilot Roll Control System
Aircraft Auto Pilot Roll Control SystemAircraft Auto Pilot Roll Control System
Aircraft Auto Pilot Roll Control SystemSuchit Moon
 
Airworthiness: Failure to follow procedures
Airworthiness:  Failure to follow proceduresAirworthiness:  Failure to follow procedures
Airworthiness: Failure to follow procedures
FAA Safety Team Central Florida
 
Swept wing configuration
Swept wing configuration Swept wing configuration
Swept wing configuration Buddhikaaero
 
Drone (Quadcopter) full project report by Er. ASHWANI DIXIT
Drone (Quadcopter) full project report by    Er. ASHWANI DIXITDrone (Quadcopter) full project report by    Er. ASHWANI DIXIT
Drone (Quadcopter) full project report by Er. ASHWANI DIXIT
Ashwani Dixit
 
Propeller
PropellerPropeller
Propeller
Khushin Lakshkar
 
Theory of flight final
Theory of flight finalTheory of flight final
Theory of flight final
John Christian De Leon
 
VTOL ( VERTICAL TAKE OFF AND LANDING)
VTOL ( VERTICAL TAKE OFF AND LANDING)VTOL ( VERTICAL TAKE OFF AND LANDING)
VTOL ( VERTICAL TAKE OFF AND LANDING)
Akhil mon
 
Gyroscopes
GyroscopesGyroscopes
Gyroscopes
sasi dhar
 
Aerodynamics flight force
Aerodynamics flight forceAerodynamics flight force
Aerodynamics flight force
Rohiduzzaman7
 
Final Year Project Presentation
Final Year Project PresentationFinal Year Project Presentation
Final Year Project Presentationfarhan_naseer_1
 
Avionics Systems Instruments
Avionics Systems InstrumentsAvionics Systems Instruments
Avionics Systems InstrumentsMichael Bseliss
 
Aircraft wing
Aircraft wingAircraft wing
Aircraft wing
Thirumal Aero
 

What's hot (20)

refrigeration and air conditioning tables complete
refrigeration and air conditioning tables completerefrigeration and air conditioning tables complete
refrigeration and air conditioning tables complete
 
Main Project - FINAL COPY 786
Main Project - FINAL  COPY 786Main Project - FINAL  COPY 786
Main Project - FINAL COPY 786
 
Final Year Project report on quadcopter
Final Year Project report on quadcopter Final Year Project report on quadcopter
Final Year Project report on quadcopter
 
V2500 lbm issue 01
V2500 lbm issue 01 V2500 lbm issue 01
V2500 lbm issue 01
 
EASA Part-66 Module05 mcq's
EASA Part-66 Module05 mcq'sEASA Part-66 Module05 mcq's
EASA Part-66 Module05 mcq's
 
PPT-AIRCRAFT DESIGN PROJECT-II.pptx
 PPT-AIRCRAFT DESIGN PROJECT-II.pptx PPT-AIRCRAFT DESIGN PROJECT-II.pptx
PPT-AIRCRAFT DESIGN PROJECT-II.pptx
 
Quadcopter ppt
Quadcopter pptQuadcopter ppt
Quadcopter ppt
 
LANDING GEAR
LANDING GEARLANDING GEAR
LANDING GEAR
 
Aircraft Auto Pilot Roll Control System
Aircraft Auto Pilot Roll Control SystemAircraft Auto Pilot Roll Control System
Aircraft Auto Pilot Roll Control System
 
Airworthiness: Failure to follow procedures
Airworthiness:  Failure to follow proceduresAirworthiness:  Failure to follow procedures
Airworthiness: Failure to follow procedures
 
Swept wing configuration
Swept wing configuration Swept wing configuration
Swept wing configuration
 
Drone (Quadcopter) full project report by Er. ASHWANI DIXIT
Drone (Quadcopter) full project report by    Er. ASHWANI DIXITDrone (Quadcopter) full project report by    Er. ASHWANI DIXIT
Drone (Quadcopter) full project report by Er. ASHWANI DIXIT
 
Propeller
PropellerPropeller
Propeller
 
Theory of flight final
Theory of flight finalTheory of flight final
Theory of flight final
 
VTOL ( VERTICAL TAKE OFF AND LANDING)
VTOL ( VERTICAL TAKE OFF AND LANDING)VTOL ( VERTICAL TAKE OFF AND LANDING)
VTOL ( VERTICAL TAKE OFF AND LANDING)
 
Gyroscopes
GyroscopesGyroscopes
Gyroscopes
 
Aerodynamics flight force
Aerodynamics flight forceAerodynamics flight force
Aerodynamics flight force
 
Final Year Project Presentation
Final Year Project PresentationFinal Year Project Presentation
Final Year Project Presentation
 
Avionics Systems Instruments
Avionics Systems InstrumentsAvionics Systems Instruments
Avionics Systems Instruments
 
Aircraft wing
Aircraft wingAircraft wing
Aircraft wing
 

Similar to Senior Design Project report

Technical Development of Design & Fabrication of an Unmanned Aerial Vehicle
Technical Development of Design & Fabrication of an Unmanned Aerial VehicleTechnical Development of Design & Fabrication of an Unmanned Aerial Vehicle
Technical Development of Design & Fabrication of an Unmanned Aerial Vehicle
IOSR Journals
 
Dalton - Masters Thesis
Dalton - Masters ThesisDalton - Masters Thesis
Dalton - Masters ThesisThomas Dalton
 
DBlended_Wing_Body_UAV_Design_Report.pdf
DBlended_Wing_Body_UAV_Design_Report.pdfDBlended_Wing_Body_UAV_Design_Report.pdf
DBlended_Wing_Body_UAV_Design_Report.pdf
singhakash15082003
 
AIRCRAFT DESIGN PROJECT -I FIGHTER JETS A PROJECT REPORT
AIRCRAFT DESIGN PROJECT -I FIGHTER JETS A PROJECT REPORTAIRCRAFT DESIGN PROJECT -I FIGHTER JETS A PROJECT REPORT
AIRCRAFT DESIGN PROJECT -I FIGHTER JETS A PROJECT REPORT
Don Dooley
 
HighSpeed_Stealthy_PayloadFocused_VTOL_UAV
HighSpeed_Stealthy_PayloadFocused_VTOL_UAVHighSpeed_Stealthy_PayloadFocused_VTOL_UAV
HighSpeed_Stealthy_PayloadFocused_VTOL_UAVMichael C. Becker
 
End of Semester Design Report Final Version
End of Semester Design Report Final VersionEnd of Semester Design Report Final Version
End of Semester Design Report Final VersionDaniel Worts
 
High_Voltage_Design_Brief
High_Voltage_Design_BriefHigh_Voltage_Design_Brief
High_Voltage_Design_BriefLansing Wei
 
Nasa main uav capabilities_assessment
Nasa main uav capabilities_assessmentNasa main uav capabilities_assessment
Nasa main uav capabilities_assessment
Ying wei (Joe) Chou
 
N1303047887
N1303047887N1303047887
N1303047887
IOSR Journals
 
Morphing Aircraft Technology – New Shapes for Aircraft Wing Design
Morphing Aircraft Technology – New Shapes for Aircraft Wing DesignMorphing Aircraft Technology – New Shapes for Aircraft Wing Design
Morphing Aircraft Technology – New Shapes for Aircraft Wing Design
Mani5436
 
Dissertation Final Version
Dissertation Final VersionDissertation Final Version
Dissertation Final VersionSamual Knight
 
Design,Fabrication & Analysis of a Quardcopter___Research Paper
Design,Fabrication & Analysis of a Quardcopter___Research PaperDesign,Fabrication & Analysis of a Quardcopter___Research Paper
Design,Fabrication & Analysis of a Quardcopter___Research Paper
Hashim Hasnain Hadi
 
Rapid Development of a Rotorcraft UAV System - AHS Tech Specialists Meeting 2005
Rapid Development of a Rotorcraft UAV System - AHS Tech Specialists Meeting 2005Rapid Development of a Rotorcraft UAV System - AHS Tech Specialists Meeting 2005
Rapid Development of a Rotorcraft UAV System - AHS Tech Specialists Meeting 2005Mark Hardesty
 
A Review on Longitudinal Control Law Design for a Small Fixed-Wing UAV
A Review on Longitudinal Control Law Design for a Small Fixed-Wing UAVA Review on Longitudinal Control Law Design for a Small Fixed-Wing UAV
A Review on Longitudinal Control Law Design for a Small Fixed-Wing UAV
IRJET Journal
 
Hexacopter k ucopter
Hexacopter k ucopterHexacopter k ucopter
Hexacopter k ucopter
Al Mtdrs
 
Blended Wing Body Aircraft
Blended Wing Body AircraftBlended Wing Body Aircraft
Blended Wing Body Aircraft
Nicholas Ilibasic
 

Similar to Senior Design Project report (20)

Paparrazzi_Final (1)
Paparrazzi_Final (1)Paparrazzi_Final (1)
Paparrazzi_Final (1)
 
Technical Development of Design & Fabrication of an Unmanned Aerial Vehicle
Technical Development of Design & Fabrication of an Unmanned Aerial VehicleTechnical Development of Design & Fabrication of an Unmanned Aerial Vehicle
Technical Development of Design & Fabrication of an Unmanned Aerial Vehicle
 
Dalton - Masters Thesis
Dalton - Masters ThesisDalton - Masters Thesis
Dalton - Masters Thesis
 
DBlended_Wing_Body_UAV_Design_Report.pdf
DBlended_Wing_Body_UAV_Design_Report.pdfDBlended_Wing_Body_UAV_Design_Report.pdf
DBlended_Wing_Body_UAV_Design_Report.pdf
 
AIRCRAFT DESIGN PROJECT -I FIGHTER JETS A PROJECT REPORT
AIRCRAFT DESIGN PROJECT -I FIGHTER JETS A PROJECT REPORTAIRCRAFT DESIGN PROJECT -I FIGHTER JETS A PROJECT REPORT
AIRCRAFT DESIGN PROJECT -I FIGHTER JETS A PROJECT REPORT
 
HighSpeed_Stealthy_PayloadFocused_VTOL_UAV
HighSpeed_Stealthy_PayloadFocused_VTOL_UAVHighSpeed_Stealthy_PayloadFocused_VTOL_UAV
HighSpeed_Stealthy_PayloadFocused_VTOL_UAV
 
End of Semester Design Report Final Version
End of Semester Design Report Final VersionEnd of Semester Design Report Final Version
End of Semester Design Report Final Version
 
High_Voltage_Design_Brief
High_Voltage_Design_BriefHigh_Voltage_Design_Brief
High_Voltage_Design_Brief
 
Nasa main uav capabilities_assessment
Nasa main uav capabilities_assessmentNasa main uav capabilities_assessment
Nasa main uav capabilities_assessment
 
Final-Report
Final-ReportFinal-Report
Final-Report
 
N1303047887
N1303047887N1303047887
N1303047887
 
Morphing Aircraft Technology – New Shapes for Aircraft Wing Design
Morphing Aircraft Technology – New Shapes for Aircraft Wing DesignMorphing Aircraft Technology – New Shapes for Aircraft Wing Design
Morphing Aircraft Technology – New Shapes for Aircraft Wing Design
 
Dissertation Final Version
Dissertation Final VersionDissertation Final Version
Dissertation Final Version
 
Design,Fabrication & Analysis of a Quardcopter___Research Paper
Design,Fabrication & Analysis of a Quardcopter___Research PaperDesign,Fabrication & Analysis of a Quardcopter___Research Paper
Design,Fabrication & Analysis of a Quardcopter___Research Paper
 
NASA RFP
NASA RFPNASA RFP
NASA RFP
 
RECU_SCITECH
RECU_SCITECHRECU_SCITECH
RECU_SCITECH
 
Rapid Development of a Rotorcraft UAV System - AHS Tech Specialists Meeting 2005
Rapid Development of a Rotorcraft UAV System - AHS Tech Specialists Meeting 2005Rapid Development of a Rotorcraft UAV System - AHS Tech Specialists Meeting 2005
Rapid Development of a Rotorcraft UAV System - AHS Tech Specialists Meeting 2005
 
A Review on Longitudinal Control Law Design for a Small Fixed-Wing UAV
A Review on Longitudinal Control Law Design for a Small Fixed-Wing UAVA Review on Longitudinal Control Law Design for a Small Fixed-Wing UAV
A Review on Longitudinal Control Law Design for a Small Fixed-Wing UAV
 
Hexacopter k ucopter
Hexacopter k ucopterHexacopter k ucopter
Hexacopter k ucopter
 
Blended Wing Body Aircraft
Blended Wing Body AircraftBlended Wing Body Aircraft
Blended Wing Body Aircraft
 

Recently uploaded

ethical hacking in wireless-hacking1.ppt
ethical hacking in wireless-hacking1.pptethical hacking in wireless-hacking1.ppt
ethical hacking in wireless-hacking1.ppt
Jayaprasanna4
 
English lab ppt no titlespecENG PPTt.pdf
English lab ppt no titlespecENG PPTt.pdfEnglish lab ppt no titlespecENG PPTt.pdf
English lab ppt no titlespecENG PPTt.pdf
BrazilAccount1
 
Top 10 Oil and Gas Projects in Saudi Arabia 2024.pdf
Top 10 Oil and Gas Projects in Saudi Arabia 2024.pdfTop 10 Oil and Gas Projects in Saudi Arabia 2024.pdf
Top 10 Oil and Gas Projects in Saudi Arabia 2024.pdf
Teleport Manpower Consultant
 
ASME IX(9) 2007 Full Version .pdf
ASME IX(9)  2007 Full Version       .pdfASME IX(9)  2007 Full Version       .pdf
ASME IX(9) 2007 Full Version .pdf
AhmedHussein950959
 
Architectural Portfolio Sean Lockwood
Architectural Portfolio Sean LockwoodArchitectural Portfolio Sean Lockwood
Architectural Portfolio Sean Lockwood
seandesed
 
DESIGN A COTTON SEED SEPARATION MACHINE.docx
DESIGN A COTTON SEED SEPARATION MACHINE.docxDESIGN A COTTON SEED SEPARATION MACHINE.docx
DESIGN A COTTON SEED SEPARATION MACHINE.docx
FluxPrime1
 
Hybrid optimization of pumped hydro system and solar- Engr. Abdul-Azeez.pdf
Hybrid optimization of pumped hydro system and solar- Engr. Abdul-Azeez.pdfHybrid optimization of pumped hydro system and solar- Engr. Abdul-Azeez.pdf
Hybrid optimization of pumped hydro system and solar- Engr. Abdul-Azeez.pdf
fxintegritypublishin
 
AP LAB PPT.pdf ap lab ppt no title specific
AP LAB PPT.pdf ap lab ppt no title specificAP LAB PPT.pdf ap lab ppt no title specific
AP LAB PPT.pdf ap lab ppt no title specific
BrazilAccount1
 
Industrial Training at Shahjalal Fertilizer Company Limited (SFCL)
Industrial Training at Shahjalal Fertilizer Company Limited (SFCL)Industrial Training at Shahjalal Fertilizer Company Limited (SFCL)
Industrial Training at Shahjalal Fertilizer Company Limited (SFCL)
MdTanvirMahtab2
 
J.Yang, ICLR 2024, MLILAB, KAIST AI.pdf
J.Yang,  ICLR 2024, MLILAB, KAIST AI.pdfJ.Yang,  ICLR 2024, MLILAB, KAIST AI.pdf
J.Yang, ICLR 2024, MLILAB, KAIST AI.pdf
MLILAB
 
Governing Equations for Fundamental Aerodynamics_Anderson2010.pdf
Governing Equations for Fundamental Aerodynamics_Anderson2010.pdfGoverning Equations for Fundamental Aerodynamics_Anderson2010.pdf
Governing Equations for Fundamental Aerodynamics_Anderson2010.pdf
WENKENLI1
 
block diagram and signal flow graph representation
block diagram and signal flow graph representationblock diagram and signal flow graph representation
block diagram and signal flow graph representation
Divya Somashekar
 
Gen AI Study Jams _ For the GDSC Leads in India.pdf
Gen AI Study Jams _ For the GDSC Leads in India.pdfGen AI Study Jams _ For the GDSC Leads in India.pdf
Gen AI Study Jams _ For the GDSC Leads in India.pdf
gdsczhcet
 
CFD Simulation of By-pass Flow in a HRSG module by R&R Consult.pptx
CFD Simulation of By-pass Flow in a HRSG module by R&R Consult.pptxCFD Simulation of By-pass Flow in a HRSG module by R&R Consult.pptx
CFD Simulation of By-pass Flow in a HRSG module by R&R Consult.pptx
R&R Consult
 
Cosmetic shop management system project report.pdf
Cosmetic shop management system project report.pdfCosmetic shop management system project report.pdf
Cosmetic shop management system project report.pdf
Kamal Acharya
 
MCQ Soil mechanics questions (Soil shear strength).pdf
MCQ Soil mechanics questions (Soil shear strength).pdfMCQ Soil mechanics questions (Soil shear strength).pdf
MCQ Soil mechanics questions (Soil shear strength).pdf
Osamah Alsalih
 
在线办理(ANU毕业证书)澳洲国立大学毕业证录取通知书一模一样
在线办理(ANU毕业证书)澳洲国立大学毕业证录取通知书一模一样在线办理(ANU毕业证书)澳洲国立大学毕业证录取通知书一模一样
在线办理(ANU毕业证书)澳洲国立大学毕业证录取通知书一模一样
obonagu
 
CME397 Surface Engineering- Professional Elective
CME397 Surface Engineering- Professional ElectiveCME397 Surface Engineering- Professional Elective
CME397 Surface Engineering- Professional Elective
karthi keyan
 
ML for identifying fraud using open blockchain data.pptx
ML for identifying fraud using open blockchain data.pptxML for identifying fraud using open blockchain data.pptx
ML for identifying fraud using open blockchain data.pptx
Vijay Dialani, PhD
 
H.Seo, ICLR 2024, MLILAB, KAIST AI.pdf
H.Seo,  ICLR 2024, MLILAB,  KAIST AI.pdfH.Seo,  ICLR 2024, MLILAB,  KAIST AI.pdf
H.Seo, ICLR 2024, MLILAB, KAIST AI.pdf
MLILAB
 

Recently uploaded (20)

ethical hacking in wireless-hacking1.ppt
ethical hacking in wireless-hacking1.pptethical hacking in wireless-hacking1.ppt
ethical hacking in wireless-hacking1.ppt
 
English lab ppt no titlespecENG PPTt.pdf
English lab ppt no titlespecENG PPTt.pdfEnglish lab ppt no titlespecENG PPTt.pdf
English lab ppt no titlespecENG PPTt.pdf
 
Top 10 Oil and Gas Projects in Saudi Arabia 2024.pdf
Top 10 Oil and Gas Projects in Saudi Arabia 2024.pdfTop 10 Oil and Gas Projects in Saudi Arabia 2024.pdf
Top 10 Oil and Gas Projects in Saudi Arabia 2024.pdf
 
ASME IX(9) 2007 Full Version .pdf
ASME IX(9)  2007 Full Version       .pdfASME IX(9)  2007 Full Version       .pdf
ASME IX(9) 2007 Full Version .pdf
 
Architectural Portfolio Sean Lockwood
Architectural Portfolio Sean LockwoodArchitectural Portfolio Sean Lockwood
Architectural Portfolio Sean Lockwood
 
DESIGN A COTTON SEED SEPARATION MACHINE.docx
DESIGN A COTTON SEED SEPARATION MACHINE.docxDESIGN A COTTON SEED SEPARATION MACHINE.docx
DESIGN A COTTON SEED SEPARATION MACHINE.docx
 
Hybrid optimization of pumped hydro system and solar- Engr. Abdul-Azeez.pdf
Hybrid optimization of pumped hydro system and solar- Engr. Abdul-Azeez.pdfHybrid optimization of pumped hydro system and solar- Engr. Abdul-Azeez.pdf
Hybrid optimization of pumped hydro system and solar- Engr. Abdul-Azeez.pdf
 
AP LAB PPT.pdf ap lab ppt no title specific
AP LAB PPT.pdf ap lab ppt no title specificAP LAB PPT.pdf ap lab ppt no title specific
AP LAB PPT.pdf ap lab ppt no title specific
 
Industrial Training at Shahjalal Fertilizer Company Limited (SFCL)
Industrial Training at Shahjalal Fertilizer Company Limited (SFCL)Industrial Training at Shahjalal Fertilizer Company Limited (SFCL)
Industrial Training at Shahjalal Fertilizer Company Limited (SFCL)
 
J.Yang, ICLR 2024, MLILAB, KAIST AI.pdf
J.Yang,  ICLR 2024, MLILAB, KAIST AI.pdfJ.Yang,  ICLR 2024, MLILAB, KAIST AI.pdf
J.Yang, ICLR 2024, MLILAB, KAIST AI.pdf
 
Governing Equations for Fundamental Aerodynamics_Anderson2010.pdf
Governing Equations for Fundamental Aerodynamics_Anderson2010.pdfGoverning Equations for Fundamental Aerodynamics_Anderson2010.pdf
Governing Equations for Fundamental Aerodynamics_Anderson2010.pdf
 
block diagram and signal flow graph representation
block diagram and signal flow graph representationblock diagram and signal flow graph representation
block diagram and signal flow graph representation
 
Gen AI Study Jams _ For the GDSC Leads in India.pdf
Gen AI Study Jams _ For the GDSC Leads in India.pdfGen AI Study Jams _ For the GDSC Leads in India.pdf
Gen AI Study Jams _ For the GDSC Leads in India.pdf
 
CFD Simulation of By-pass Flow in a HRSG module by R&R Consult.pptx
CFD Simulation of By-pass Flow in a HRSG module by R&R Consult.pptxCFD Simulation of By-pass Flow in a HRSG module by R&R Consult.pptx
CFD Simulation of By-pass Flow in a HRSG module by R&R Consult.pptx
 
Cosmetic shop management system project report.pdf
Cosmetic shop management system project report.pdfCosmetic shop management system project report.pdf
Cosmetic shop management system project report.pdf
 
MCQ Soil mechanics questions (Soil shear strength).pdf
MCQ Soil mechanics questions (Soil shear strength).pdfMCQ Soil mechanics questions (Soil shear strength).pdf
MCQ Soil mechanics questions (Soil shear strength).pdf
 
在线办理(ANU毕业证书)澳洲国立大学毕业证录取通知书一模一样
在线办理(ANU毕业证书)澳洲国立大学毕业证录取通知书一模一样在线办理(ANU毕业证书)澳洲国立大学毕业证录取通知书一模一样
在线办理(ANU毕业证书)澳洲国立大学毕业证录取通知书一模一样
 
CME397 Surface Engineering- Professional Elective
CME397 Surface Engineering- Professional ElectiveCME397 Surface Engineering- Professional Elective
CME397 Surface Engineering- Professional Elective
 
ML for identifying fraud using open blockchain data.pptx
ML for identifying fraud using open blockchain data.pptxML for identifying fraud using open blockchain data.pptx
ML for identifying fraud using open blockchain data.pptx
 
H.Seo, ICLR 2024, MLILAB, KAIST AI.pdf
H.Seo,  ICLR 2024, MLILAB,  KAIST AI.pdfH.Seo,  ICLR 2024, MLILAB,  KAIST AI.pdf
H.Seo, ICLR 2024, MLILAB, KAIST AI.pdf
 

Senior Design Project report

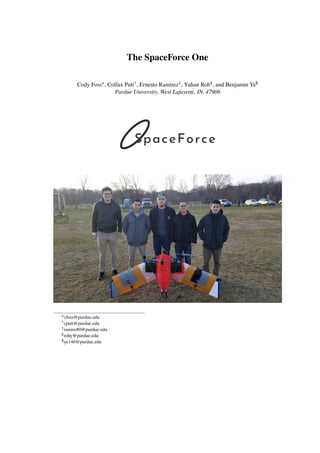
  • 1. The SpaceForce One Cody Foss∗, Colfax Putt†, Ernesto Ramirez‡, Yuhan Roh§, and Benjamin Ye¶ Purdue University, West Lafayette, IN, 47906 ∗cfoss@purdue.edu †cputt@purdue.edu ‡ramire80@purdue.edu §rohy@purdue.edu ¶ye146@purdue.edu
  • 2. Executive Summary This document describes how the SpaceForce One aircraft was designed, built, and tested by the SpaceForce team. Based on the constraints and limitations set forth by the customer in the request for proposal (RFP), the team formulated a mission that involved carrying a 1.5 kg payload that could travel 25 miles in 30 minutes or less. The contents of this payload may include blood samples, medicine, or vaccines. The purpose of transporting these contents with a UAS is to help alleviate the access barrier that many rural residents face when it comes to healthcare services. The focus of the design was centered on a 3D printed, electric powered, remotely piloted fixed-wing aircraft with vertical takeoff and landing (VTOL) capability. After plenty of research and a thorough down-selecting process, the team determined that the best design for the SpaceForce One aircraft was a flying wing tailsitter. After selecting the aircraft concept, the SpaceForce team focused on the sizing of the UAS based on historical data. The team knew that a lot of design aspects at this point were prone to change, but it was necessary to complete this step to move onto the more critical aspects of the design, like the propulsion system. The propulsion system was established in the following order: (1) APC 15x10e propeller, (2) Sunnysky 3525 520 KV brushless motor, (3) YEP 100 Amp electronic speed controller, and (4) Turnigy 3000 mAh 4S 40c lithium polymer battery. These components were based on the power required for a cruise, a thrust-to-weight ratio for VTOL, and the highest efficiency possible. The final aircraft propulsion system consisted of 4 pairs of each of these components, for a total of four thrust vectors. When it came to the aerodynamic analysis, XFLR5 was used intensively. The chosen airfoil was the MH106. The wing had a span of 1.79 m, with an aspect ratio of 4.71. Apart from the wing geometry, other key parameters that resulted from this analysis were CLcruise = 0.35 and αcruise = 5 degrees, where the desired cruise speed was 22.352 m/s. The stability of the aircraft was also analyzed in XLFR5, where it was discovered that the SpaceForce One was naturally stable longitudinally, but not in all of the lateral modes. The structural skeleton of the aircraft initially contained a combination of 3D-printed and carbon fiber parts. However, after structural testing, the 3D printed parts were replaced by aluminum and more carbon fiber parts Finally, the flight testing of the SpaceForce One aircraft consisted of three attempts, of which two of them achieved flight. The two times that the aircraft was airborne, physical components came off, which caused it to crash before transitioning from VTOL to cruise configuration.
  • 3. Table of Contents I Multiview of Assembled Aircraft 1 II Introduction 2 III Mission 2 III.A Mission Statement . . . . . . . . . . . . . . . . . . . . . . . . . . . . . . . 2 III.B Customers . . . . . . . . . . . . . . . . . . . . . . . . . . . . . . . . . . . 2 III.C Stakeholders . . . . . . . . . . . . . . . . . . . . . . . . . . . . . . . . . . 3 III.D Mission Profile . . . . . . . . . . . . . . . . . . . . . . . . . . . . . . . . 3 III.E Mission Requirements . . . . . . . . . . . . . . . . . . . . . . . . . . . . . 3 IV Concept Selection and Design 4 V Vehicle Sizing 6 VI Aerodynamics 8 VI.A Wing Design . . . . . . . . . . . . . . . . . . . . . . . . . . . . . . . . . . 8 VI.B Aerodynamic Performance . . . . . . . . . . . . . . . . . . . . . . . . . . 9 VII Stability 11 VII.A CG and NP Location . . . . . . . . . . . . . . . . . . . . . . . . . . . . . . 11 VII.B Longitudinal Static Stability . . . . . . . . . . . . . . . . . . . . . . . . . . 12 VII.C Lateral Static Stability . . . . . . . . . . . . . . . . . . . . . . . . . . . . . 13 VII.D Control Surface Sizing . . . . . . . . . . . . . . . . . . . . . . . . . . . . . 14 VIII Structures 15 VIII.A Internal Structure . . . . . . . . . . . . . . . . . . . . . . . . . . . . . . . 15 VIII.B Structural Limits . . . . . . . . . . . . . . . . . . . . . . . . . . . . . . . . 15 VIII.C Torsional Analysis . . . . . . . . . . . . . . . . . . . . . . . . . . . . . . . 16 VIII.D Skin Thickness Approximations . . . . . . . . . . . . . . . . . . . . . . . . . 17 VIII.E Wing Tip Deflection . . . . . . . . . . . . . . . . . . . . . . . . . . . . . . . 17 IX Propulsion 18 X Performance Results 22 X.A Structures and Propulsion Testing . . . . . . . . . . . . . . . . . . . . . . . 22 X.B Flight Test . . . . . . . . . . . . . . . . . . . . . . . . . . . . . . . . . . . 22 XI Conclusion 24
  • 4. I. Multiview of Assembled Aircraft The final design of the aircraft can be seen in Figures 1 and 2 below. As seen in Figure 1, the aircraft was designed using CATIA software, and the outer parts were made transparent to show the internal structure in the assembly. Figure 2 shows a beautiful picture of the SpaceForce One after completion and just before its maiden flight. Figure 1: Multiview of the SpaceForce One Aircraft CAD Model Figure 2: Photograph of the Completed Aircraft 1
  • 5. II. Introduction Today, unmanned aerial systems (UAS) are used for a variety of applications ranging from agriculture to combat. The rise of UAS also comes at a time where 3D printing capabilities are growing rapidly. The intersection of these two modern technologies yields an interesting opportunity. Implementing 3D-printing into aircraft manufacturing increases the capability for customization and overall construction efficiency. The SpaceForce One aircraft was designed as a 3D-printed UAS with the intent to take advantage of this technology and to help people in rural areas who have limited access to healthcare services. III. Mission A. Mission Statement When it comes to healthcare services, residents of rural areas in the United States face a variety of access barriers. Healthcare facilities in rural areas are small and often provide limited services. Rural residents have to travel greater distances to access specific services. SpaceForce is making an effort to solve this problem by building an electric powered, remotely piloted fixed-wing aircraft that can transport medical items to and from rural healthcare facilities inside a 1.5 kg payload box. Initially, the aircraft will focus on transporting blood samples, medicine, and vaccines. B. Customers The American Red Cross This organization has agreed to purchase aircraft produced by SpaceForce to provide healthcare services to underprivileged remote communities across the United States. Indiana Hospital Association This organization represents more than 170 hospitals in the state of Indiana. IHA has agreed to purchase aircraft produced by SpaceForce to further integrate this network of hospitals in Indiana. Other SpaceForce plans to expand to other rural areas in the US by the end of 2019. By the end of 2020, SpaceForce wants to be able to make an impact at the international level. To accomplish this, more improvements have to be made in terms of aircraft performance and the cost of production. 2
  • 6. C. Stakeholders Stakeholders are defined as the people, groups, or organizations that are actively involved or directly affected by the success or failure of this project. The stakeholders of this project are: Hospitals - They will be the ones directly using or operating the aircraft. Patients - They are affected by the proper operation of the aircraft system, since they rely on the aid that the aircraft system delivers. The failure of this system may result in negative health consequences to this stakeholder. Residents of the Operating Environment - It cannot be assumed that the aircraft will always be operating in an open field or uninhabited settings such as the environment the aircraft will be tested. The aircraft may be operated in a densely populated setting, and therefore the surrounding people and properties must be taken into account as well. Failure of the system to operate properly may result in the injury of residents or the damage of property in the operational settings. D. Mission Profile The mission profile of this aircraft includes a vertical takeoff up to a 15 meter height, transition to a fixed-wing configuration, climb to an altitude of about 61 meters (200 ft), cruise, descent to a height of 15 meters, transition back to the VTOL configuration, and land vertically in a circular area with a 3 meter diameter. The profile is represented graphically by Figure 3 below. Figure 3: Graphical Representation the Mission Profile E. Mission Requirements The SpaceForce team noted the needs that the RFP document outlined and considered those needs in reference to each stakeholder, in order to derive a list of requirements as shown in Table 1. They are broken up into three categories and are given a unique name. There is also a column that provides the technical areas through which each requirement will be verified. 3
  • 7. Table 1: SpaceForce One Requirements Category Name Description Verification REQ-PF-01 The aircraft must be able to take off and land on a circular area with a 3 meter diameter. Flight Test REQ-PF-02 The aircraft must be able to clear a 15 meter height during takeoff and landing. Flight Test REQ-PF-03 The aircraft must be able to safely carry a 1.5 kg rectangular payload with dimensions 100mm x 50mm x 20mm. Propulsion, Structures, Flight Test Performance REQ-PF-04 The aircraft shall cruise at a speed of at least 50 mph and an altitude of at least 200 feet. Propulsion, Structures, Aerodynamics, Flight Test REQ-PH-01 The aircraft shall be 3D additive manufactured. Structures REQ-PH-02 The aircraft’s wingspan must be less than six feet. Structures, Aerodynamics REQ-PH-03 The entire propulsion system must be electric. Propulsion REQ-PH-04 The aircraft must be able to be assembled and prepared for flight within 10 minutes. Flight Test Physical REQ-PH-05 Modular parts must be easily accessible for replacement or maintenance. Structures REQ-SW-01 The aircraft must be able to complete missions autonomously using waypoints loaded to a PixHawk flight controller. Dynamics and Controls, Flight Test REQ-SW-02 The flight controller must be able to switch between pilot and autopilot modes. Dynamics and Controls, Flight Test REQ-SW-03 The flight controller must be able to easily transition from a VTOL configuration to a fixed-wing configuration. Dynamics and Controls, Flight Test Software REQ-SW-04 The aircraft must be able to provide the operating pilot/team with telemetry data. Dynamics and Controls, Flight Test IV. Concept Selection and Design The SpaceForce team developed eight total concepts during the initial brainstorming sessions. These concepts were put through the Pugh’s method with the intent to narrow the selection process down. The eight concepts were judged by the team based on nine different criteria to select the top four concepts for further consideration. These four concepts can be seen in Figure 4. 4
  • 8. Figure 4: Quad-Rotor with a Front Propeller (Top-Left), Dual-Propeller Flying Wing (Top-Right), Tri-Rotor with Two Tilt propellers (Bottom-Left), Wing Quad-Rotor (Bottom-Right) The four concepts seen in Figure 4 were further analyzed in a weighted decision matrix. The SpaceForce team took time to set up a process to ensure the final concept selected was objectively the best choice. The importance and value of each criterion were quantified for the weighted decision matrix using the method illustrated in Figure 5. Figure 5: Weighted Decision Matrix Weight and Rating Method The highest scoring concept, and subsequently the concept selected, in the weighted decision matrix was the flying wing tail sitter (the top-right design in Figure 4). Though, it should be noted that the SpaceForce team went through multiple design iterations between this concept and the final product, which means that at this stage of the design process, the aforementioned model does not accurately represent the final design. Based on the decision matrix and preliminary analysis of the flying wing design, a few strengths and potential problems were noted by the SpaceForce team. The strengths were determined to be: low part count, low number of control inputs, and relatively low mass fraction. Some potential 5
  • 9. problems noticed in the design were: stability, transition viability, structural integration/reliability, and landing gear integration. With all this in mind and a concept selected, the SpaceForce team moved on to the sizing of the aircraft. V. Vehicle Sizing Sizing of the SpaceForce One was initially done through the use of historical data and a constraint analysis. Figure 6 shows the constraint graph for the SpaceForce One. This marked the starting point to the aircraft’s limitations, which were iterated upon later in the design process. Figure 6: Early Developed Constraints Graph As can be seen in Figure 6, SpaceForce compared wing loading and power loading. For the plane to function properly, it has to be able to handle both wing loading and power loading values in the yellow area of the graph. Further analysis of this graph shows that the constraining features of this plane are the loads during takeoffs, turns, and climb. Although, in later analysis, it was determined that this plane would have to handle even higher power loading values due to support its weight in vertical takeoff and landing. The weight sizing and mass fraction determinations were completed through the analysis of historical data and the interpolation of that data. From the historical data collected, a graph was created to further the effectiveness of the analysis [1–6]. This graph can be seen in Figure 7. 6
  • 10. Figure 7: Graph used to Determine Initial Sizing From Figure 7 the payload mass fraction of the plane was determined by interpolating between the range of values found in the historical data to the range dictated by the RFP (25 mi). The result of this interpolation can be seen displayed as a red dot and line in Figure 7. From this process, it was determined that the overall mass of the vehicle would be about 7.5 kg. Likewise, the battery mass fraction was determined to be 0.121, the empty mass fraction was determined to be 0.679, and the wing area and aspect ratio were 0.343 m2 and 9.7, respectively. Further initial size values are given in Table 2. Table 2: Initially Developed Physical Values Property Description Wingspan 1.8288 m (6 ft) Wing Area 0.343 m Aspect Ratio 9.73 Center Pod Diameter 0.25 m Wing Control Surfaces Elevons Payload Mounted at CG Pod Contents Fixed with Dual-Lock Strips The values in Table 2 were determined from a combination of historical data and analysis and changed throughout the design process. These values were not final and were an initial estimation based on the resources that were available. These values were used to further develop a working and conservative design. The final mass of the constructed design ended up being 6.5 kg with no payload and 8.0 kg with a 1.5 kg payload. 7
  • 11. VI. Aerodynamics A. Wing Design For the wing design, taper was decided against because the aircraft did not need to produce a very high CL during cruise, and induced drag was not a major concern. Additionally, the wing was produced in segments because of the 3D printer size, which meant that if the wing was tapered, a lot more unique segments would need to be designed just for the purpose of printing them. Dihedral was also not implemented in the wing design because of the roll moment that could be created from sideslip, even though dihedral could provide extra stability. The team initially considered a twisted swept wing with a high lift airfoil. However, it was discovered (based on the Northrop YB49 [7]) that critical problems appear with twisted swept wings. A large amount of twist was required to stabilize the wing because high-cambered airfoils are inefficient at generating negative lift. Approximately 12 degrees of twist angle with a sweep of more than 35 degrees was required. This pointed at a potential loss of stability in the presence of propeller wash with high stall speeds. Therefore, a null pitching moment airfoil with a larger chord was a better choice. The chosen airfoil design was the MH106. The primary criteria for the airfoil selection was max Cl/Cd because (Cl/Cd)2 needed to be as high as possible to reach the maximum range. The maximum Cl/Cd depended on the Reynolds number. Using a cruise airspeed of 22.53 m/s, 10 degrees Celsius air, and a chord width of 0.3 meters, the Reynolds number was calculated to be around 475,000 according to an equation: Re = ρvl µ (1) With the help of airfoil tools.com [8], the UIUC airfoil database was searched to find the airfoild with the largest Cl/Cd at a Reynolds number of 500,000. With SpaceForce’s configuration, camber could cause drifting during hover. Therefore, a maximum camber of one degree was considered in order to minimize such effect. The MH106 was selected as an airfoil because it was the only null pitching moment airfoil under one degree of camber with the largest Cl/Cd at a Reynolds number of 500,000. With MH106 airfoil, the wing sweep became irrelevant for its stability. However, a 25-degree sweep allowed for a longer center pod and a more flexible center of gravity adjustment. Although the wing was swept, any wing section parallel to the center-line of the aircraft was a non-distorted MH106 airfoil. 8
  • 12. B. Aerodynamic Performance Figures 8, 9, and 10 demonstrated that the maximum Cl/Cd for the MH106 airfoil occurred at an angle of attack of 5 degrees. This required a wing area of 0.698 m2 and a 0.388 m chord to cruise at 22.53 m/s, according to equations: L = 1 2 ρV2 Cl S (2) and S = cB (3) The drag for the wing was calculated to be 4.2 N according to the Cd drag equation: D = 1 2 ρV2 CdS (4) The center pod was an ellipsoid with a reference area of 0.05 m2 and a Cd of 0.06. The landing gear consisted of carbon plates with 20% reference area of the main wing and a Cd of 0.02. The total drag of the plane was calculated to be 5.44 N during cruise. Figure 9 demonstrated the maximum Cl of 1.17 at an angle of attack of 18.5 degrees which yielded at a stall speed of 13 m/s. Figure 9 showed that the wing was stable in the pitch axis. Figure 8: (Cl/Cd) Vs Alpha 9
  • 13. Figure 9: Cl Vs Alpha Figure 10: Cl Vs Cd 10
  • 14. The final wing characteristics and performance are summarized by Table 3 below. Table 3: Final Wing Characteristics VII. Stability A. CG and NP Location Two different methods were used to determine the center of gravity (CG) and neutral point (NP) of the SpaceForce One, with respect to the datum at the nose of the aircraft. The first method used the definition of the aircraft inertia in XFLR5. This means that each component of the aircraft was defined with its mass and its distance from the nose of the aircraft. After this, XFLR5 automatically calculated the aircraft’s CG and NP to be 0.264 m and 0.300 m, respectively. The second method involved the Cm vs α plot in XFLR5. The first step in this method was to make sure that the analysis in XFLR5 ignored the aircraft inertia. After this, the CG location was iterated until Cmα = 0 (i.e. a flat horizontal line appeared in the Cm vs α plot). When the slope of this curve became approximately zero, it meant that the location of the CG was at the neutral point. The resulting CG and NP using this method were 0.264 m and 0.296 m, respectively. It is important to keep in mind that both methods previously discussed were mere approximations, which is why the SpaceForce team decided to take an average of both results, for a final CG of 0.264 11
  • 15. m and a final NP of 0.298 m. Using these CG and NP values, the static margin for the aircraft was calculated to be about 8.763 % MAC, which was obtained with Equation 5. SM = XN P − XCG M AC (5) B. Longitudinal Static Stability There are 4 longitudinal modes of natural stability, but due to symmetry, only two types of oscillations are considered: short period and phugoid. The root locus shown in Figure 11 gives a clear representation of the eigenvalues that represent these oscillations on the real-imaginary plane. Since all the eigenvalues are on the left-hand plane (i.e. the real part of each of these eigenvalues is negative), it can be concluded that the aircraft is naturally stable in these modes of oscillation. Figure 11: Longitudinal Stability Eigenvalues When looking at the CM vs α curve, it became evident that the aircraft needed to be trimmed (i.e. elevon deflection during cruise) [9]. This is because the aircraft’s cruise speed and angle of attack were determined to be be 22.352 m/s (50 mph) and 5 degrees, respectively, but the CM vs α curve indicated a lower cruise α. With a positive elevon deflection during cruise, the necessary α can be achieved while keeping the aircraft stable. This can be seen in Figure 12 below. 12
  • 16. Figure 12: CM vs α with trimming such that αeq = αcruise = 5 degrees. C. Lateral Static Stability There are 4 lateral modes of natural stability, two of which are symmetric. Therefore, only three types of oscillations are considered: roll subsidence, dutch roll, and spiral. The root locus shown in Figure 13 gives a clear representation of the eigenvalues that represent these oscillations on the real-imaginary plane. Just by looking at the location of the eigenvalues in Figure 13, it can be seen that the only lateral mode in which the SpaceForce One is stable is roll subsidence. The real part of the dutch roll and spiral eigenvalues were positive and very close to zero. Because they were positive, the aircraft is naturally unstable in these modes of oscillation. The behavior stems from the fact that the SpaceForce One lacks any sort of vertical stabilizing system, such as winglets or a fin. The team decided not to make any physical additions to stabilize the aircraft in these modes due to other compromising issues that would arise, such as weight excess. For this reason, the aircraft’s differential thrust and control system will be the essential tools to compensate for this issue. In future iterations of the SpaceForce One, however, the team plans to make the aircraft naturally stable at least in the dutch roll mode. This is an important task to take on, because it increases the chances for the aircraft to recover in the case of a motor malfunction or other related issues. 13
  • 17. Figure 13: Lateral Stability Eigenvalues D. Control Surface Sizing Figure 14: Elevon Dimensions The control surfaces were sized primarily using historical data. From chapter 25 of the book, Basics of R/C Model Aircraft Design [10], it was discovered that a typical RC airplane has ailerons that cover the outer 40 percent of the rear quarter chord of the wings. Given the double functions of the elevons on the SpaceForce One aircraft, it was decided that the control surfaces should be larger, rather than smaller, than those on a similar airplane to achieve the desired control authority without risking control surface stall. Looking at the YB49 as a reference, it was seen that flying wings can fly with elevons sized similarly to conventional ailerons [7]. With that, the ailerons were sized to be the outer 60 percent of the trailing edge of the wing, starting from 3/4 chord to the trailing edge. These control surfaces are larger than those typically seen on existing full sized flying wings, but they are not large enough to be expected control or stability issues. 14
  • 18. VIII. Structures A. Internal Structure The most prominent structural challenge for SpaceForce One was the design of an internal structure, which could withstand the aerodynamic loads during flight. The most substantial, of these loads, being the moment where the root of the wing meets the internal components of the fuselage. In a previous iteration of the internal structure, 3D printed connectors were designed to connect the carbon fiber wing spars to the beams of the internal structure of the fuselage. A wing root moment test was run for this design, but the 3D printed components did not withstand the applied load of 5 N-m. Due to this failure, a new internal structure comprised of carbon fiber plates was designed. This design can be seen in Figure 15. Figure 15: Internal Structural Skeleton B. Structural Limits To find the envelope in which the aircraft could operate while keeping its structural integrity, some assumptions had to be made based on historical data. Based on similar aircraft and the team’s mission requirements, a turning radius of 50 meters was assumed. This gave a maximum bank angle of Φ = 45.53o, obtained through Equation 6. Φ = tan−1 ( V2 rg ) (6) The Load factor was then calculated to be n = 2.14, which includes a factor of safety of 1.5. This was obtained from Equation 7 n = 1 cosΦ ( f actor o f sa f ety) (7) Finally, the maximum lift in turning was calculated using Equation 8, which came out to be Lmax = 157.53N. 15
  • 19. Lmax = nW (8) Using this information, a Matlab code (1 was developed to obtain a visual representation of the aircraft’s structural envelope. This was based on the stall speed, the cruise speed, the load factor (previously calculated), and the historical data for a negative load factor limit. This envelope can be seen in Figure 16. Figure 16: Aircraft Limits C. Torsional Analysis A maximum angle of twist of 1 degree was set as the constraint for the torsional analysis performed. In order to calculate the angle of twist, SpaceForce needed to determine the torsional constant and the torque on the wing. Equation 9 was used to determine the torsional constant of 3.9172*10-8. J = 2.25 ∗ a4 outside − 2.25 ∗ a4 inside (9) Along with the torsional constant, the torque was needed to determine the twist angle. The torque was determined to be 49.8124 N-m through a conservative estimation of an integral along the wing of the vehicle. This estimation involved dividing the wing into several parts and finding the torque of each part and then summing those torque values. After the torque was determined, a value of 1.2554 degrees was calculated for the angle of twist from Equation 10. 16
  • 20. φ = T ∗ b 2 G ∗ J (10) This was not below the desired value of 1 degree, but considering that the estimation used for torque was conservative and that the 1.2554 degrees, if accurate, would still not cause torsion to be the wings first cause of failure, this value was accepted. D. Skin Thickness Approximations In order to derive a thickness for the skin of the wing, SpaceForce approximated the cross-section of the airfoil as a wing box shown in Figure 17. Figure 17: Wing Box, Approximation of the Wing In this theoretical approximation, the height was 40 mm and the chord was 300 mm. In order to approximate a sufficient skin thickness, the value of the thickness was iterated until the stress experienced due to the bending moment was less than the yield stress of the material used for the skin of the wing. The equation for this stress is expressed below, where the I is the area moment of inertia and is a function of the thickness of the skin. σ = M ∗ y I (11) A skin thickness of 0.6 mm was determined for the wing. This was based on the above approximation and the yield stress of the PLA material used to construct the wing. E. Wing Tip Deflection The maximum deflection of the wing tip was a crucial value for SpaceForce to calculate because it was further used to make sure that the aircraft did not fail due to the deflection of its wings during flight. To find the wing deflection, it was assumed that the front wing spar could be idealized as a cylindrical rod fixed to a wall, as shown in Figure 18. 17
  • 21. Figure 18: Wing spar idealization for the purpose of finding wing deflection Because there are two spars in the wing, the assumption that the front spar experiences half of the total load was made. The length of the rod was 775 mm and the maximum force, represented by F in Figure 18 to be experienced by the rod was 55.125 N. To solve for the maximum wing deflection and the deflection slope, the following equations were used. δ = F ∗ L3 3 ∗ E ∗ I (12) θ = F ∗ L2 2 ∗ E ∗ I (13) In these equations, E is the modulus of elasticity of the carbon fiber rod, and I is the moment of inertia of the cross-section. Using these equations, the max deflection was found to be 4.5 cm, and the deflection slope was found to be 5o. IX. Propulsion This vehicle has both vertical flight and horizontal flight modes that needed to be considered for the Propulsion Sizing. For vertical flight, it was well established that a quad-rotor with decent handling capabilities had a minimum thrust to weight ratio of around 1.8-2.0. This meant that each of the four propellers on the vehicle needed to sustain 36.8 newtons of thrust for the duration of takeoff and landing. For cruise, each propeller needed to sustain 1.3 newtons of thrust. The first step in propulsion sizing was picking a propeller. Because the layout required two pairs of counter-rotating propellers, APC and Master Airscrew were the only manufacturers who had a usable selection of propellers with data to use. Of the propellers considered, the only set of counter-rotating propellers, that provided around 70 percent cruise efficiency while not exceeding 2235 Watts during hover, was the APC 15x10e [11]. Using Figures 19, 20, and 21, the thrust and power values were calculated from the points marked with red x’s, using the following equations: 18
  • 22. J = v nd (14) Thrust = Ct ∗ ρ ∗ n3 ∗ d4 (15) Power = Cp ∗ ρ ∗ n3 ∗ d5 (16) Where n is the rotations per second of the propeller. Figure 19: Ct Vs J 19
  • 23. Figure 20: Cp Vs J Figure 21: Efficiency Vs J This specific propeller requires 1230.4 watts at 7000 RPM to achieve the required 1.8-2.0 thrust-to- weight ratio. Using the same Ct Vs J plot (Figure 19) and CP Vs J plot (Figure 20), the power required for cruise was found to be 38.45 watts per propeller at 4250 RPM. With the required power and RPM for both takeoff and cruise, the motor could be selected. The three primary criteria for selecting the motor were a low no-load current, power capability, and the correct resistance and KV to achieve the desired RPM. A low no-load current was important for efficiency, given the torque equation: 20
  • 24. Torque = Kt(I − I0) (17) Where Kt = 1/KV (18) The efficiency of a motor at low power output can be extrapolated to be approximately the ratio of the total current minus the no-load current over the total current. This means that lower no-load current would result in higher efficiency. Power capability was important because a motor that cannot handle the power requirements would burn out and fail. The resistance and KV both determined how fast the motor would spin at 100 % throttle, given the assumed 14.8v battery and power requirement from the propeller data, as shown in the equation: Rpm = Kv(V − I ∗ Rm) (19) With all the requirements listed, the Sunnysky 3525 520Kv motor was selected [12]. It could handle the power requirement and it had the right KV and IR to provide the right thrust for hover. These motors were paired with the YEP 100 Amp electronic speed controllers [13], because the calculated current draw was found to be 97 Amps using the aforementioned equations. For the power supply, four Turnigy 3000mAh 4s 40c lithium polymer batteries were chosen based on the following criteria: • Calculated motor power draw • 30 minute cruise time • A 10 percent overhead to provide 45 seconds of takeoff and landing time • 80 % battery discharge rule in addition to the 20 % overhead for maneuvering and wind Individually, each of the four motors weighed 243 g, each of the four ESCs weighed 81 g, and each of the four batteries weighed 330 g, leading to the overall propulsion system weight of 2616 g. Altogether, the cruise efficiency came out to be 43 % with 74 % propeller efficiency and 58 % motor efficiency. The propeller efficiency was acceptable. However, the motor efficiency was lower than expected for tje brushless motor setup. The reason for this was the fact that the cruise thrust was 1/28 the vertical takeoff thrust. A motor that can handle the cruise thrust with 85-90 % efficiency likely would not survive putting out 28 times as much thrust. While a motor large enough to handle the takeoff loads would have a high no-load current and low efficiency at low power outputs. All considered, the final setup was the most efficient setup that was found after many hours of searching. 21
  • 25. X. Performance Results A. Structures and Propulsion Testing Prior to the final flight test, performance tests were conducted to confirm the structural strength of the vehicle as well as the adequacy of the propulsion system. For the structural components test, the primary concern was the strength of the connectors which handled the bending moment of the wings. In order to replicate the conditions of the wingtip test, a 5-pound weight was placed at the end of the wing spar held up only by the connection device. Initial attempts with plastic joints failed immediately. The final clamp design was easily able to pass the test. For the propulsion system, two tests were conducted. The first test was a no-load test to determine the motor’s true cruise efficiency. The second test was conducted to determine the maximum static thrust. The no-load test showed that the motor current draw at no-load was only 1.2 amps as opposed to the expected value of 1.8 amps. The motor efficiency was actually 68 percent during a cruise, instead of 58 percent. This increased the overall efficiency from 43 to 50 percent. The thrust stand test showed a maximum thrust of 3.16 kg. However, it was determined that the thrust stand was only measuring 85 percent of the overall thrust. Diving 3.16 kg by 0.85, it resulted in a true thrust of 3.717 kg of thrust which gave the vehicle a total thrust of 32.72 pounds. B. Flight Test The flight test plan for the SpaceForce One can be seen in Figure 22 below. The location of the flight tests was MacAllister Park in Lafayette, IN. Figure 22: XFLR5 aircraft masses with coordinate system. 22
  • 26. Attempt #1 The first attempt took place on the 11th of December. During the vertical takeoff, everything was stable and functioning properly. After about five seconds of hovering, it seemed like the aircraft attempted to transition on its own. However, an instant later, one of the propellers came off, causing the aircraft to tilt over and head towards the ground. The impact completely destroyed the pod. Nothing else was damaged, and the SpaceForce team planned for another attempt later in the week. Attempt #2 The second attempt to fly took place on the 13th of December at the same location, which wasn’t the best day to fly as it was raining. When the vertical takeoff was attempted, the plane could not get off the ground. Rather, it fell on its back and one of the propellers hit the ground, which damaged the motor mount. The team was able to fix this within a few minutes, but decided not to attempt another takeoff, since an electrical malfunction was suspected and could have affected the control inputs. Attempt #3 The third test flight was performed on 14th of December. During the vertical takeoff, the aircraft soared up at a fast speed in an effort to transition to cruise configuration at a high altitude for safety purposes. The takeoff was very promising, until pieces of the carbon fiber internal structure came off due to vibrations, hitting one of the propellers. This caused propeller to break one of the carbon fiber rods that held one of the motors. The aircraft then fell from the sky and landed right-side up. Although the landing was impressive, the aircraft damage was beyond repairable and it concluded the final flight test. Data from Attempt #3 was retrieved from the flight controller, and through a MATLAB code, the plots shown in Figures 23 and 24 were obtained. Figure 23: Aircraft 2D and 3D Trajectory from Test Flight 23
  • 27. Figure 24: Time History of Aircraft Altitude and Horizontal Speed from Test Flight XI. Conclusion The goal of the SpaceForce One was to transport medical supplies to rural, less connected hospitals in a 25 mile radius, within a 30 minute time frame. The SpaceForce team iterated through each part of the design process in order to develop the best aircraft that would solve the problem presented. Sizing, aerodynamics, stability, structures, and propulsion were all thoroughly analyzed in order to successfully deliver on the defined problem. Multiple tests were performed prior flight, which served as a proof of concept and allowed the team to move forward with flight. The SpaceForce team attempted three flights with mild success. The SpaceForce One took off and hovered, but failed before transitioning into cruise configuration. The flight was semi-successful and with more time, the SpaceForce team is confident that the aircraft would be able to fully and successfully complete the mission. If given more time, the SpaceForce team would perform even more tests on the aircraft, such as a wind tunnel test, more structural testing, propulsion testing, vibration testing, and more. The team is confident that the implementation of this further testing would result in a fully successful flight. The SpaceForce team is currently about one full plane iteration away from being comfortable with the final product, but under the given time constraints, this first iteration can be seen as a partial success. Once the SpaceForce One flawlessly soars through the skies, the SpaceForce Team will not let it fly alone for long, because the SpaceForce Two is coming soon. 24
  • 28. Appendix I: Request for Proposal Design of a Fixed-Wing UAS for Medical Device Delivery Background: Small, affordable, easily launched remotely piloted Unmanned Aerial Systems (UAS) are of great interest to both civil (e.g., public safety, hazard monitoring), commercial (e.g., crop observation, cargo delivery), and military (e.g., surveillance, communications) sectors. While some of these systems will be on quadrotor platforms, to achieve the range and speed needed for select missions, more efficient fixed-wing aircraft are needed. Many of the small UAS (sUAS) are manufactured with model airplane techniques imposing constraints on the design. The use of additive manufacturing (3D printing) will allow customizable UAS optimized for a given mission. The Design Challenge: Your challenge is to design, build, and flight test a 3D additive manufactured, electric powered, remotely piloted fixed-wing aircraft that can satisfy the following mission requirements. The aircraft must be able to climb to at least 200 feet, deliver a medical payload, record flight telemetry (position, altitude and velocity) and must be able to be recovered and re-launched with no damage. The aircraft may not make use of wheeled landing gear. The footprint of the launch and landing area is 3 m in diameter. The UAS must clear a 15 m height within the diameter. That is, the launch area is a 3m diameter cylinder 15 m high. The medical payload is defined as a rectangular box up to 100 mm x 50 mm x 20 mm and 1.5 kg. The UAS must be able to travel 25 miles in 30 minutes or less. The aircraft must be able to be controlled autonomously by a PixHawk autopilot. Flight Test Overview and Design Constraints: Flight test of your sUAS solution must be safely demonstrated outdoors at the airfield in McAllister Park, Lafayette, IN. The vehicle should be stable under all flight conditions. More specifically:  It must demonstrate ease of deployment and flight: o Be able to set-up and assemble/present for flight to the pilot in the field within 10 minutes o Be able to commence flight from a stationary position under its own power o Exhibit features of modularity and proper access to accommodate future swapping of payloads and/or different batteries o Be able to safely operate without damage from launch or recovery mission phases o Be easy to fly for the remote pilot by demonstrating Level 1 flying qualities and a pilot-operated switch to autopilot mode(s)  It must demonstrate the ability to record flight telemetry. Any deviations must be formally requested in writing to the customer and justified using sound engineering and business logic. 3m 15m i
  • 29. Appendix II: Additional Supporting Figures Concept Selection and Design Figure 25: The Flying Wing Basic Initial Design Aerodynamics Figure 26: Speed vs α when cruise lift is fixed ii
  • 30. Stability Figure 27: XFLR5 aircraft masses with coordinate system. Figure 28: Longitudinal Stability - Short Period Speed Variations. iii
  • 31. Figure 29: Longitudinal Stability - Short Period Pitch Rate and Angle. [ Figure 30: Longitudinal Stability - Phugoid Speed Variations. iv
  • 32. Figure 31: Longitudinal Stability - Phugoid Pitch Rate and Angle. Figure 32: Lateral Stability - Roll Damping Speed Variation and Roll Rate. v
  • 33. Figure 33: Lateral Stability - Roll Damping Yaw Rate and Heading Angle. Figure 34: Lateral Stability Dutch Roll Speed Variation and Roll Rate. vi
  • 34. Figure 35: Lateral Stability Dutch Roll Yaw Rate and Heading Angle. Figure 36: Lateral Stability - Spiral Speed Variation and Roll Rate. vii
  • 35. Figure 37: Lateral Stability - Spiral Yaw and Roll Rate. Structures Figure 38: Bending Moment Diagram at αmax and Vcruise viii
  • 36. Figure 39: Lift Distribution at Maximum Wing Loading Propulsion Figure 40: Sunnysky 3525 520kv Brushless Motor [12] ix
  • 37. Figure 41: Yep 100a 6s ESC [13] Figure 42: Turnigy 4000mAh 4s 40c Lipo [14] x
  • 38. Appendix III: Additional Supporting Tables Concept Selection and Design Table 4: Pugh’s Matrix This Pugh’s Matrix, Table 4, was used early in the concept selection process to select 4 final concepts from the original 8 concepts, that were developed through brainstorming. xi
  • 39. Table 5: Weighted Decision Matrix This Weighted Decision Matrix, Table 5, was used in the concept selection process in order to select the final concept, from which the rest of the project would be based on. This concept was selected from a choice of 4 concepts previously chosen from the Pugh’s Matrix. xii
  • 40. Vehicle Sizing Table 6: Inputted Values Used to Create the Constraint Graph Inputs Constraint Constants Takeoff Maximum Speed Landing Ceiling Rate of Climb Turns AR 9.738 9.738 9.738 9.738 9.738 9.738 9.738 Cd0 .03 .03 .03 .03 .03 .03 .03 e .8 .8 .8 .8 .8 .8 .8 Prop Efficiency .7 .7 .7 .7 .7 .7 .7 Motor Efficiency .8 .8 .8 .8 .8 .8 .8 Alt (m) NA 0 60 0 120 45 60 Vel (m/s) NA NA 22.352 22.352 NA NA 22.352 Clmax NA 1.2 NA NA NA NA NA landing Dist. (m) NA NA NA NA NA NA NA Density (kg/m^3) NA NA NA NA 1.225 1.225 1.225 Load Factor NA NA NA NA NA NA 2 Takeoff Dist. (m) NA 15 NA NA NA NA NA Table 6 shows the values that were used in the preliminary constraining of SpaceForce’s aircraft. These values were preliminary estimations based on historical data. These values helped the team find a starting point from which they expanded their design. xiii
  • 41. Table 7: Historical Data used to Estimate Mass Fraction Plane Payload Mass Fraction Battery Mass Fraction Range (mi) Cornell AUVSI SUAS 2018 0.303 NA 15.5 Raven RQ11 0.09 NA 50 Talon 120LE 0.1136 NA 45 Technion AUVSI SUAS 2018 NA 0.2 NA Sherbrooke AUVSI 2017 0.33 NA 21 Cornell AUVSI SUAS 2017 0.3096 NA 15.5 Table 7 is data that was used in order to create the graph used to find a reasonable payload mass fraction early in the design[1–6]. This then lead to the calculation of a reasonable expected mass of the entire aircraft. xiv
  • 42. Stability Table 8: XFLR5 aircraft inertia definition and resulting CG and NP. Component Mass (kg) x (m) y (m) z (m) CG (m) NP (m) Batteries 1.320 0.300 0.000 0.000 0.264 0.300 Motor 1 0.243 0.050 0.320 0.000 Motor 2 0.243 0.050 - 0.320 0.000 Motor 3 0.243 0.050 0.000 0.320 Motor 4 0.243 0.050 0.000 -0.320 Payload 1.500 0.264 0.000 0.000 ESC 1 0.058 0.235 0.000 0.000 ESC 2 0.058 0.230 0.000 0.000 ESC 3 0.058 0.225 0.000 0.000 ESC 4 0.058 0.220 0.000 0.000 Pod 1.133 0.230 0.000 0.000 Pixhawk 0.080 0.000 0.000 0.000 Table 9: Eigenvalues of the Longitudinal Stability Modes Longitudinal Stability Modes Modes Eigenvalue Short Period −7.734 − 16.34i Short Period −7.734 + 16.34i Phugoid −0.01067 − 0.4114i Phugoid −0.01067 + 0.4114i Table 10: Eigenvalues of the Lateral Stability Modes Lateral Stability Modes Modes Eigenvalue Roll Subsidence −14.66 Dutch Roll 0.03922 − 0.8676i Dutch Roll 0.03922 + 0.8676i Spiral 0.05918 xv
  • 43. Appendix IV: Matlab Code Listing 1: Matlab Script for V-n Diagram (Structures) 1 2 3 %%%%%%%%%%%%%%%%%%%%%%%%%%%%%%%%%%%%%%%%%%%%%%%%%%%%%%%%%%%%%% 4 % 5 % SpaceForce V-n Diagram Code 6 % 7 % Ernesto Ramirez 8 % Benjamin Ye 9 % Cody Foss 10 % Yuhan Roh 11 % Colfax Putt 12 % 13 %%%%%%%%%%%%%%%%%%%%%%%%%%%%%%%%%%%%%%%%%%%%%%%%%%%%%%%%%%%%%% 14 clear;clc; 15 16 v = (0:35); 17 r = 15; 18 g = 9.81; 19 20 21 phi = atan(v.^2./(r*g)); 22 n_pos = 1./cos(phi)-1; 23 n_neg = -1./cos(phi)+1; 24 n_lim_pos = linspace(2.14,2.14,36); 25 n_lim_neg = linspace(-2,-2,36); 26 v_max = linspace(22.352,22.352,36); 27 v_stall = linspace(14.5,14.5,36); 28 n_cons = linspace(-5,10,36); 29 30 plot(v,n_pos,'k',v,n_neg,'k') 31 ylim([-5,6]) 32 xlim([0,35]) 33 hold on 34 plot(v,n_lim_pos,'--r',v,n_lim_neg,'--r',v_max,n_cons,'--r', ... v_stall,n_cons,'--r') 35 title('V-n Diagram') 36 xlabel('V [m/s]') 37 ylabel('n') 38 grid on xvi
  • 44. Listing 2: Matlab Script for Flight Test Performance 1 %%%%%%%%%%%%%%%%%%%%%%%%%%%%%%%%%%%%%%%%%%%%%%%%%%%%%%%%%%%%%% 2 % 3 % SpaceForce Aircraft Flight Test Performance Code 4 % 5 % Ernesto Ramirez 6 % Benjamin Ye 7 % Cody Foss 8 % Yuhan Roh 9 % Colfax Putt 10 % 11 %%%%%%%%%%%%%%%%%%%%%%%%%%%%%%%%%%%%%%%%%%%%%%%%%%%%%%%%%%%%%% 12 clear;clc; 13 14 load('data') 15 time = GPS(1:85,1)./1000; %[seconds] 16 latitude = GPS(1:85,8); %[degrees] 17 longitude = GPS(1:85,9); %[degrees] 18 altitude = GPS(1:85,10); %[m] 19 horizontal_speed = GPS(1:85,11); %[m/s] 20 21 figure 22 plot(longitude,latitude,'LineWidth',2) 23 title('Lateral Trajectory') 24 xlabel('Longitude [deg]') 25 ylabel('Latitude [deg]') 26 grid on 27 28 figure 29 plot(time,altitude,'r','LineWidth',2) 30 title('Altitude') 31 xlabel('Time [s]') 32 ylabel('Altitude [m]') 33 grid on 34 35 figure 36 plot3(longitude,latitude,altitude,'-m','LineWidth',2); 37 title('3-Dimensional Trajectory') 38 xlabel('Longitude [deg]') 39 ylabel('Latitude [deg]') 40 zlabel('Altitude [m]') 41 grid on 42 43 figure 44 plot(time,horizontal_speed,'-k','LineWidth',2) 45 title('Horizontal Speed') 46 xlabel('Time [s]') 47 ylabel('Speed [m/s]') 48 grid on xvii
  • 45. Appendix V: Schedule Figure 43: Gantt Chart xviii
  • 46. Acknowledgments The SpaceForce team thanks Prof. Sullivan, Phil R. Baldwin, and Yao Sun for providing their time and efforts to helping the team design, build, and test the SpaceForce One aircraft. The team would also like to thank Purdue University for allowing the use of their facilities to fabricate the aircraft. References [1] “Cornell University Unmanned Air Systems 2018 AUVSI SUAS Competition Theia II Technical Design,” AUVSI SUAS 2018 Journals, 2018. URL http://www.auvsi-suas.org/static/competitions/ 2018/journals/auvsi_suas-2018-journals-cornell_university.pdf. [2] “UAS: RQ-11B Raven,” 2018. URL https://www.avinc.com/uas/view/raven. [3] “Talon Series Fixed Wing Unmanned Aircraft Systems,” UAV Solutions, 2016. URL http://uav-solutions.com/wp-content/uploads/2016/05/Fixed-Wing-Brochure-4- 21-2016-Full.pdf. [4] “Technical Design Paper Vamudes - Universite De Sherbrooke,” AUVSI SUAS 2017 Journals, 2017. URL http://www.auvsi-suas.org/static/competitions/2017/journals/auvsi_ suas-2017-journals-universite_de_sherbrooke.pdf. [5] “Cornell University Unmanned Air Systems 2017 AUVSI Student UAS Competition,” AUVSI SUAS 2017 Journals, 2017. URL http://www.auvsi-suas.org/static/competitions/2017/journals/ auvsi_suas-2017-journals-cornell_university.pdf. [6] “Technion Aerial Systems 2018 Technical Design Paper for AUVSI Student-UAS Competition,” AUVSI SUAS 2018 Journals, 2018. URL http://www.auvsi-suas.org/static/competitions/2018/ journals/auvsi_suas-2018-journals-technion_israel_institute_of_technology. pdf. [7] “Northrop YB-49,” National Museum of The US Air Force, 2015. URL https: //www.nationalmuseum.af.mil/Visit/Museum-Exhibits/Fact-Sheets/Display/ Article/858861/northrop-yb-49/. [8] “Airfoil Database Search,” 2018. URL http://airfoiltools.com/. [9] Murman, E., “Introduction to Aircraft Performance and Static Stability,” MIT OpenCourseWare, 2003. URL https://ocw.mit.edu/courses/aeronautics-and-astronautics/16-885j- aircraft-systems-engineering-fall-2004/lecture-notes/aircraft_murman.pdf. [10] Lennon, A., Basics of R/C Model Aircraft Design: Practical Techniques for Building Better Models, 1st ed., Motorbooks Intl, Minneapolis, 1996, Chap. 25. [11] “Performance Data,” 2018. URL https://www.apcprop.com/technical-information/ performance-data/f. [12] “SUNNYSKY X3525 BRUSHLESS MOTORS,” 2018. URL https://sunnyskyusa.com/ products/sunnysky-x3525-brushless-motors-520kv-880kv?variant=45197935887. xix
  • 47. [13] “YEP 100A (2 6S) SBEC Brushless Speed Controller,” 2018. URL https://hobbyking.com/ en_us/hobbyking-yep-100a-2-6s-sbec-brushless-speed-controller.html?gclid= CjwKCAjwmJbeBRBCEiwAAY4VVRKyHyKpwylClzzQXhJ4vpdUuzofrGS-hnAtMJpBNEh5R2G0EDIX- RoC640QAvD_BwE&gclsrc=aw.ds. [14] “Turnigy 3000mAh 4S 40C Lipo Pack w/XT-60,” 2018. URL https://hobbyking. com/en_us/turnigy-battery-3000mah-4s-40c-lipo-pack-xt-60.html?gclid= CjwKCAjwmJbeBRBCEiwAAY4VVab1g4T5cZZH8EnRp1EiEhP7ES0qd1JqjveDgAg1i_ z8wH5r86b3MBoCLlYQAvD_BwE&gclsrc=aw.ds. xx