Download to read offline


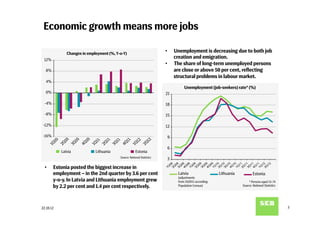
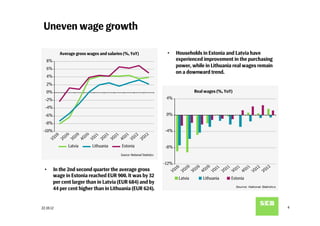
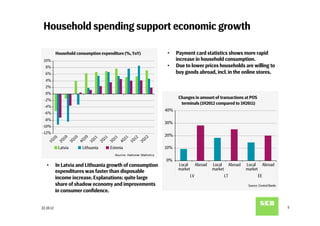
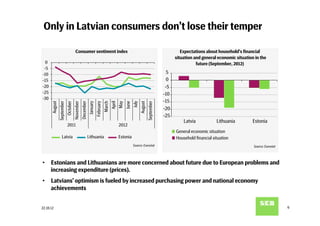


- Unemployment is decreasing in the Baltic states due to job creation and emigration. However, long-term unemployment remains high, reflecting structural problems. - Wages have grown the most in Estonia, exceeding Latvia and Lithuania by 30-40%. However, real wage growth has been negative in Lithuania. - Household spending has supported economic growth, indicated by rising payment card usage. However, consumers in Estonia and Lithuania are more concerned about the future due to European issues.


