Download to read offline

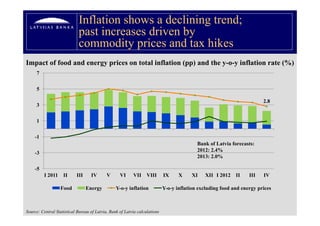
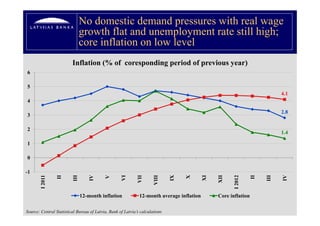
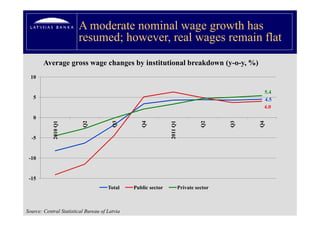
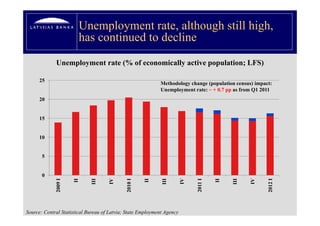
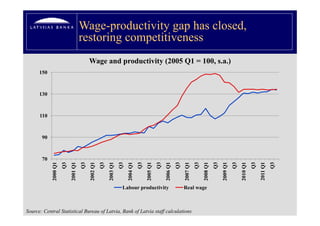
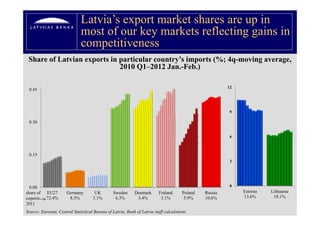
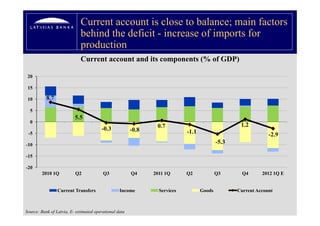
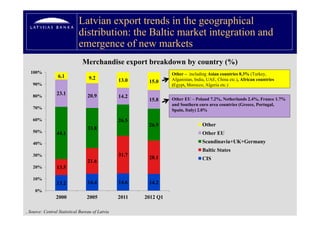
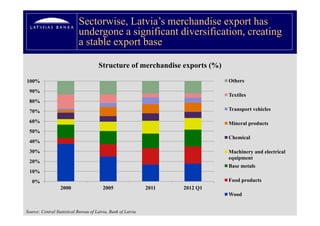
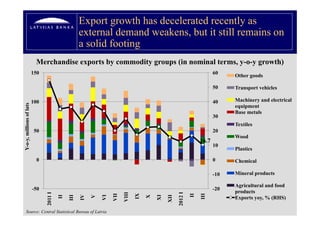
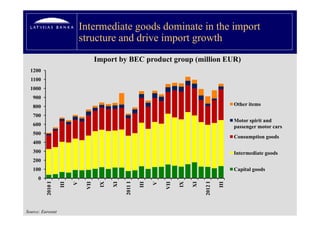
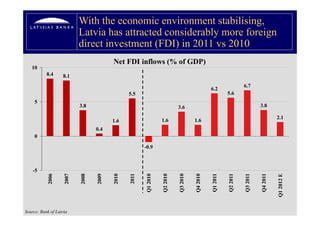
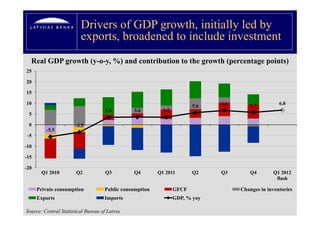
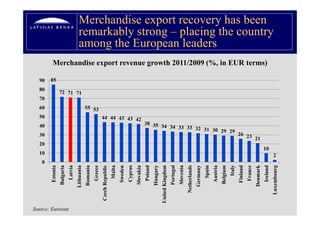
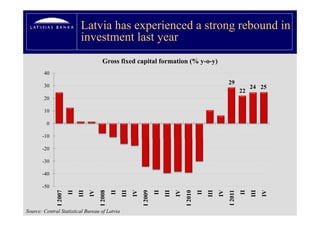
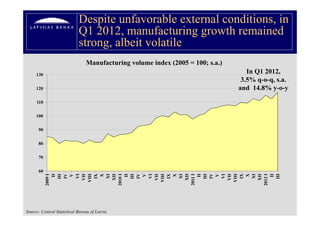
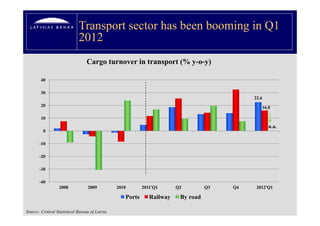
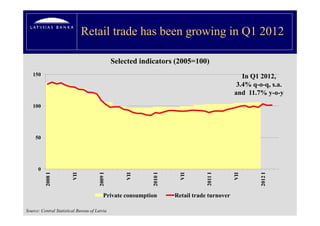
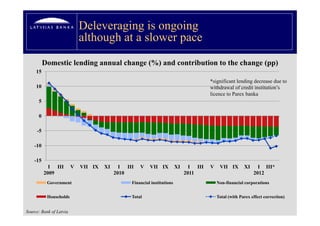
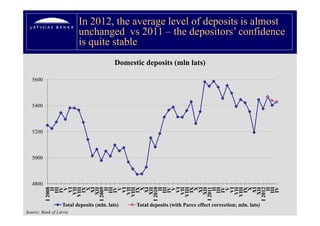
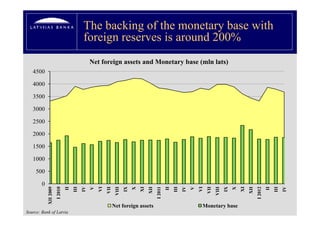
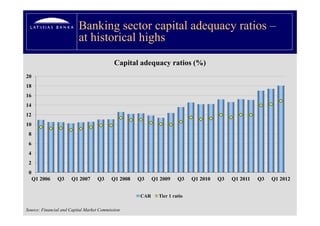
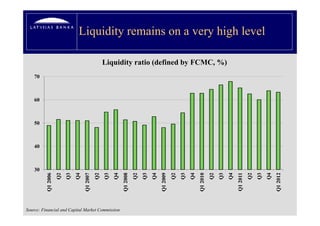
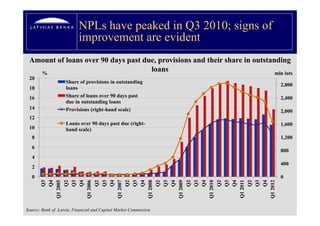
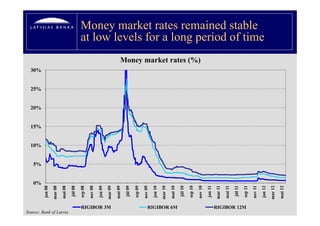

The document provides an overview of Latvia's economic developments as of May 2012, highlighting a decline in inflation, steady unemployment rates, and moderated wage growth amidst stagnant real wages. It notes improvements in competitiveness through a narrowed wage-productivity gap and stronger export shares in key markets, despite a decline in export growth due to weakening external demand. Additionally, the report details increased foreign direct investment and high banking sector capital adequacy, alongside stable monetary conditions and improving indicators in the transportation and retail sectors.


