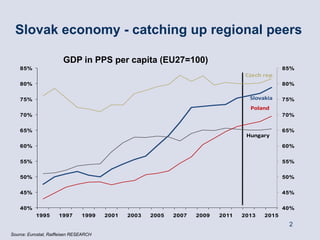
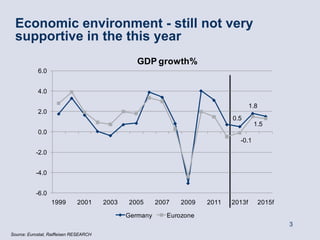
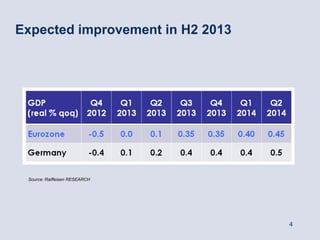
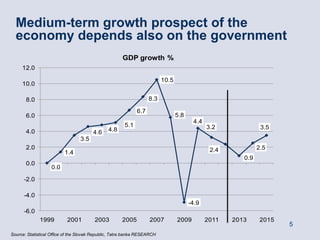
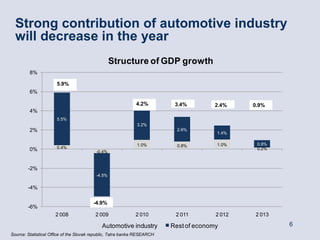
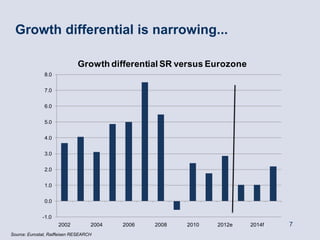
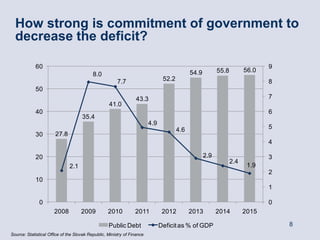
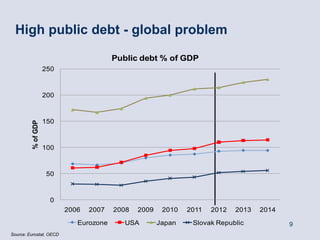
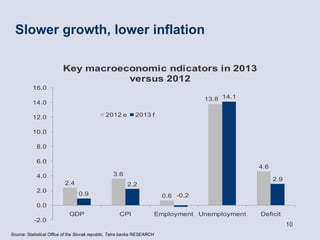
Slovakia Outlook 2013


Róbert Prega, Tatra banka
Chief economist
Slovak economy - catching up regional peers

                        GDP in PPS per capita (EU27=100)
    85%                                                                                         85%
                                                                                   Czech rep.
    80%                                                                                         80%


    75%                                                                             Slovakia    75%
                                                                                    Poland
    70%                                                                                         70%


    65%                                                                                         65%
                                                                                   Hungary
    60%                                                                                         60%


    55%                                                                                         55%


    50%                                                                                         50%


    45%                                                                                         45%


    40%                                                                                         40%
           1995       1997      1999    2001   2003   2005   2007   2009   2011   2013   2015
                                                                                                 2
Source: Eurostat, Raiffeisen RESEARCH
Economic environment - still not very
  supportive in the this year
                                                  GDP growth%
            6.0


            4.0

                                                                                      1.8
            2.0
                                                                              0.5
                                                                                       1.5
            0.0
                                                                                -0.1
           -2.0


           -4.0


           -6.0
                  1999        2001      2003   2005      2007   2009   2011   2013f         2015f

                                               Germany      Eurozone
                                                                                                    3
Source: Eurostat, Raiffeisen RESEARCH
Expected improvement in H2 2013


 Source: Raiffeisen RESEARCH


                                  4
Medium-term growth prospect of the
  economy depends also on the government
                                                      GDP growth %
     12.0

                                                                          10.5
     10.0

       8.0                                                         8.3

                                                             6.7
       6.0                                                                       5.8
                                                                                        4.4
                                                       5.1                                    3.2              3.5
       4.0                              4.6    4.8
                                  3.5
       2.0                                                                                     2.4            2.5
                          1.4
                                                                                                        0.9
       0.0
                   0.0

      -2.0

      -4.0
                                                                                       -4.9
      -6.0
              1999         2001          2003         2005          2007         2009         2011   2013      2015
                                                                                                                      5
Source: Statistical Office of the Slovak Republic, Tatra banka RESEARCH
Strong contribution of automotive industry
  will decrease in the year
                                                  Structure of GDP growth
         8%

                      5.9%
         6%

                                                              4.2%         3.4%         2.4%    0.9%
         4%
                      5.5%
                                                              3.2%
         2%                                                                 2.6%
                                                                                        1.4%

                                                              1.0%          0.8%        1.0%     0.8%
         0%           0.4%                                                                       0.2%
                                          -0.4%


        -2%
                                          -4.5%

        -4%

                                         -4.9%
        -6%
                      2 008               2 009              2 010         2 011        2 012   2 013

                                             Automotive industry          Rest of economy               6
Source: Statistical Office of the Slovak republic, Tatra banka RESEARCH
Growth differential is narrowing...

                              Growth differential SR versus Eurozone
               8.0


               7.0


               6.0


               5.0


               4.0


               3.0


               2.0


               1.0


               0.0


              -1.0
                     2002           2004   2006   2008   2010   2012e   2014f   7
Source: Eurostat, Raiffeisen RESEARCH
How strong is commitment of government to
  decrease the deficit?

             60                                                                                                               9
                                                                                             54.9         55.8         56.0
                                           8.0
                                                        7.7                     52.2                                          8
             50
                                                                  43.3                                                        7
                                                   41.0
             40                                                                                                               6
                                     35.4
                                                                         4.9
                                                                                       4.6                                    5
             30        27.8
                                                                                                                              4

             20                                                                                     2.9                       3
                                                                                                                 2.4
                              2.1                                                                                       1.9
                                                                                                                              2
             10
                                                                                                                              1

               0                                                                                                              0
                      2008           2009          2010          2011           2012         2013         2014         2015

                                                   Public Debt                 Deficit as % of GDP                                8
Source: Statistical Office of the Slovak Republic, Ministry of Finance
High public debt - global problem

                                        Public debt % of GDP
                    250


                    200


                    150
         % of GDP


                    100


                     50


                      0
                          2006   2007   2008   2009    2010   2011   2012   2013   2014

                             Eurozone      USA        Japan    Slovak Republic            9
Source: Eurostat, OECD
Slower growth, lower inflation

                         Key macroeconomic ndicators in 2013
                                    versus 2012
          16.0
                                                                                      13.8 14.1
          14.0

          12.0                                 2012 e        2013 f

          10.0

            8.0

            6.0
                                                                                                    4.6
            4.0                                   3.6
                                                                                                          2.9
                          2.4                            2.2
            2.0
                                 0.9                                       0.6 -0.2
            0.0
                             GDP                     CPI                  Employment Unemployment   Deficit
           -2.0
                                                                                                                10
Source: Statistical Office of the Slovak republic, Tatra banka RESEARCH
Summary


• Eurozone debt crisis is not by far fixed and risk of another
  turmoil on the market is still very material

• ECB will remain key stabilisation factor

• Eurozone will be still on the verge of recession in H1 2013
  with prospect of gradual recovery in H2 2013 and 2014

• Growth perspective for Slovak economy determined by
  Eurozone a economic policy of government in medium
  term
                                                                 11
Thank you for attention.


                           12

Tax Seminar 2013 - Outlook by Robert Prega

  • 1.
    Slovakia Outlook 2013 RóbertPrega, Tatra banka Chief economist
  • 2.
    Slovak economy -catching up regional peers GDP in PPS per capita (EU27=100) 85% 85% Czech rep. 80% 80% 75% Slovakia 75% Poland 70% 70% 65% 65% Hungary 60% 60% 55% 55% 50% 50% 45% 45% 40% 40% 1995 1997 1999 2001 2003 2005 2007 2009 2011 2013 2015 2 Source: Eurostat, Raiffeisen RESEARCH
  • 3.
    Economic environment -still not very supportive in the this year GDP growth% 6.0 4.0 1.8 2.0 0.5 1.5 0.0 -0.1 -2.0 -4.0 -6.0 1999 2001 2003 2005 2007 2009 2011 2013f 2015f Germany Eurozone 3 Source: Eurostat, Raiffeisen RESEARCH
  • 4.
    Expected improvement inH2 2013 Source: Raiffeisen RESEARCH 4
  • 5.
    Medium-term growth prospectof the economy depends also on the government GDP growth % 12.0 10.5 10.0 8.0 8.3 6.7 6.0 5.8 4.4 5.1 3.2 3.5 4.0 4.6 4.8 3.5 2.0 2.4 2.5 1.4 0.9 0.0 0.0 -2.0 -4.0 -4.9 -6.0 1999 2001 2003 2005 2007 2009 2011 2013 2015 5 Source: Statistical Office of the Slovak Republic, Tatra banka RESEARCH
  • 6.
    Strong contribution ofautomotive industry will decrease in the year Structure of GDP growth 8% 5.9% 6% 4.2% 3.4% 2.4% 0.9% 4% 5.5% 3.2% 2% 2.6% 1.4% 1.0% 0.8% 1.0% 0.8% 0% 0.4% 0.2% -0.4% -2% -4.5% -4% -4.9% -6% 2 008 2 009 2 010 2 011 2 012 2 013 Automotive industry Rest of economy 6 Source: Statistical Office of the Slovak republic, Tatra banka RESEARCH
  • 7.
    Growth differential isnarrowing... Growth differential SR versus Eurozone 8.0 7.0 6.0 5.0 4.0 3.0 2.0 1.0 0.0 -1.0 2002 2004 2006 2008 2010 2012e 2014f 7 Source: Eurostat, Raiffeisen RESEARCH
  • 8.
    How strong iscommitment of government to decrease the deficit? 60 9 54.9 55.8 56.0 8.0 7.7 52.2 8 50 43.3 7 41.0 40 6 35.4 4.9 4.6 5 30 27.8 4 20 2.9 3 2.4 2.1 1.9 2 10 1 0 0 2008 2009 2010 2011 2012 2013 2014 2015 Public Debt Deficit as % of GDP 8 Source: Statistical Office of the Slovak Republic, Ministry of Finance
  • 9.
    High public debt- global problem Public debt % of GDP 250 200 150 % of GDP 100 50 0 2006 2007 2008 2009 2010 2011 2012 2013 2014 Eurozone USA Japan Slovak Republic 9 Source: Eurostat, OECD
  • 10.
    Slower growth, lowerinflation Key macroeconomic ndicators in 2013 versus 2012 16.0 13.8 14.1 14.0 12.0 2012 e 2013 f 10.0 8.0 6.0 4.6 4.0 3.6 2.9 2.4 2.2 2.0 0.9 0.6 -0.2 0.0 GDP CPI Employment Unemployment Deficit -2.0 10 Source: Statistical Office of the Slovak republic, Tatra banka RESEARCH
  • 11.
    Summary • Eurozone debtcrisis is not by far fixed and risk of another turmoil on the market is still very material • ECB will remain key stabilisation factor • Eurozone will be still on the verge of recession in H1 2013 with prospect of gradual recovery in H2 2013 and 2014 • Growth perspective for Slovak economy determined by Eurozone a economic policy of government in medium term 11
  • 12.
    Thank you forattention. 12