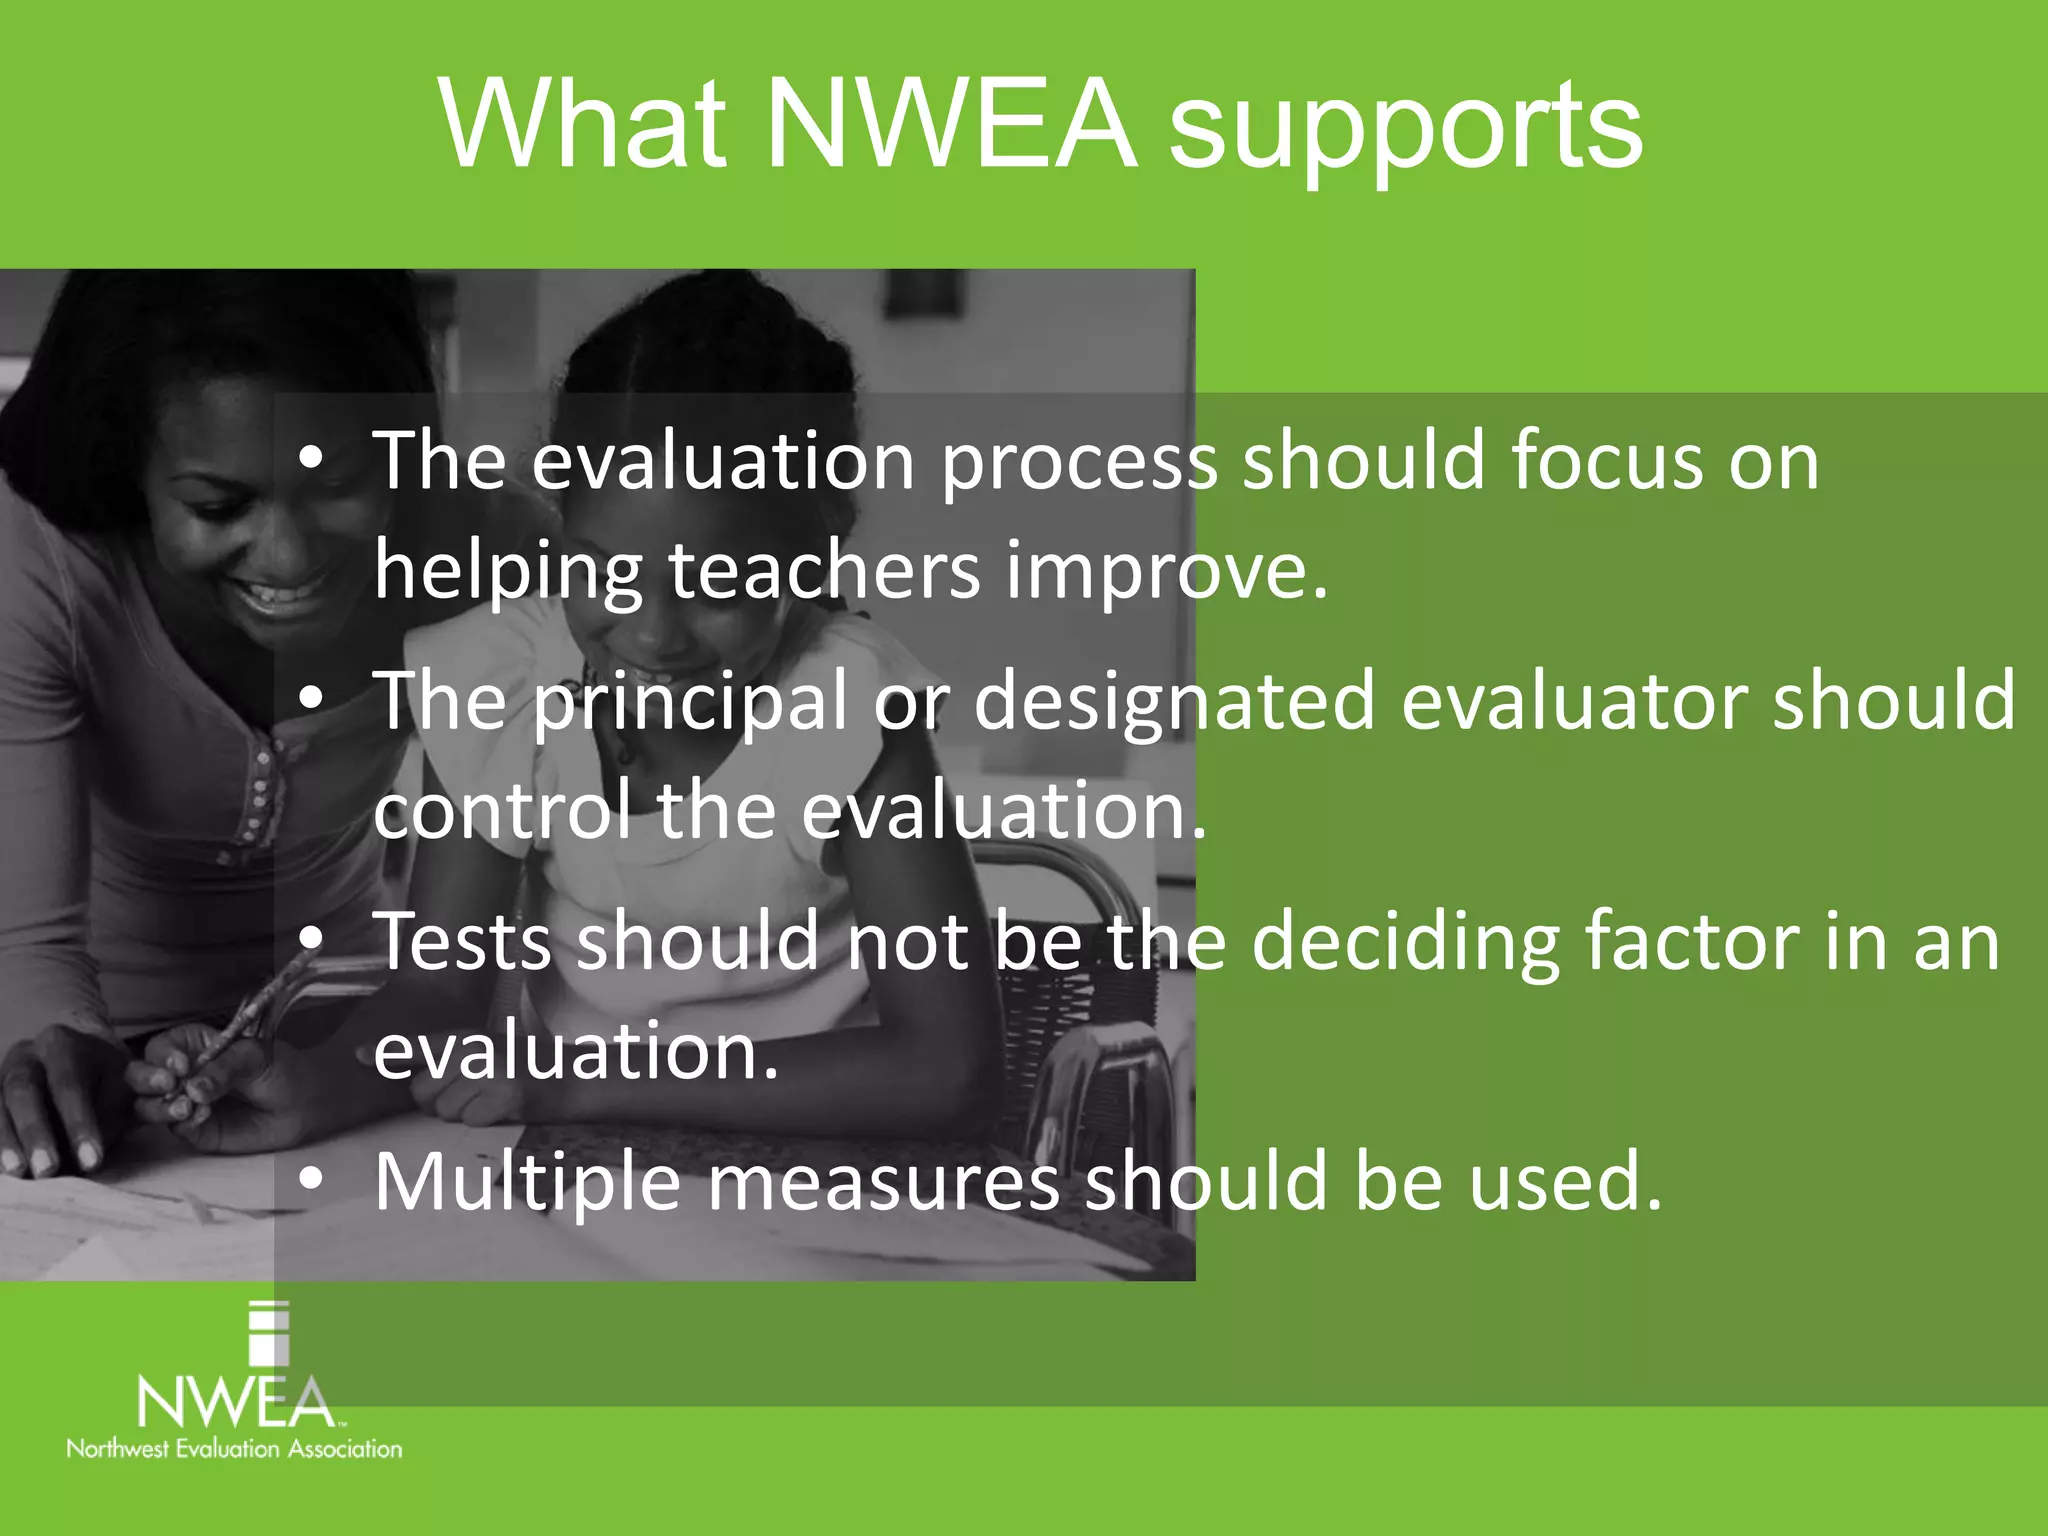
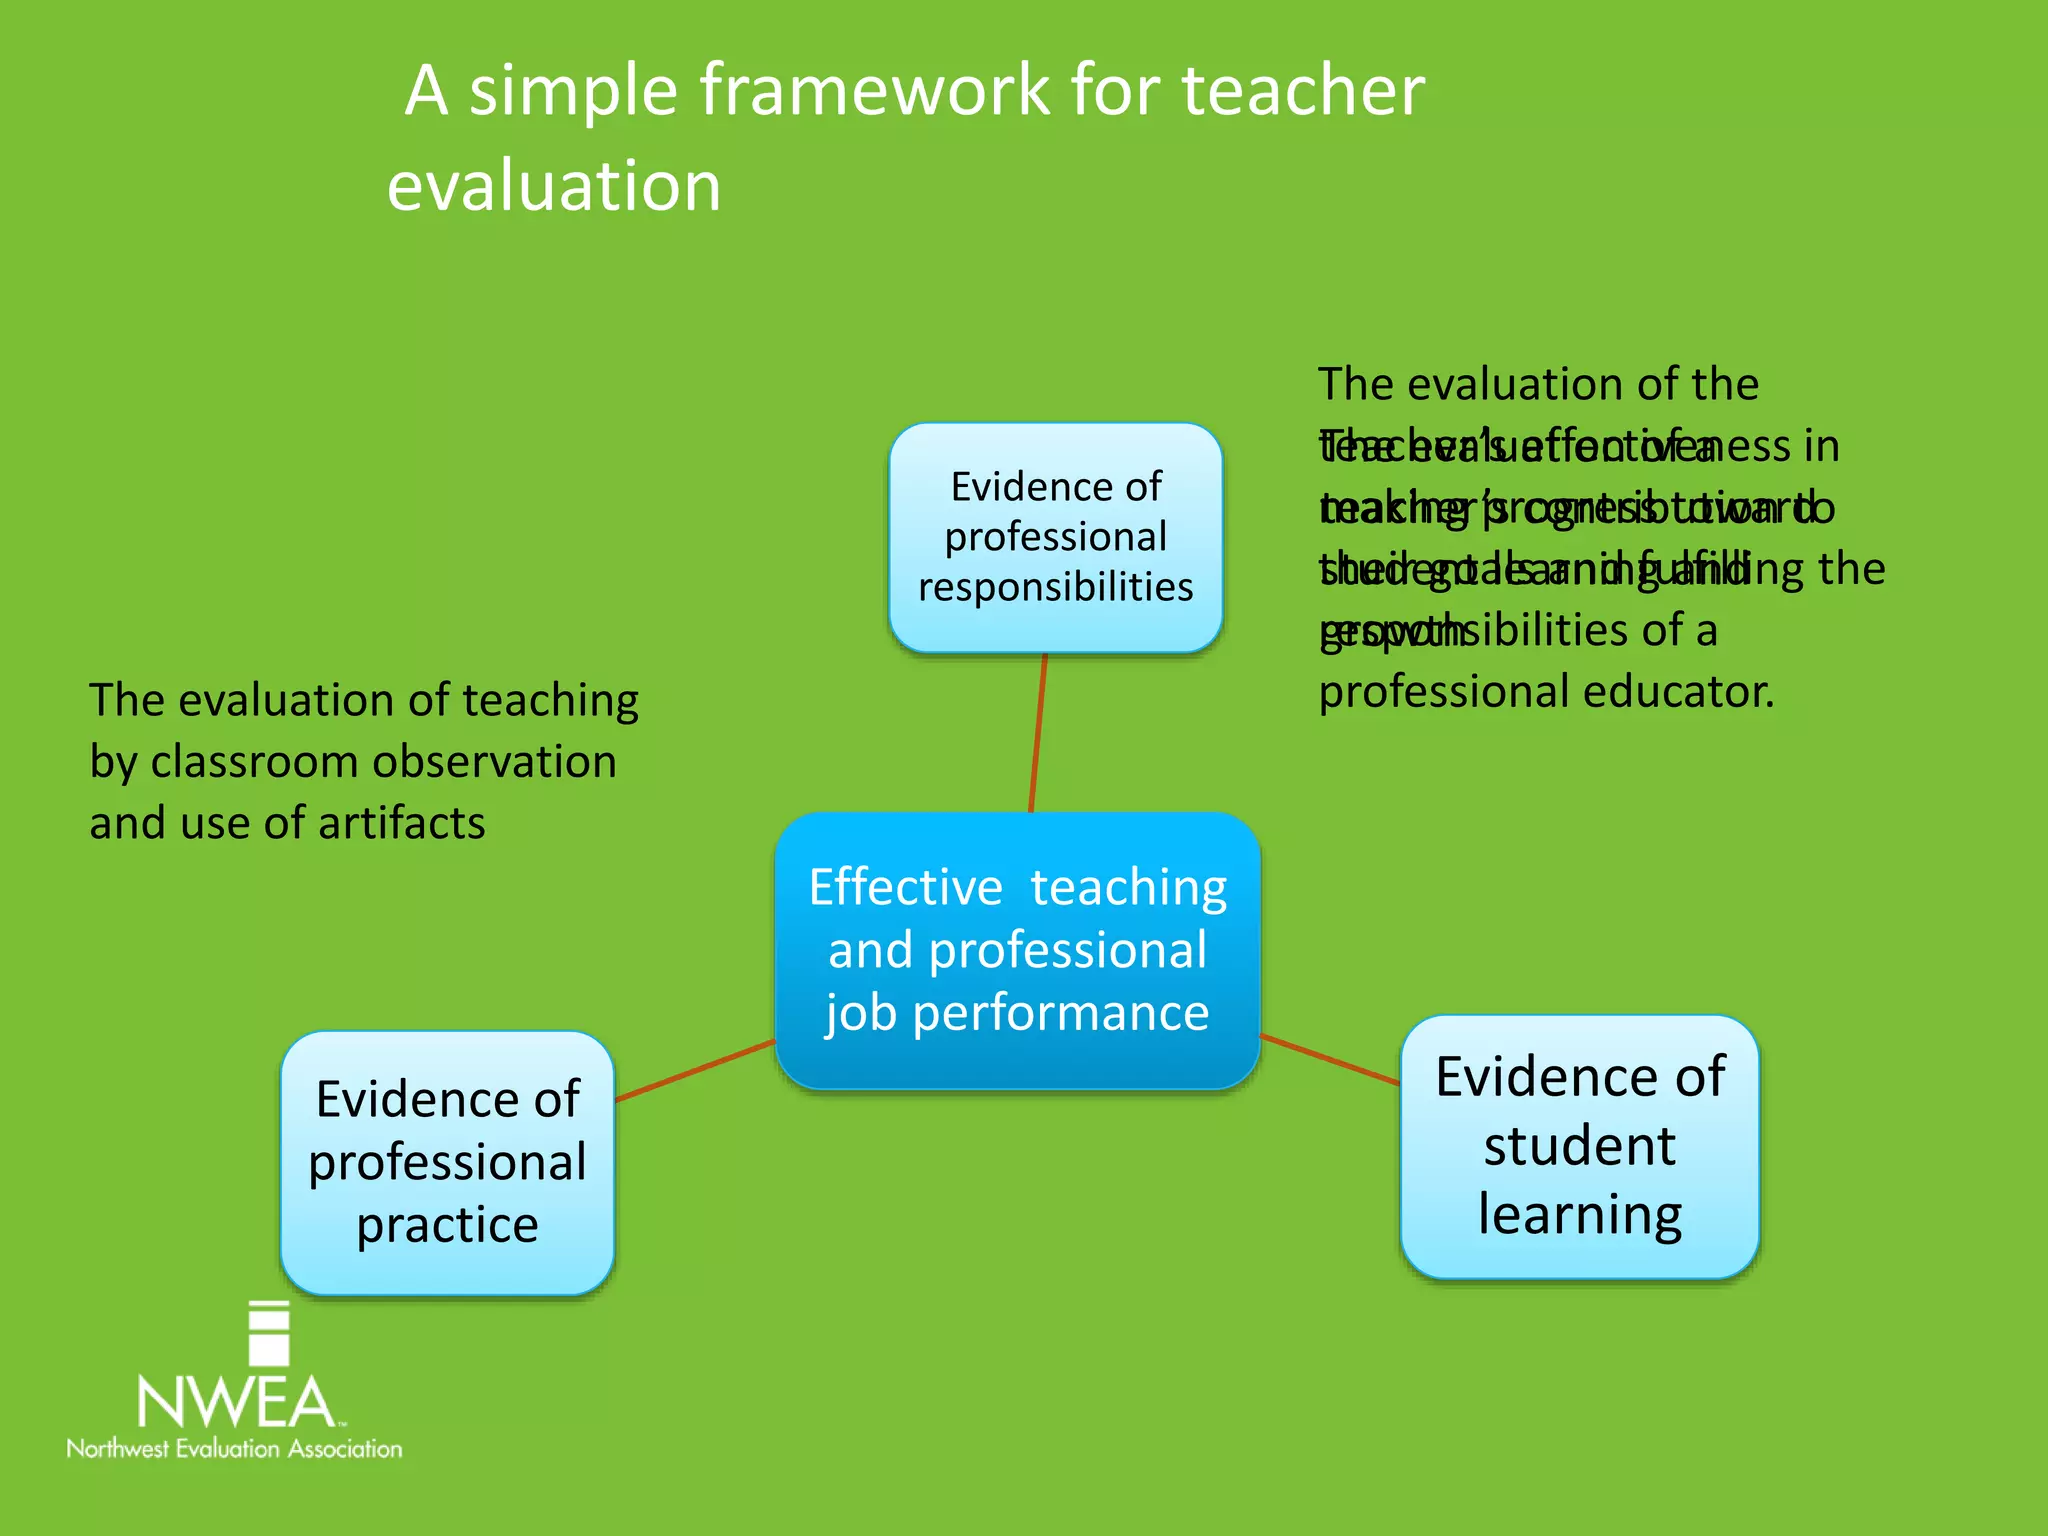
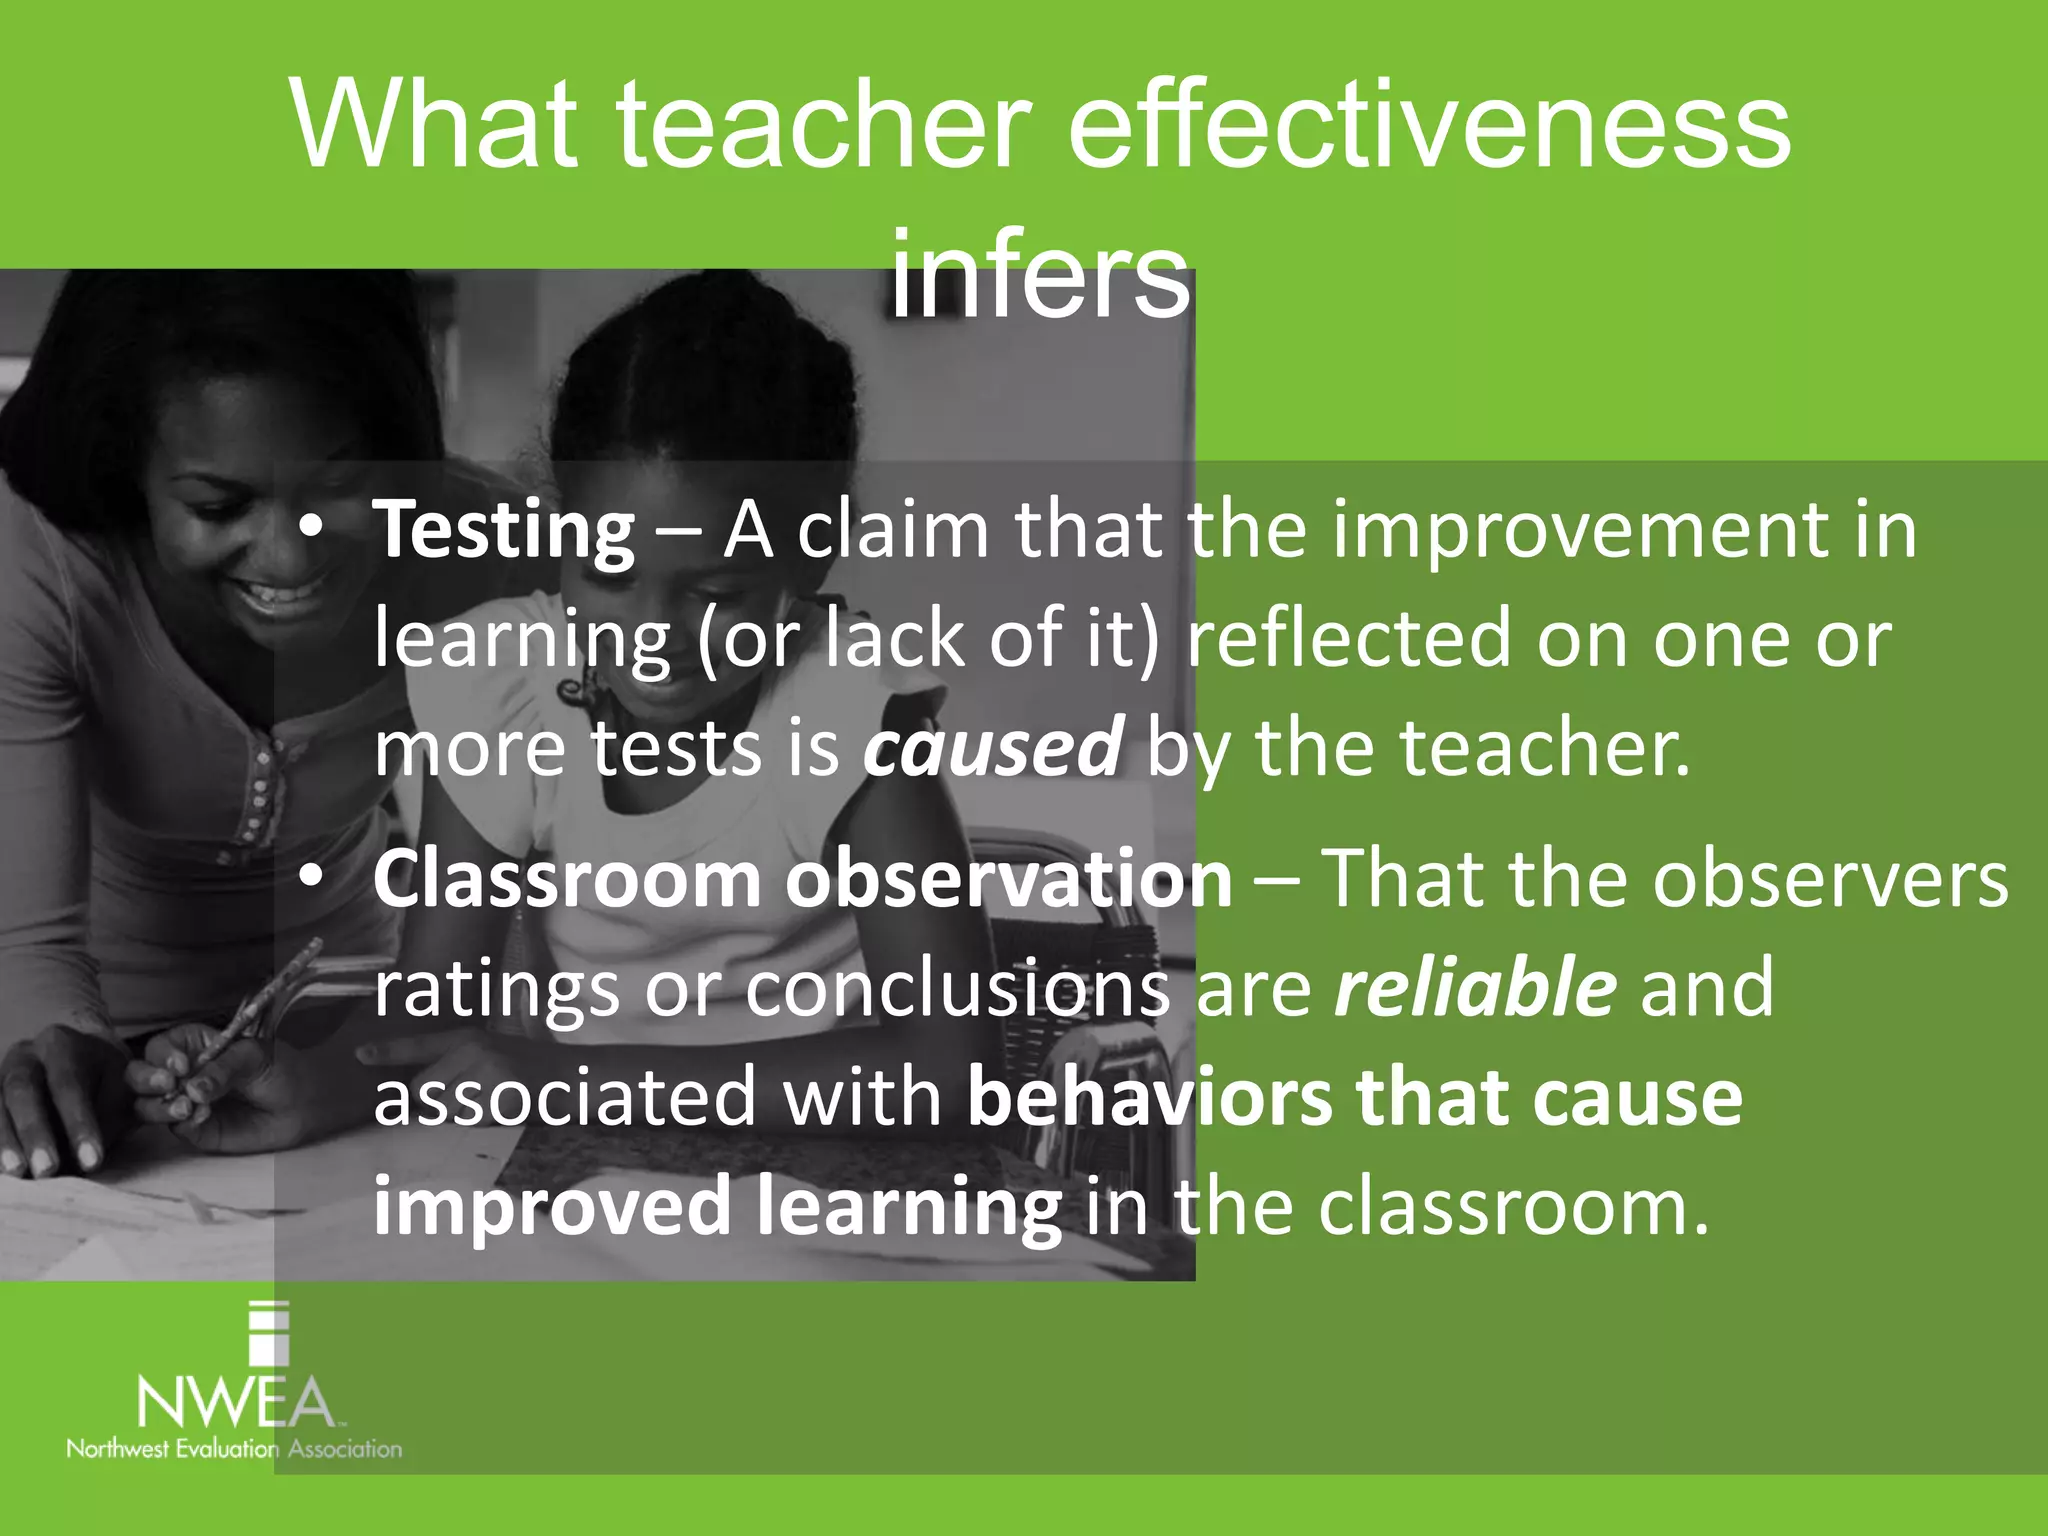
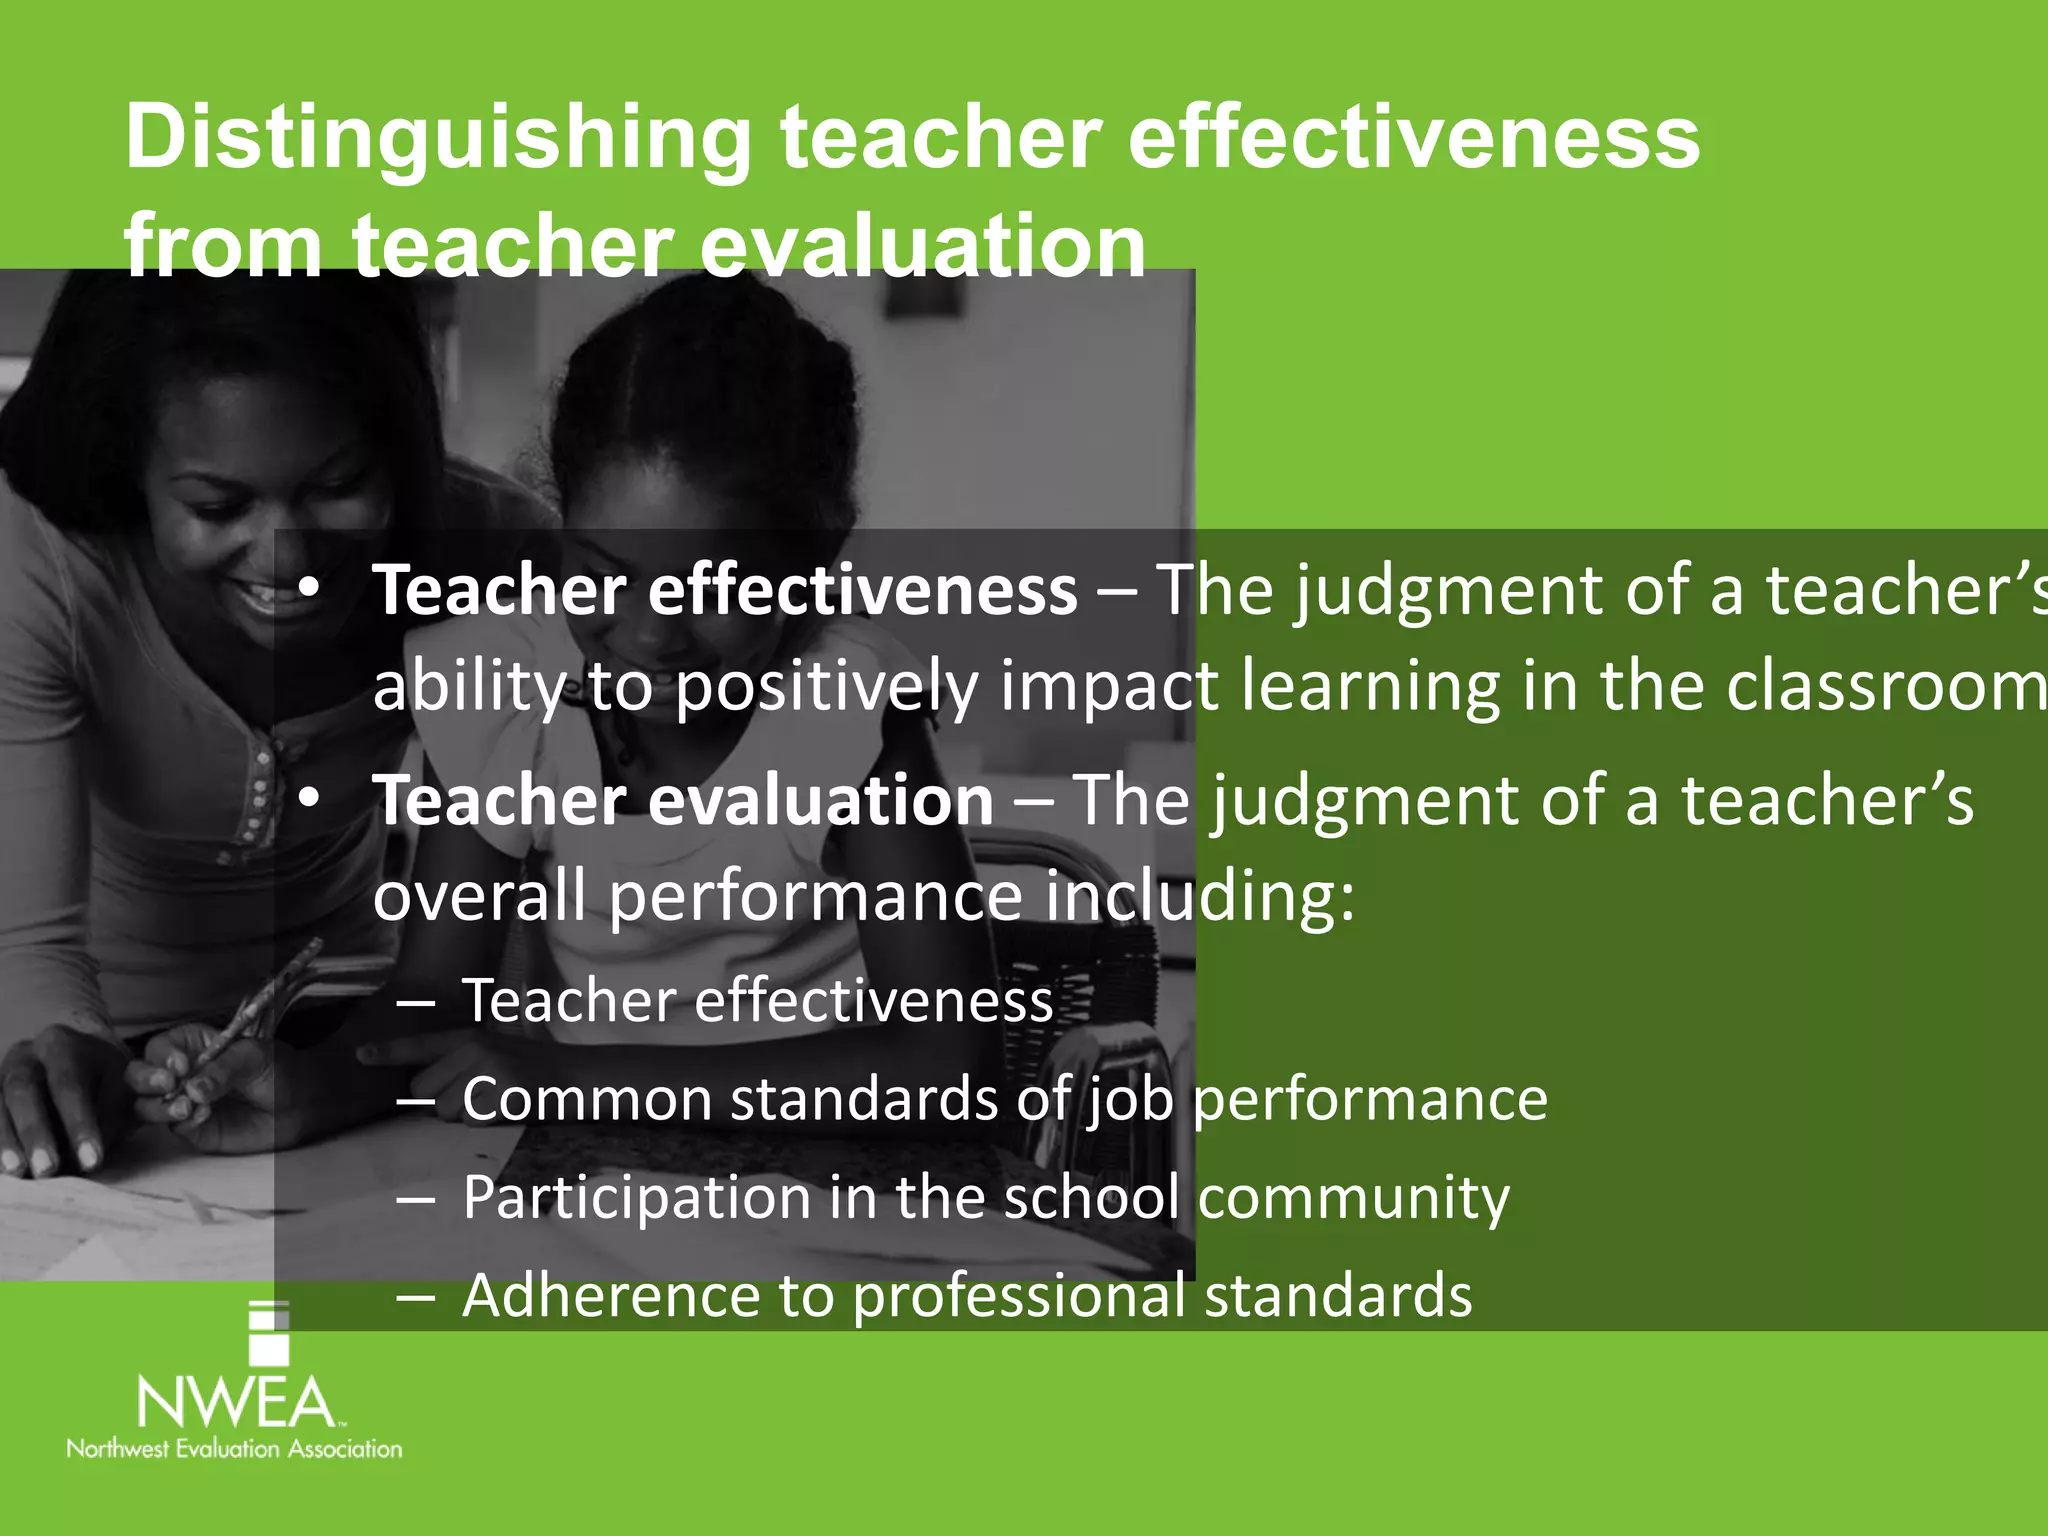
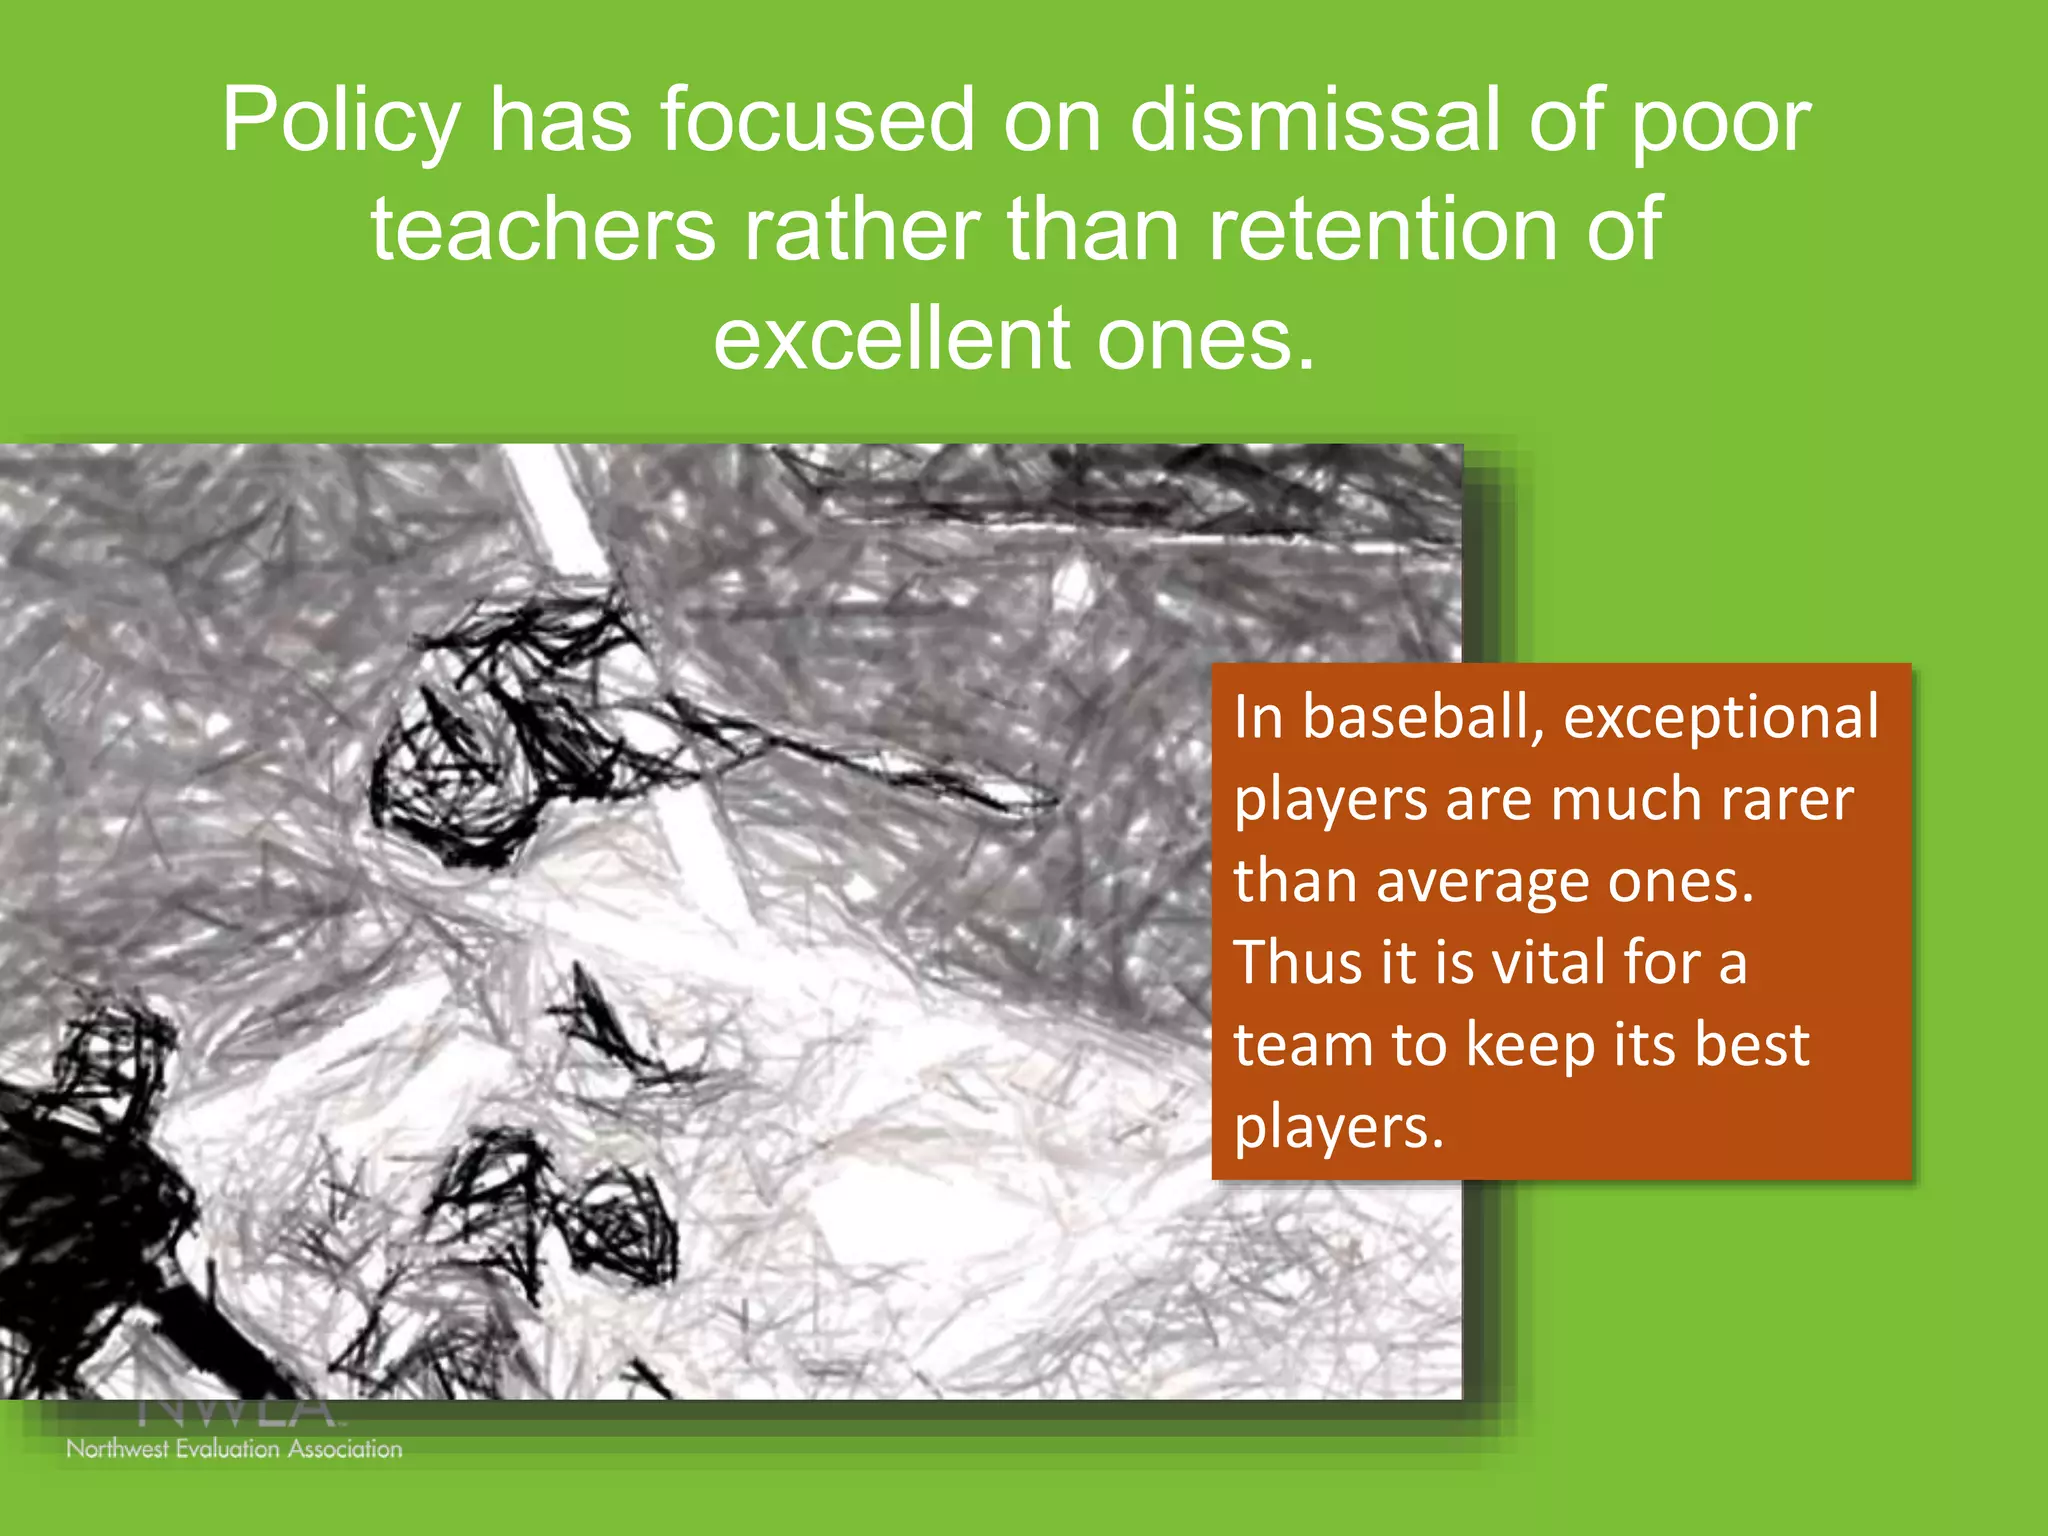
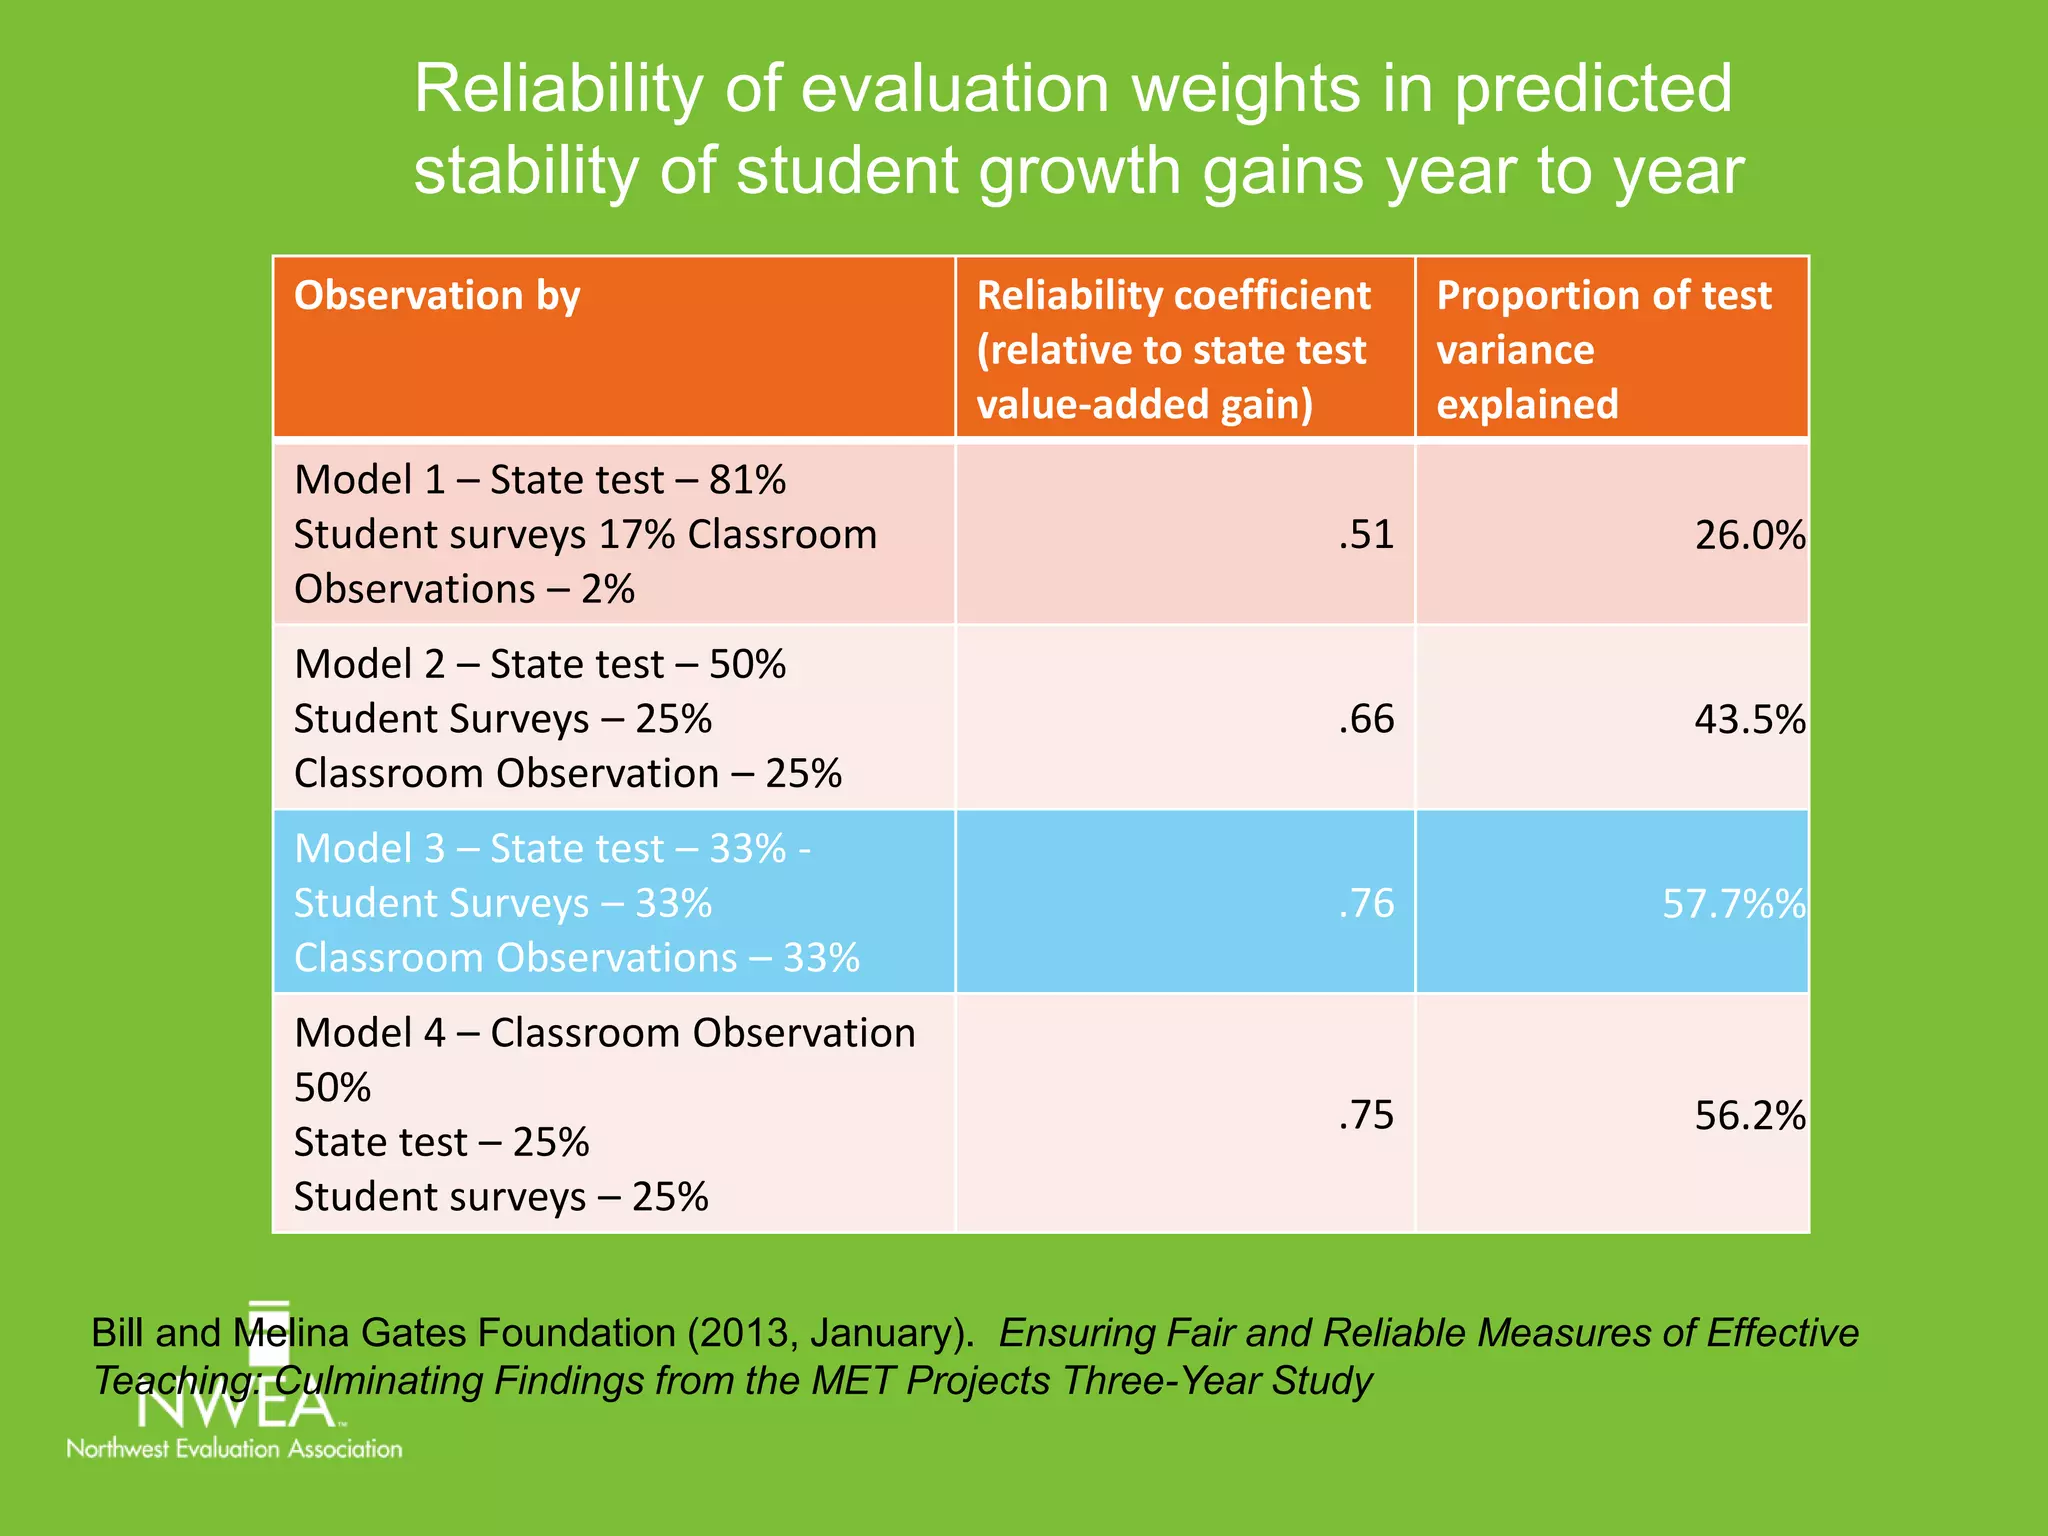
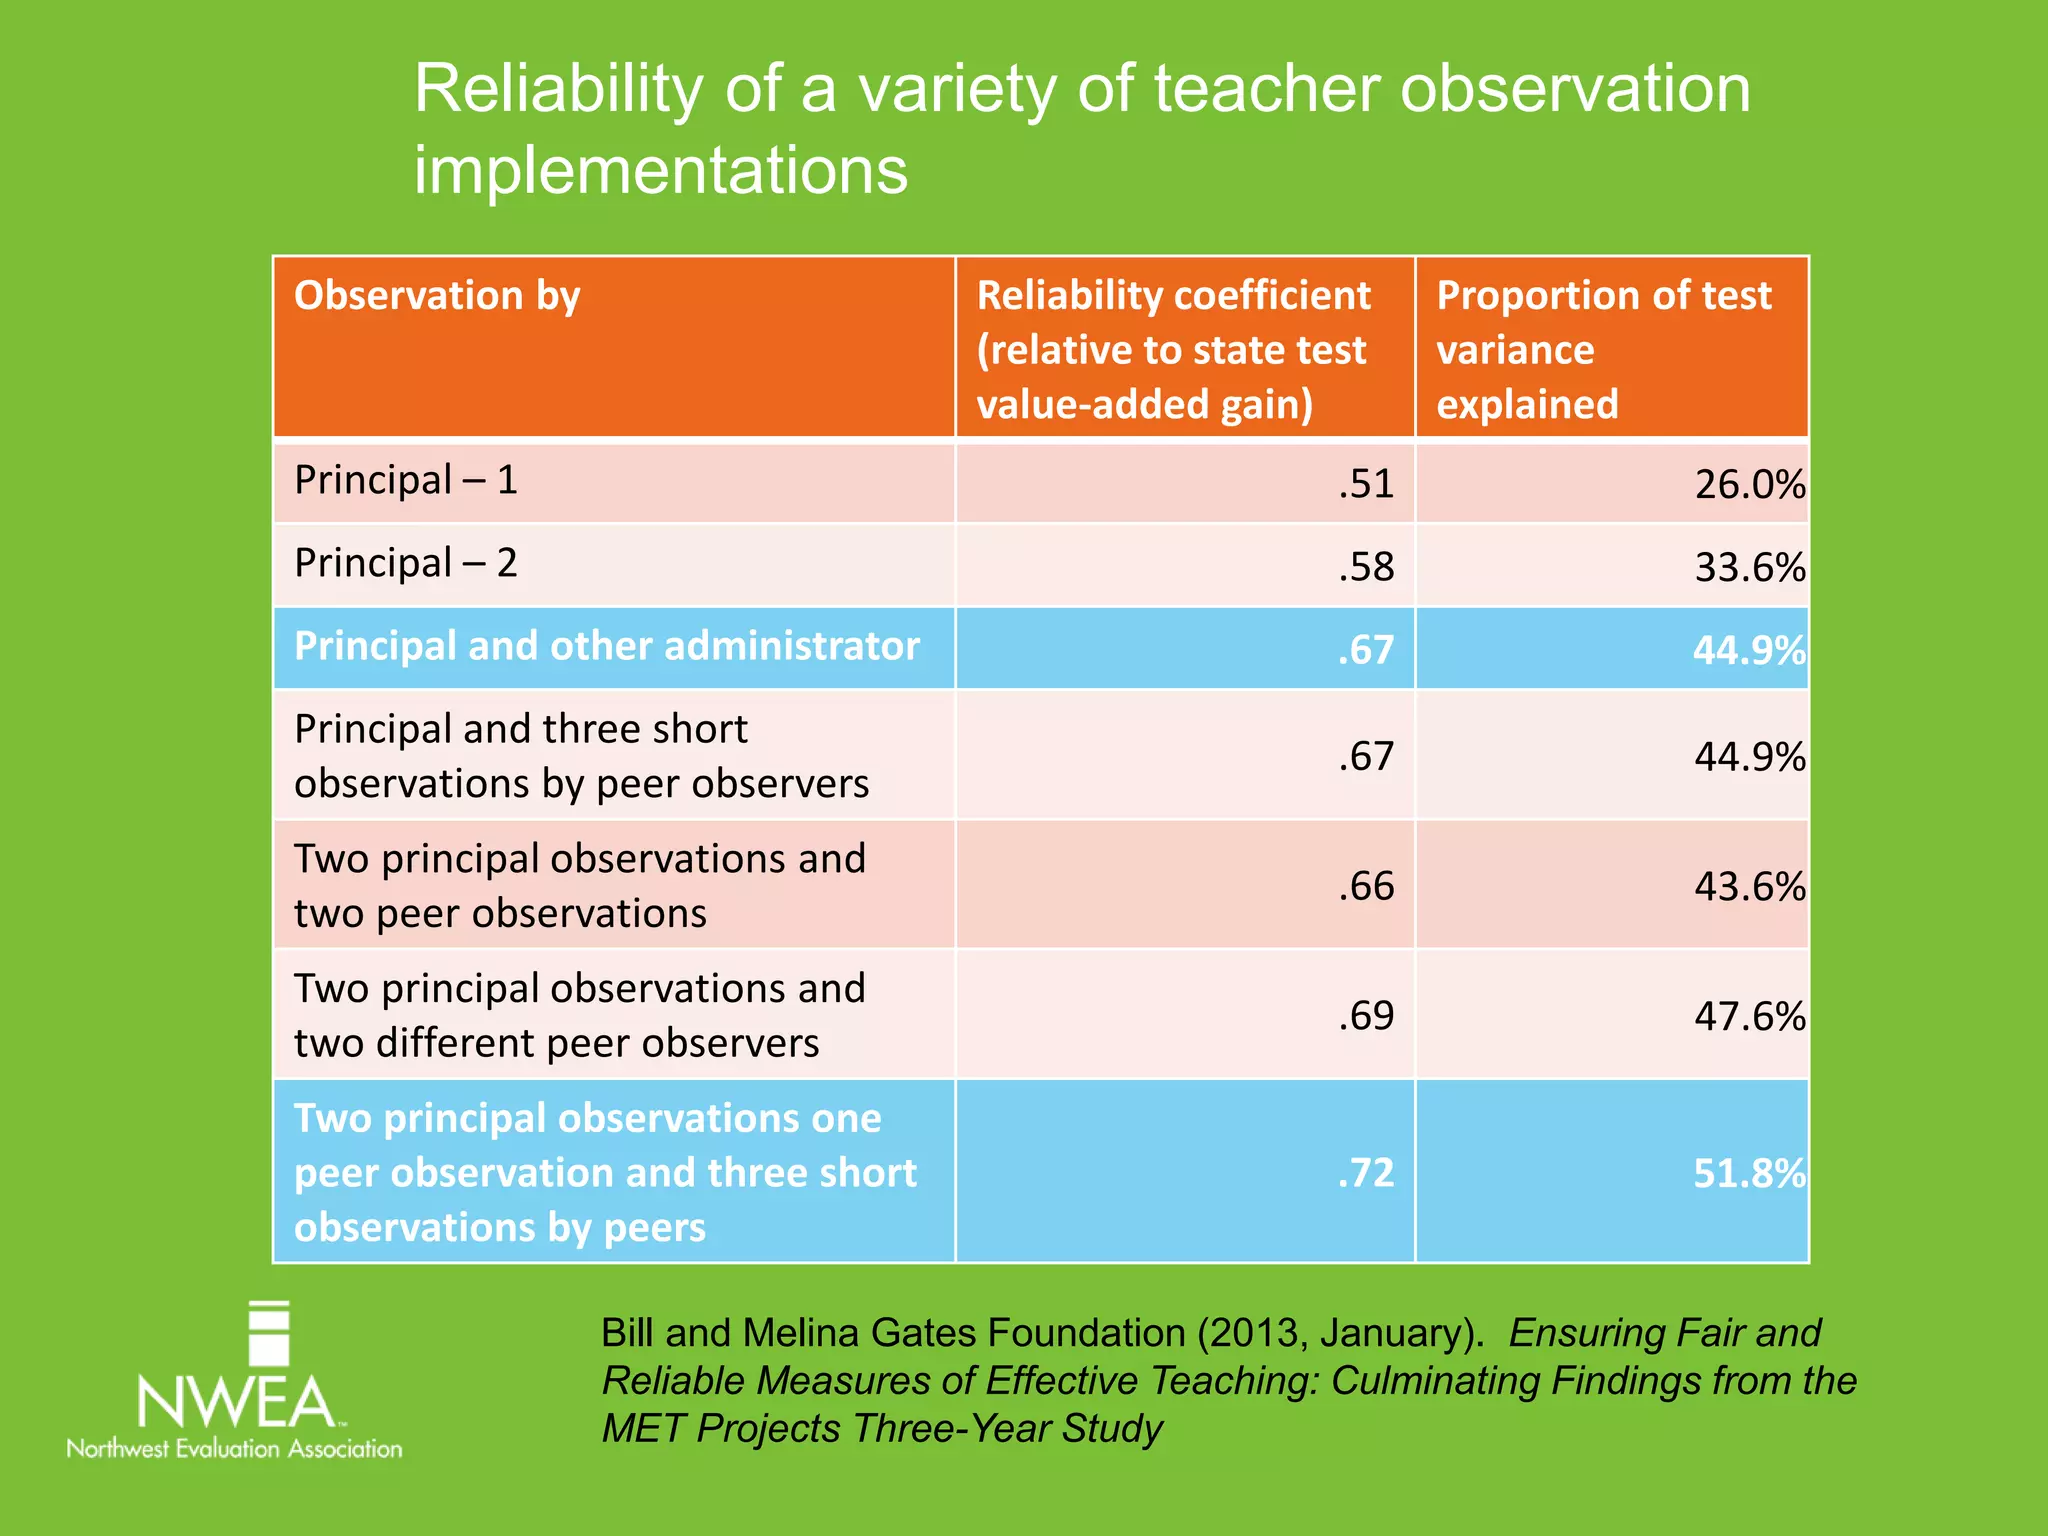
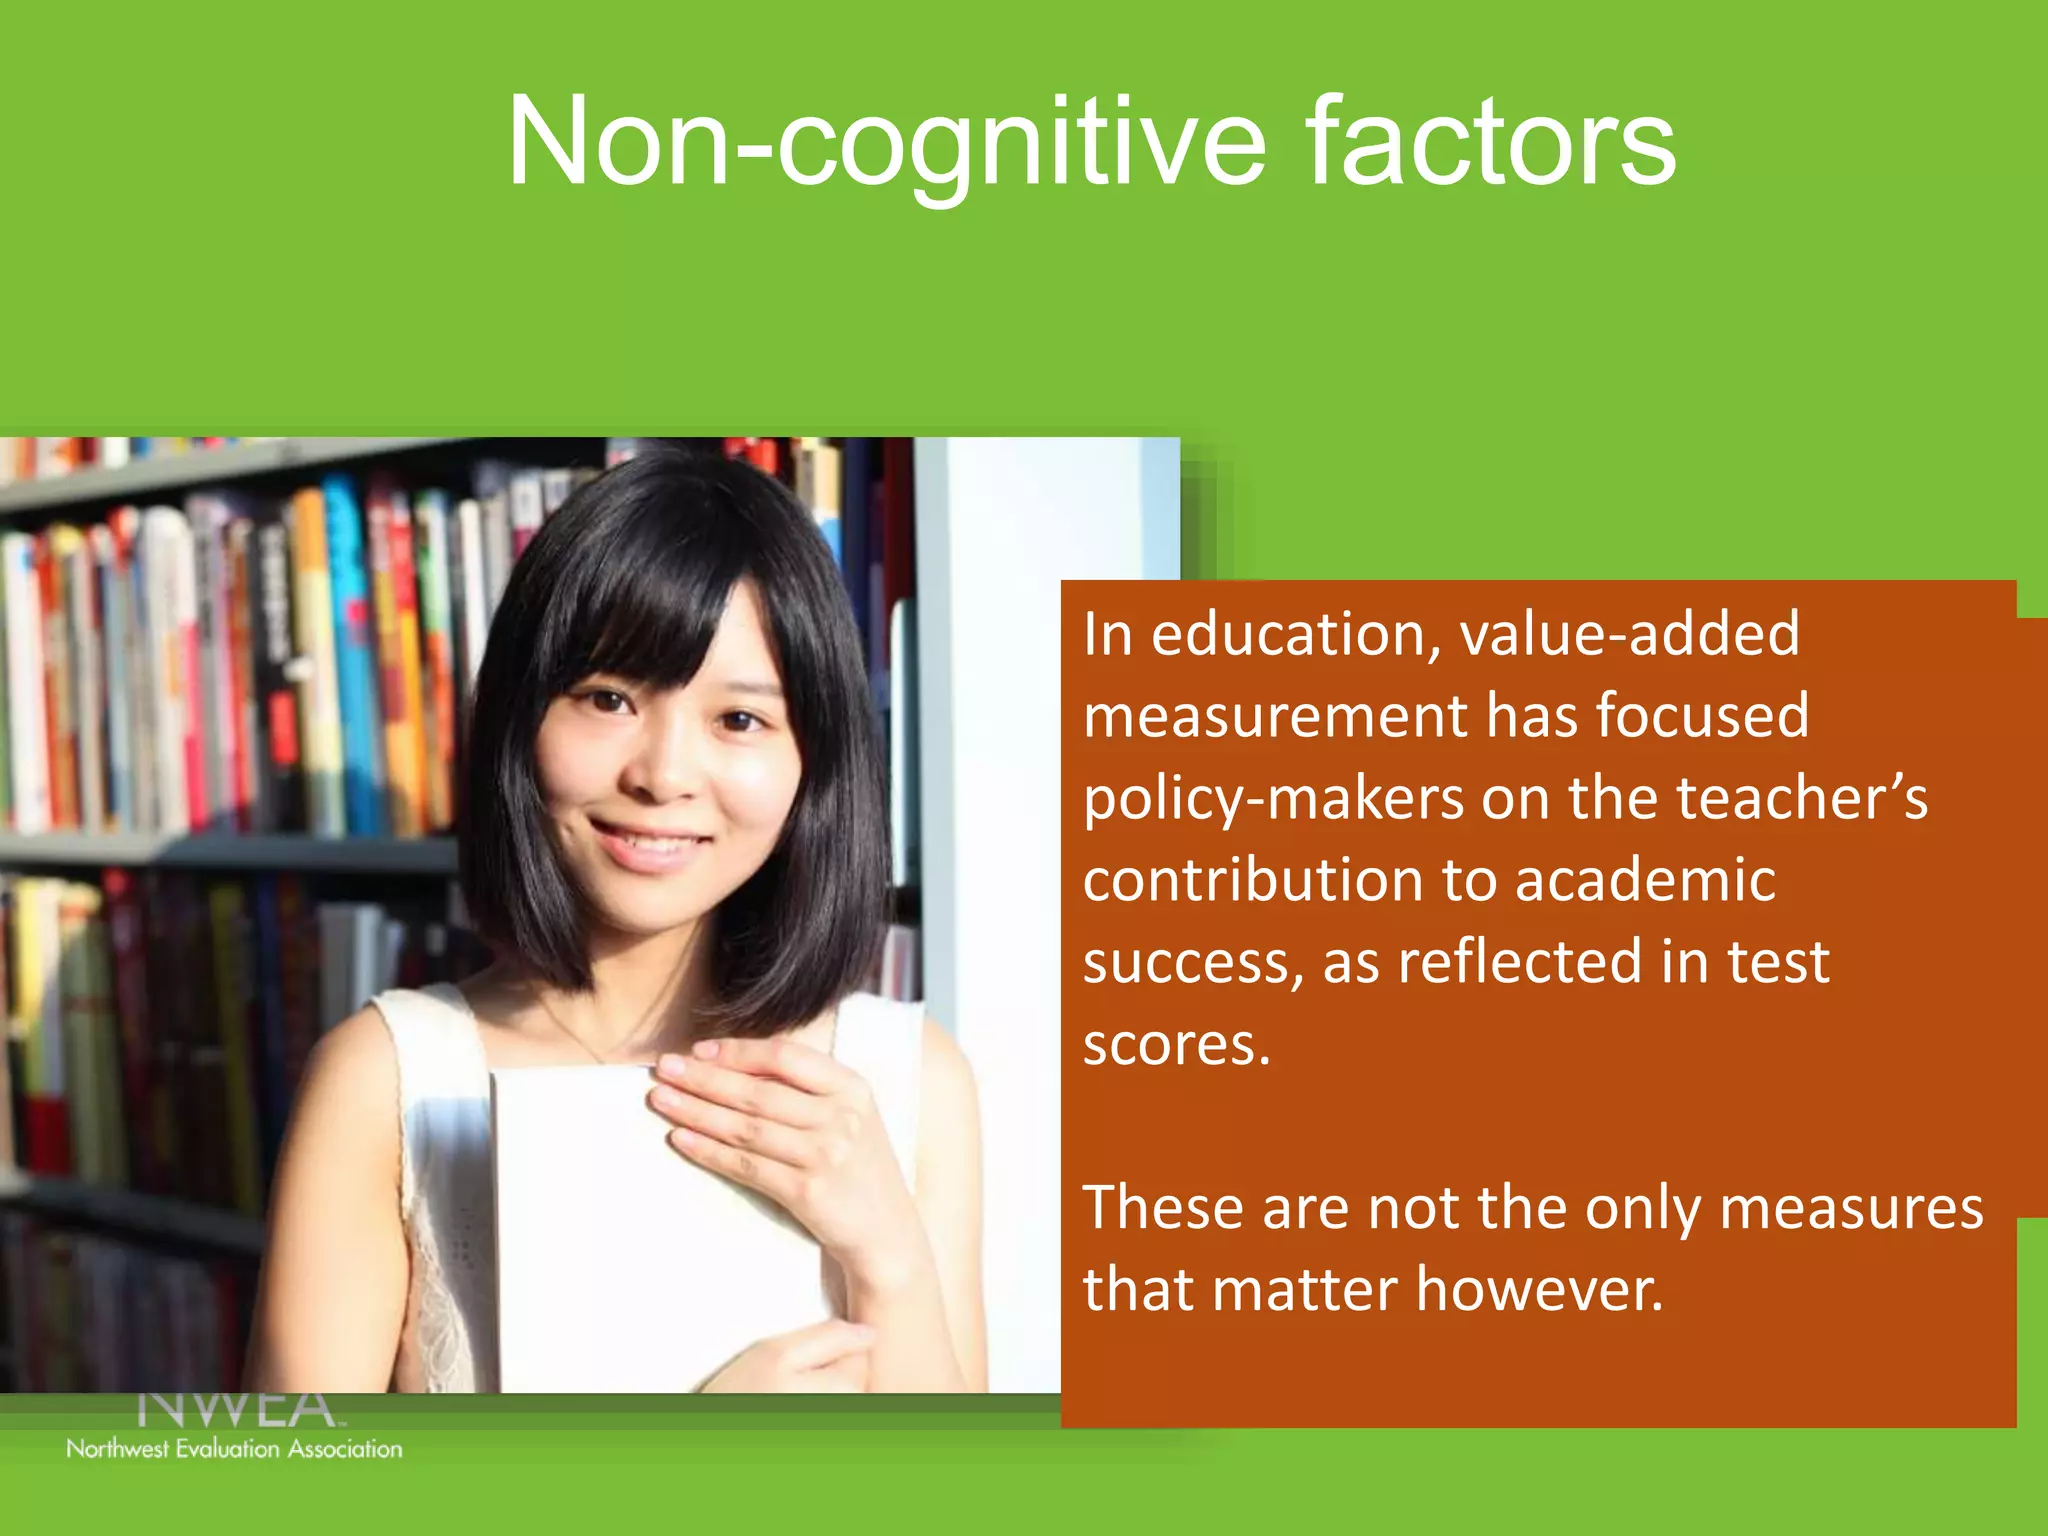
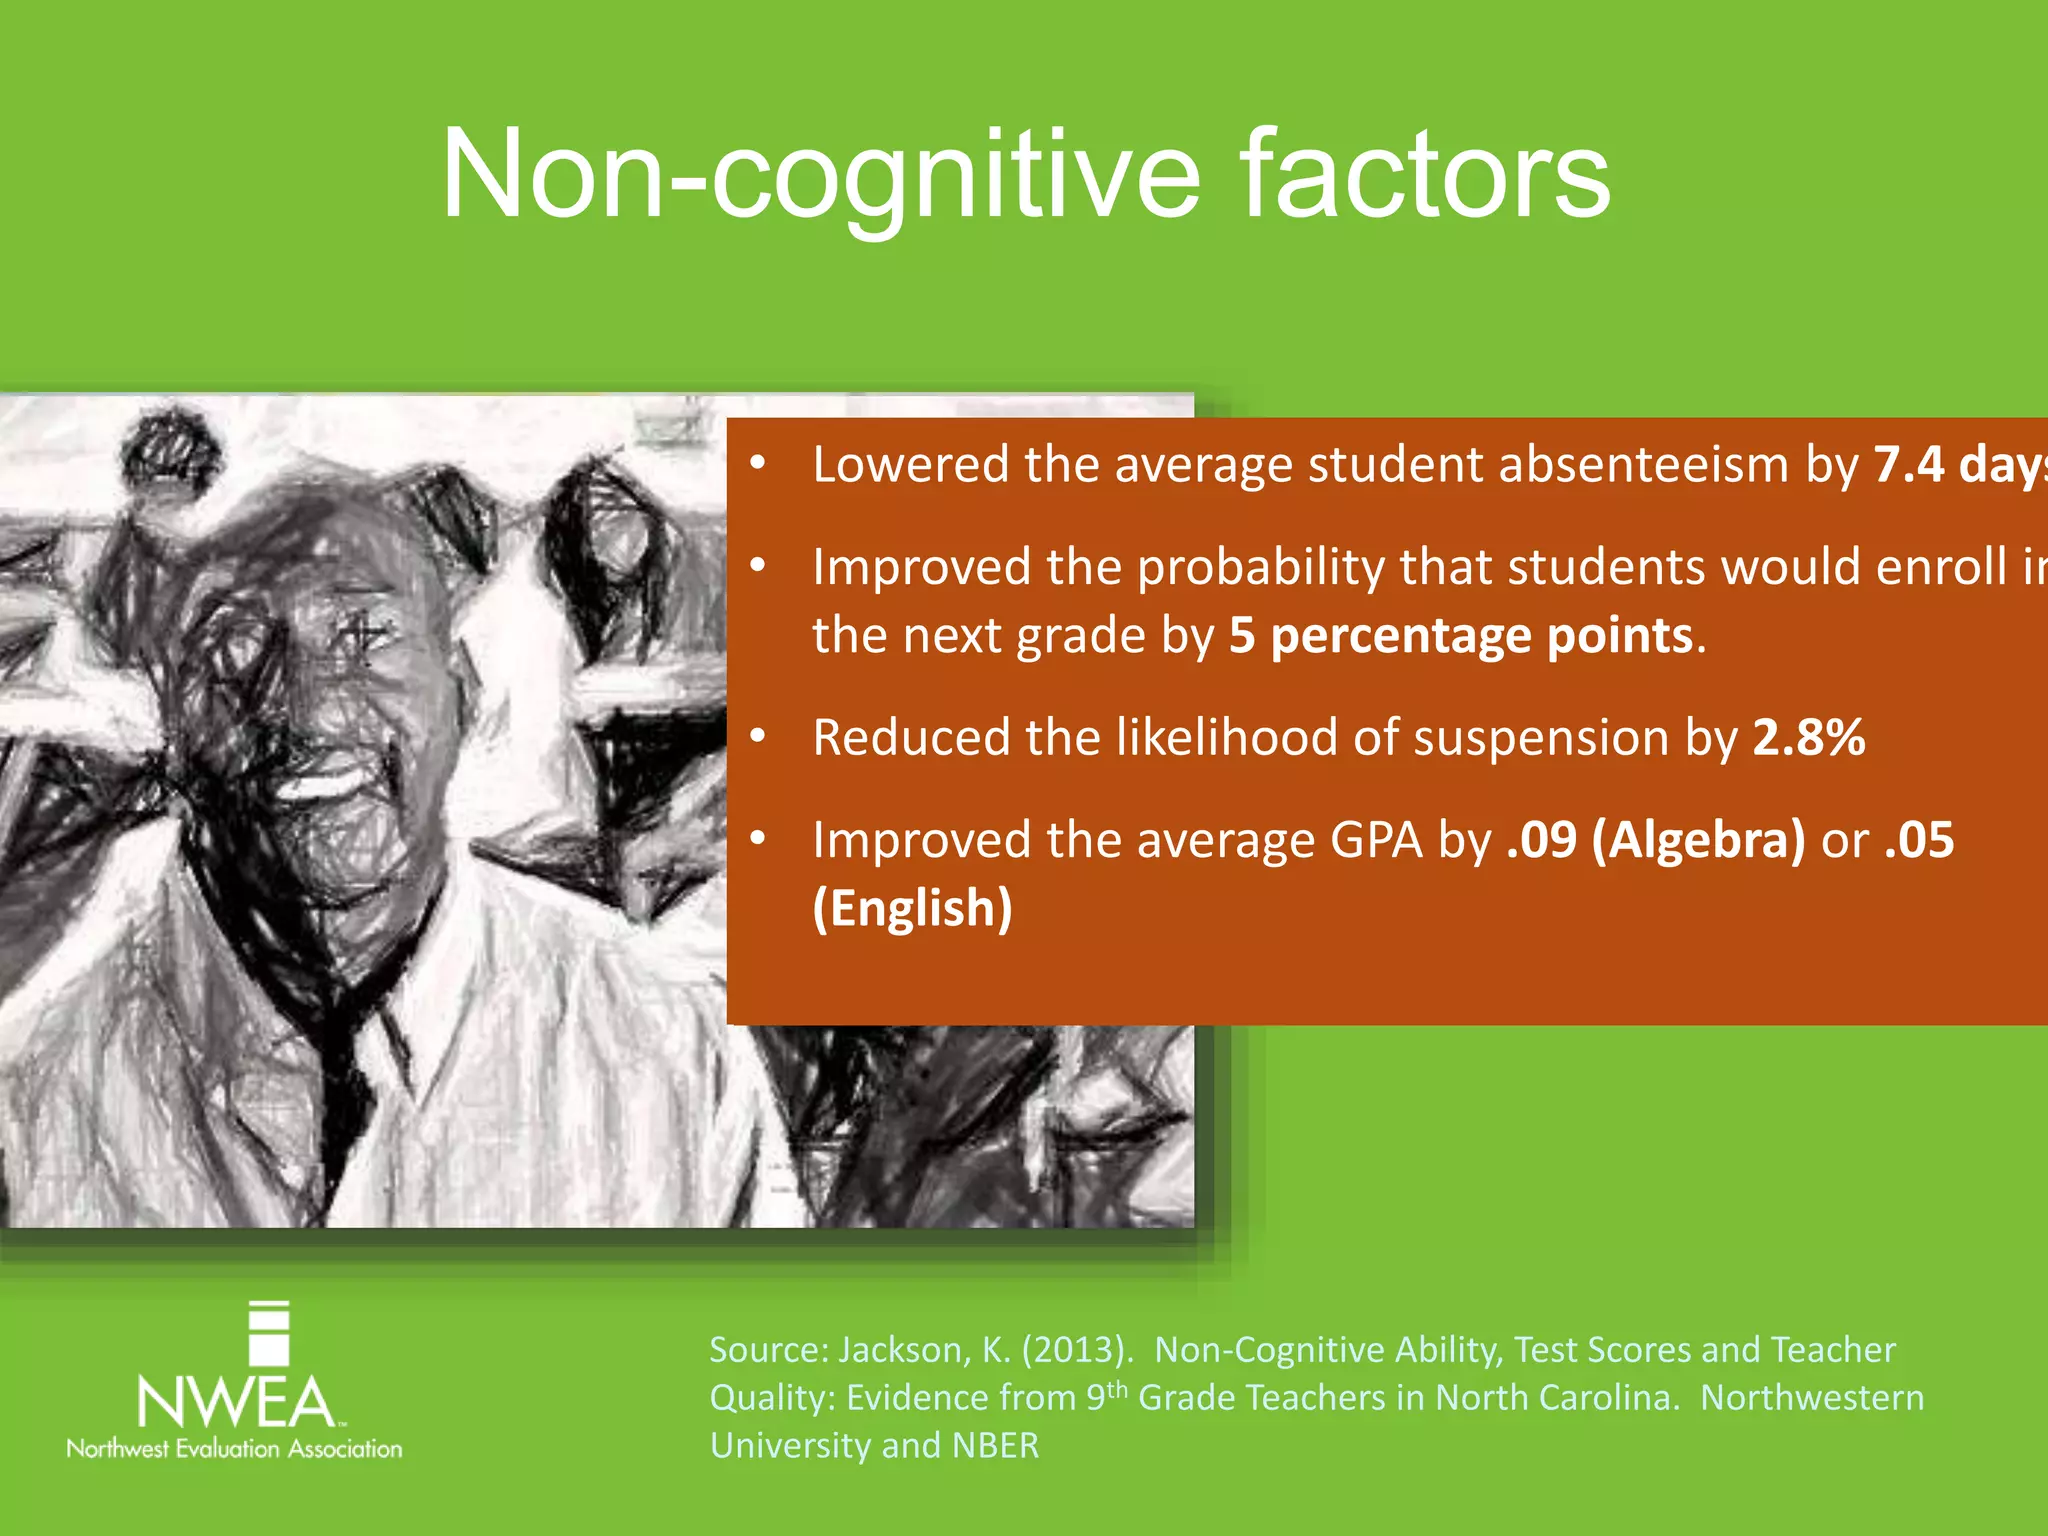
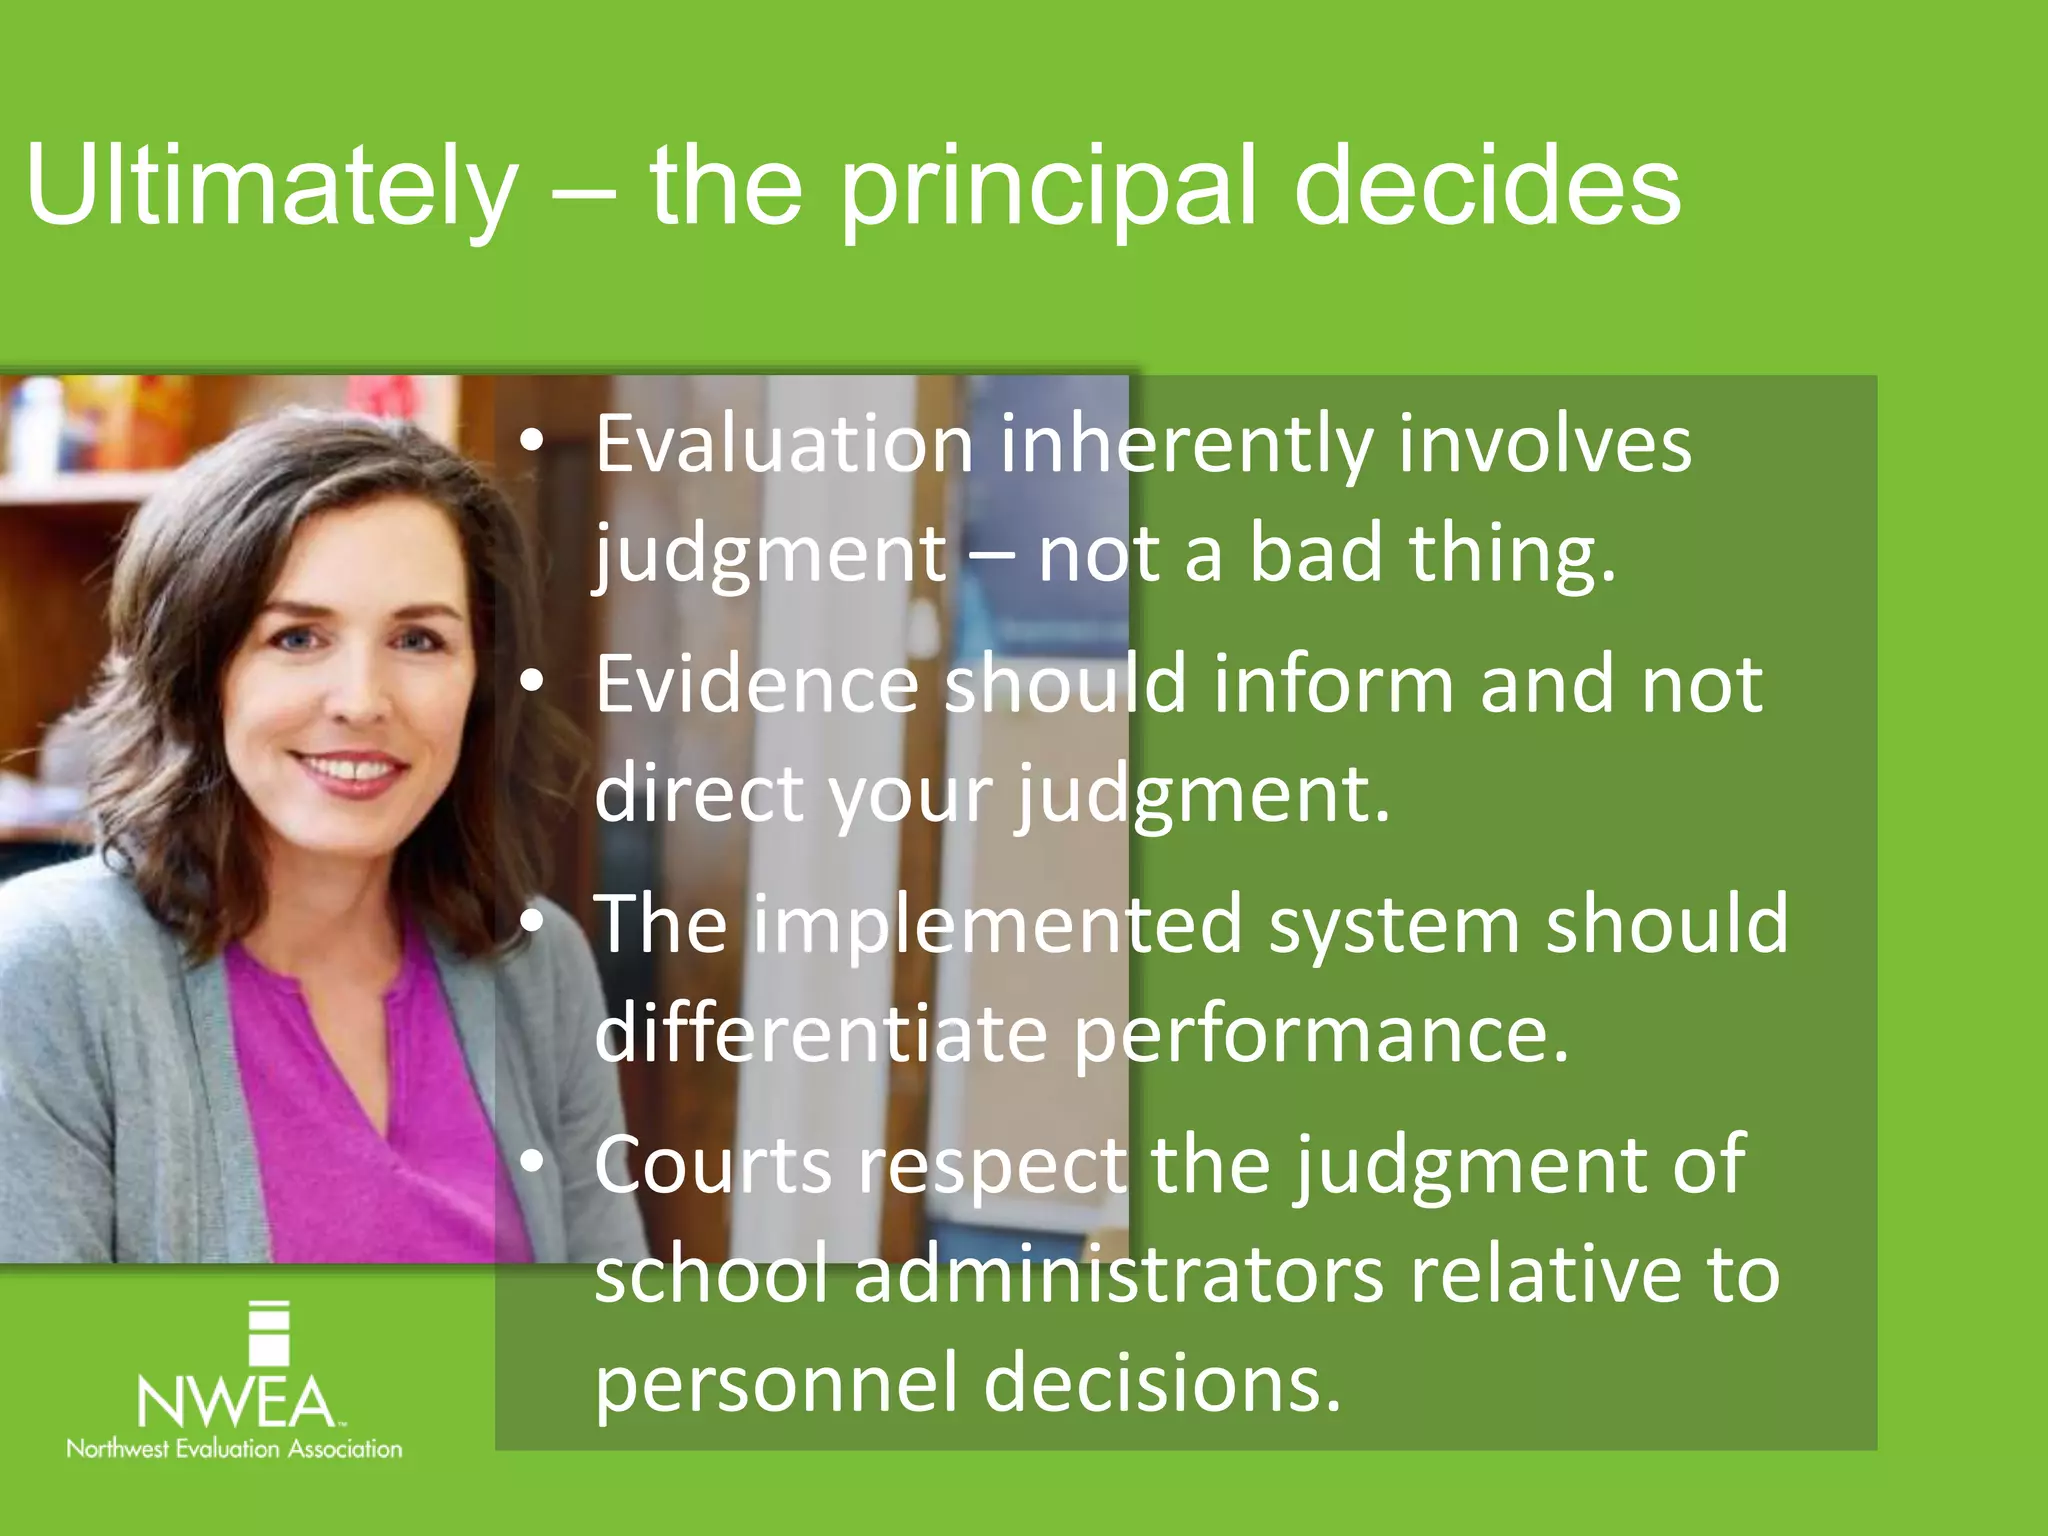
Taking Control of the Teacher Evaluation Framework 
for South Carolina 
John Cronin, Ph.D. – Senior Director of Education Research 
Northwest Evaluation Association
What NWEA supports 
• The evaluation process should focus on 
helping teachers improve. 
• The principal or designated evaluator should 
control the evaluation. 
• Tests should not be the deciding factor in an 
evaluation. 
• Multiple measures should be used.
A simple framework for teacher 
evaluation 
Evidence of 
professional 
responsibilities 
Effective teaching 
and professional 
job performance 
Evidence of 
student 
learning 
The evaluation of teaching 
by classroom observation 
and use of artifacts 
Evidence of 
professional 
practice 
The evaluation of the 
teacher’s The evaluation effectiveness of a 
in 
making teacher’s progress contribution toward 
to 
their student goals learning and fulfilling and 
the 
responsibilities growth 
of a 
professional educator.
What teacher effectiveness 
infers 
• Testing – A claim that the improvement in 
learning (or lack of it) reflected on one or 
more tests is caused by the teacher. 
• Classroom observation – That the observers 
ratings or conclusions are reliable and 
associated with behaviors that cause 
improved learning in the classroom.
Distinguishing teacher effectiveness 
from teacher evaluation 
• Teacher effectiveness – The judgment of a teacher’s 
ability to positively impact learning in the classroom. 
• Teacher evaluation – The judgment of a teacher’s 
overall performance including: 
– Teacher effectiveness 
– Common standards of job performance 
– Participation in the school community 
– Adherence to professional standards
Purposes of summative evaluation 
• Make an accurate and defensible judgment of an educator’s 
job performance. 
• Provide ratings of performance that provide meaningful 
differentiation across educators. 
• Goals of evaluation 
– Help educators focus on their students and their practice 
– Retain your top educators 
– Dismiss ineffective educators
Learn from others’ mistakes.
Policy has focused on dismissal of poor 
teachers rather than retention of 
excellent ones. 
In baseball, exceptional 
players are much rarer 
than average ones. 
Thus it is vital for a 
team to keep its best 
players.
Employment of Elementary Teachers 
2007-2012 
NUMBER OF TEACHERS 
1538000 1544270 1544300 
1485600 
The elementary school 
teacher workforce shrunk by 
178,000 teachers (11%) 
between May, 2007 and May, 
2012. 
1415000 
1360380 
2007 2008 2009 2010 2011 2012 
Source: (2012, May) Bureau of Labor Statistics – Occupational Employment Statistics 
Numbers exclude special education and kindergarten teachers
The impact of seniority based layoffs on 
school quality 
In a simulation study of implementation of a layoff of 5% 
of teachers using New York City data, reliance on seniority 
based layoffs resulted would: 
• Result in 25% more teachers laid off. 
• Teachers laid off would be .31 standard deviations more 
effective (using a value-added criterion) than those lost 
using an effectiveness criterion. 
• 84% of teachers with unsatisfactory ratings would be 
retained. 
Source: Boyd, L., Lankford, H., Loeb, S., and Wycoff, J. (2011). Center for Education Policy. 
Stanford University.
Teacher observation as a part of 
teacher evaluation 
Systematic observation of teacher performance 
is a central part of every state’s teacher 
evaluation plan.
If evaluators do 
not differentiate 
their ratings, 
then all 
differentiation 
comes from the 
test.
If performance 
ratings aren’t 
consistent with 
school growth, 
the media and 
public will 
demand to know 
why.
“The (Race to the Top teacher evaluation) changes, already 
under way in some cities and states, are intended to 
provide meaningful feedback and, critically, to weed out 
weak performers. And here are some of the early results: 
In Florida, 97 percent of teachers were deemed effective 
or highly effective in the most recent evaluations. In 
Tennessee, 98 percent of teachers were judged to be “at 
expectations.” In Michigan, 98 percent of teachers were 
rated effective or better.” 
Source: New York Times (2013, March 30). Curious Grade for Teachers: Nearly all Pass. 
Retrieved from: 
http://www.nytimes.com/2013/03/31/education/curious-grade-for-teachers-nearly-all- 
pass.html?pagewanted=all&_r=0
Teacher Evaluation Ratings in Six Florida 
Districts 2013 
Florida 
District 
Highly 
Effective 
Effective Needs 
Improvement 
Developing Unsatisfactory VA Score Florida 
Ranking 
1 44.4% 55.6% 0.0% 0.0% 0.0% 
2 25.0% 75.0% 0.0% 0.0% 0.0% 
3 90.9% 9.1% 0.0% 0.0% 0.0% 
4 60.7% 39.3% 0.0% 0.0% 0.0% 
5 81.2% 18.8% 0.0% 0.0% 0.0% 
6 37.3% 54.2% 1.7% 0.0% 6.8% 
7 81.3% 18.8% 0.0% 0.0% 0.0% 
8 41.7% 55.6% 1.4% 1.4% 0.0% 
9 52.2% 47.8% 0.0% 0.0% 0.0% 
10 27.0% 66.2% 1.4% 0.0% 5.4% 
11 7.1% 72.6% 9.5% 10.7% 0.0%
Teacher Evaluation Ratings in Six Florida 
Districts 2013 
Florida 
District 
Highly 
Effective 
Effective Needs 
Improvement 
Developing Unsatisfactory VA Score Florida 
Ranking 
1 44.4% 55.6% 0.0% 0.0% 0.0% 0.39 109 
2 25.0% 75.0% 0.0% 0.0% 0.0% 0.37 121 
3 90.9% 9.1% 0.0% 0.0% 0.0% -0.14 2802 
4 60.7% 39.3% 0.0% 0.0% 0.0% -0.14 2797 
5 81.2% 18.8% 0.0% 0.0% 0.0% -0.16 2831 
6 37.3% 54.2% 1.7% 0.0% 6.8% 0.12 880 
7 81.3% 18.8% 0.0% 0.0% 0.0% 0.22 402 
8 41.7% 55.6% 1.4% 1.4% 0.0% -0.34 3274 
9 52.2% 47.8% 0.0% 0.0% 0.0% 0.16 664 
10 27.0% 66.2% 1.4% 0.0% 5.4% 0 1764 
11 7.1% 72.6% 9.5% 10.7% 0.0% -0.08 2445
Teacher Evaluation Ratings in Six Florida 
Districts 2013 
Florida 
District 
Highly 
Effective 
Effective Needs 
Improvement 
Developing Unsatisfactory Ranking 
1 37.5% 57.9% 3.3% 0.3% 1.0% 
2 30.7% 30.2% 1.4% 1.2% 0.0% 
3 10.7% 44.7% 2.0% 1.4% 0.1% 
4 67.7% 9.4% 0.1% 0.1% 0.0% 
5 7.0% 71.7% 0.8% 0.1% 0.0% 
6 18.6% 29.6% 0.2% 0.2% 0.5% 
How did they rank on value added 
scores?
Teacher Evaluation Ratings in Six Florida 
Districts 2013 
Florida 
District 
Highly 
Effective 
Effective Needs 
Improvement 
Developing Unsatisfactory Ranking VA Score 
1 37.5% 57.9% 3.3% 0.3% 1.0% 5th -.06 
2 30.7% 30.2% 1.4% 1.2% 0.0% 6th -.07 
3 10.7% 44.7% 2.0% 1.4% 0.1% 3rd -.02 
4 67.7% 9.4% 0.1% 0.1% 0.0% 1st +.03 
5 7.0% 71.7% 0.8% 0.1% 0.0% 2nd +.02 
6 18.6% 29.6% 0.2% 0.2% 0.5% 4th -.04
How should tests, 
observations, and surveys be 
weighted?
Reliability of evaluation weights in predicted 
stability of student growth gains year to year 
Observation by Reliability coefficient 
(relative to state test 
value-added gain) 
Proportion of test 
variance 
explained 
Model 1 – State test – 81% 
Student surveys 17% Classroom 
Observations – 2% 
.51 26.0% 
Model 2 – State test – 50% 
Student Surveys – 25% 
Classroom Observation – 25% 
.66 43.5% 
Model 3 – State test – 33% - 
Student Surveys – 33% 
Classroom Observations – 33% 
.76 57.7%% 
Model 4 – Classroom Observation 
50% 
State test – 25% 
Student surveys – 25% 
.75 56.2% 
Bill and Melina Gates Foundation (2013, January). Ensuring Fair and Reliable Measures of Effective 
Teaching: Culminating Findings from the MET Projects Three-Year Study
Requirements for 
observations of 
teachers can 
overwhelm 
administrators.
What model of observation is 
most efficient?
Reliability of a variety of teacher observation 
implementations 
Observation by Reliability coefficient 
(relative to state test 
value-added gain) 
Proportion of test 
variance 
explained 
Principal – 1 .51 26.0% 
Principal – 2 .58 33.6% 
Principal and other administrator .67 44.9% 
Principal and three short 
.67 44.9% 
observations by peer observers 
Two principal observations and 
two peer observations 
.66 43.6% 
Two principal observations and 
two different peer observers 
.69 47.6% 
Two principal observations one 
peer observation and three short 
observations by peers 
.72 51.8% 
Bill and Melina Gates Foundation (2013, January). Ensuring Fair and 
Reliable Measures of Effective Teaching: Culminating Findings from the 
MET Projects Three-Year Study
Some simple rules to help 
you with Student Learning 
Objectives.
Rule 1 - The goal should ALWAYS be 
improvement in a domain (subject)!
Rule 2 – Goals should be evaluated 
individually and align to the teacher’s 
instructional responsibilities. 
Although we encourage teachers to collaborate 
on the setting and implementation of learning 
goals.
Common problems with instructional 
alignment 
• Using school level math and reading 
results in the evaluation of music, 
art, and other specials teachers. 
• Using general tests of a discipline 
(reading, math, science) as a major 
component of the evaluation high 
school teachers delivering specialized 
courses.
Rule 3 - All students should be in play 
relative to the goal.
Rule 4 – The goal should be challenging 
but attainable.
The difference between aspirational and 
evaluation goals 
Aspirational – I will meet my target 
weight by losing 50 pounds during the 
next year and sustain that weight for one 
year. 
Evaluation – I intend to lose 15 pounds in 
the next six months, which will move me 
from the “obese” to the “overweight” 
category, and sustain that weight for one 
year.
Is this goal attainable? 
62% of students at John Glenn Elementary met or exceeded proficiency in 
Reading/Literature last year. Their goal is to improve their rate to 82% this 
year. Is the goal reasonable? 
Oregon schools – change in 
Reading/Literature proficiency 2009-10 to 
362 351 
2010-11 
291 
173 
73 14 3 
400 
300 
200 
100 
0 
Growth 
> -30% 
> -20% > -10% > 0% > 10% > 20% > 30%
Is this goal attainable? 
45% of the students at La Brea elementary showed average growth or better 
last year. Their goal is to improve that rate to 50% this year. Is their goal 
reasonable? 
100% 
80% 
60% 
40% 
20% 
0% 
Students with average or better annual 
growth in Repus school district 
LaBrea District 
Average
Rule 5 - There should ALWAYS be multiple 
data sources.
Rule 6 – Consider including a non-cognitive 
goal if allowed.
The importance of non-cognitive 
factors in 
teacher evaluation
Non-cognitive factors 
In education, value-added 
measurement has focused 
policy-makers on the teacher’s 
contribution to academic 
success, as reflected in test 
scores. 
Jackson (2012) argues that 
teachers may have more impact 
on non-cognitive factors that are 
essential to student success like 
attendance, grades, and 
suspensions. 
These are not the only measures 
that matter however.
Non-cognitive factors 
• Lowered the average student absenteeism by 7.4 days. 
• Improved the probability that students would enroll in 
the next grade by 5 percentage points. 
Employing value-added methodologies, Jackson 
found that teachers had a substantive effect on 
non-cognitive outcomes that was independent 
of their effect on test scores 
• Reduced the likelihood of suspension by 2.8% 
• Improved the average GPA by .09 (Algebra) or .05 
(English) 
Source: Jackson, K. (2013). Non-Cognitive Ability, Test Scores and Teacher 
Quality: Evidence from 9th Grade Teachers in North Carolina. Northwestern 
University and NBER
Ultimately – the principal decides 
• Evaluation inherently involves 
judgment – not a bad thing. 
• Evidence should inform and not 
direct your judgment. 
• The implemented system should 
differentiate performance. 
• Courts respect the judgment of 
school administrators relative to 
personnel decisions.
Watch out for unintended 
consequences.

Taking control of the South Carolina Teacher Evaluation framework

  • 1.
    Taking Control ofthe Teacher Evaluation Framework for South Carolina John Cronin, Ph.D. – Senior Director of Education Research Northwest Evaluation Association
  • 2.
    What NWEA supports • The evaluation process should focus on helping teachers improve. • The principal or designated evaluator should control the evaluation. • Tests should not be the deciding factor in an evaluation. • Multiple measures should be used.
  • 3.
    A simple frameworkfor teacher evaluation Evidence of professional responsibilities Effective teaching and professional job performance Evidence of student learning The evaluation of teaching by classroom observation and use of artifacts Evidence of professional practice The evaluation of the teacher’s The evaluation effectiveness of a in making teacher’s progress contribution toward to their student goals learning and fulfilling and the responsibilities growth of a professional educator.
  • 4.
    What teacher effectiveness infers • Testing – A claim that the improvement in learning (or lack of it) reflected on one or more tests is caused by the teacher. • Classroom observation – That the observers ratings or conclusions are reliable and associated with behaviors that cause improved learning in the classroom.
  • 5.
    Distinguishing teacher effectiveness from teacher evaluation • Teacher effectiveness – The judgment of a teacher’s ability to positively impact learning in the classroom. • Teacher evaluation – The judgment of a teacher’s overall performance including: – Teacher effectiveness – Common standards of job performance – Participation in the school community – Adherence to professional standards
  • 6.
    Purposes of summativeevaluation • Make an accurate and defensible judgment of an educator’s job performance. • Provide ratings of performance that provide meaningful differentiation across educators. • Goals of evaluation – Help educators focus on their students and their practice – Retain your top educators – Dismiss ineffective educators
  • 7.
  • 8.
    Policy has focusedon dismissal of poor teachers rather than retention of excellent ones. In baseball, exceptional players are much rarer than average ones. Thus it is vital for a team to keep its best players.
  • 9.
    Employment of ElementaryTeachers 2007-2012 NUMBER OF TEACHERS 1538000 1544270 1544300 1485600 The elementary school teacher workforce shrunk by 178,000 teachers (11%) between May, 2007 and May, 2012. 1415000 1360380 2007 2008 2009 2010 2011 2012 Source: (2012, May) Bureau of Labor Statistics – Occupational Employment Statistics Numbers exclude special education and kindergarten teachers
  • 10.
    The impact ofseniority based layoffs on school quality In a simulation study of implementation of a layoff of 5% of teachers using New York City data, reliance on seniority based layoffs resulted would: • Result in 25% more teachers laid off. • Teachers laid off would be .31 standard deviations more effective (using a value-added criterion) than those lost using an effectiveness criterion. • 84% of teachers with unsatisfactory ratings would be retained. Source: Boyd, L., Lankford, H., Loeb, S., and Wycoff, J. (2011). Center for Education Policy. Stanford University.
  • 11.
    Teacher observation asa part of teacher evaluation Systematic observation of teacher performance is a central part of every state’s teacher evaluation plan.
  • 12.
    If evaluators do not differentiate their ratings, then all differentiation comes from the test.
  • 13.
    If performance ratingsaren’t consistent with school growth, the media and public will demand to know why.
  • 14.
    “The (Race tothe Top teacher evaluation) changes, already under way in some cities and states, are intended to provide meaningful feedback and, critically, to weed out weak performers. And here are some of the early results: In Florida, 97 percent of teachers were deemed effective or highly effective in the most recent evaluations. In Tennessee, 98 percent of teachers were judged to be “at expectations.” In Michigan, 98 percent of teachers were rated effective or better.” Source: New York Times (2013, March 30). Curious Grade for Teachers: Nearly all Pass. Retrieved from: http://www.nytimes.com/2013/03/31/education/curious-grade-for-teachers-nearly-all- pass.html?pagewanted=all&_r=0
  • 15.
    Teacher Evaluation Ratingsin Six Florida Districts 2013 Florida District Highly Effective Effective Needs Improvement Developing Unsatisfactory VA Score Florida Ranking 1 44.4% 55.6% 0.0% 0.0% 0.0% 2 25.0% 75.0% 0.0% 0.0% 0.0% 3 90.9% 9.1% 0.0% 0.0% 0.0% 4 60.7% 39.3% 0.0% 0.0% 0.0% 5 81.2% 18.8% 0.0% 0.0% 0.0% 6 37.3% 54.2% 1.7% 0.0% 6.8% 7 81.3% 18.8% 0.0% 0.0% 0.0% 8 41.7% 55.6% 1.4% 1.4% 0.0% 9 52.2% 47.8% 0.0% 0.0% 0.0% 10 27.0% 66.2% 1.4% 0.0% 5.4% 11 7.1% 72.6% 9.5% 10.7% 0.0%
  • 16.
    Teacher Evaluation Ratingsin Six Florida Districts 2013 Florida District Highly Effective Effective Needs Improvement Developing Unsatisfactory VA Score Florida Ranking 1 44.4% 55.6% 0.0% 0.0% 0.0% 0.39 109 2 25.0% 75.0% 0.0% 0.0% 0.0% 0.37 121 3 90.9% 9.1% 0.0% 0.0% 0.0% -0.14 2802 4 60.7% 39.3% 0.0% 0.0% 0.0% -0.14 2797 5 81.2% 18.8% 0.0% 0.0% 0.0% -0.16 2831 6 37.3% 54.2% 1.7% 0.0% 6.8% 0.12 880 7 81.3% 18.8% 0.0% 0.0% 0.0% 0.22 402 8 41.7% 55.6% 1.4% 1.4% 0.0% -0.34 3274 9 52.2% 47.8% 0.0% 0.0% 0.0% 0.16 664 10 27.0% 66.2% 1.4% 0.0% 5.4% 0 1764 11 7.1% 72.6% 9.5% 10.7% 0.0% -0.08 2445
  • 17.
    Teacher Evaluation Ratingsin Six Florida Districts 2013 Florida District Highly Effective Effective Needs Improvement Developing Unsatisfactory Ranking 1 37.5% 57.9% 3.3% 0.3% 1.0% 2 30.7% 30.2% 1.4% 1.2% 0.0% 3 10.7% 44.7% 2.0% 1.4% 0.1% 4 67.7% 9.4% 0.1% 0.1% 0.0% 5 7.0% 71.7% 0.8% 0.1% 0.0% 6 18.6% 29.6% 0.2% 0.2% 0.5% How did they rank on value added scores?
  • 18.
    Teacher Evaluation Ratingsin Six Florida Districts 2013 Florida District Highly Effective Effective Needs Improvement Developing Unsatisfactory Ranking VA Score 1 37.5% 57.9% 3.3% 0.3% 1.0% 5th -.06 2 30.7% 30.2% 1.4% 1.2% 0.0% 6th -.07 3 10.7% 44.7% 2.0% 1.4% 0.1% 3rd -.02 4 67.7% 9.4% 0.1% 0.1% 0.0% 1st +.03 5 7.0% 71.7% 0.8% 0.1% 0.0% 2nd +.02 6 18.6% 29.6% 0.2% 0.2% 0.5% 4th -.04
  • 19.
    How should tests, observations, and surveys be weighted?
  • 20.
    Reliability of evaluationweights in predicted stability of student growth gains year to year Observation by Reliability coefficient (relative to state test value-added gain) Proportion of test variance explained Model 1 – State test – 81% Student surveys 17% Classroom Observations – 2% .51 26.0% Model 2 – State test – 50% Student Surveys – 25% Classroom Observation – 25% .66 43.5% Model 3 – State test – 33% - Student Surveys – 33% Classroom Observations – 33% .76 57.7%% Model 4 – Classroom Observation 50% State test – 25% Student surveys – 25% .75 56.2% Bill and Melina Gates Foundation (2013, January). Ensuring Fair and Reliable Measures of Effective Teaching: Culminating Findings from the MET Projects Three-Year Study
  • 21.
    Requirements for observationsof teachers can overwhelm administrators.
  • 22.
    What model ofobservation is most efficient?
  • 23.
    Reliability of avariety of teacher observation implementations Observation by Reliability coefficient (relative to state test value-added gain) Proportion of test variance explained Principal – 1 .51 26.0% Principal – 2 .58 33.6% Principal and other administrator .67 44.9% Principal and three short .67 44.9% observations by peer observers Two principal observations and two peer observations .66 43.6% Two principal observations and two different peer observers .69 47.6% Two principal observations one peer observation and three short observations by peers .72 51.8% Bill and Melina Gates Foundation (2013, January). Ensuring Fair and Reliable Measures of Effective Teaching: Culminating Findings from the MET Projects Three-Year Study
  • 24.
    Some simple rulesto help you with Student Learning Objectives.
  • 25.
    Rule 1 -The goal should ALWAYS be improvement in a domain (subject)!
  • 26.
    Rule 2 –Goals should be evaluated individually and align to the teacher’s instructional responsibilities. Although we encourage teachers to collaborate on the setting and implementation of learning goals.
  • 27.
    Common problems withinstructional alignment • Using school level math and reading results in the evaluation of music, art, and other specials teachers. • Using general tests of a discipline (reading, math, science) as a major component of the evaluation high school teachers delivering specialized courses.
  • 28.
    Rule 3 -All students should be in play relative to the goal.
  • 29.
    Rule 4 –The goal should be challenging but attainable.
  • 30.
    The difference betweenaspirational and evaluation goals Aspirational – I will meet my target weight by losing 50 pounds during the next year and sustain that weight for one year. Evaluation – I intend to lose 15 pounds in the next six months, which will move me from the “obese” to the “overweight” category, and sustain that weight for one year.
  • 31.
    Is this goalattainable? 62% of students at John Glenn Elementary met or exceeded proficiency in Reading/Literature last year. Their goal is to improve their rate to 82% this year. Is the goal reasonable? Oregon schools – change in Reading/Literature proficiency 2009-10 to 362 351 2010-11 291 173 73 14 3 400 300 200 100 0 Growth > -30% > -20% > -10% > 0% > 10% > 20% > 30%
  • 32.
    Is this goalattainable? 45% of the students at La Brea elementary showed average growth or better last year. Their goal is to improve that rate to 50% this year. Is their goal reasonable? 100% 80% 60% 40% 20% 0% Students with average or better annual growth in Repus school district LaBrea District Average
  • 33.
    Rule 5 -There should ALWAYS be multiple data sources.
  • 34.
    Rule 6 –Consider including a non-cognitive goal if allowed.
  • 35.
    The importance ofnon-cognitive factors in teacher evaluation
  • 36.
    Non-cognitive factors Ineducation, value-added measurement has focused policy-makers on the teacher’s contribution to academic success, as reflected in test scores. Jackson (2012) argues that teachers may have more impact on non-cognitive factors that are essential to student success like attendance, grades, and suspensions. These are not the only measures that matter however.
  • 37.
    Non-cognitive factors •Lowered the average student absenteeism by 7.4 days. • Improved the probability that students would enroll in the next grade by 5 percentage points. Employing value-added methodologies, Jackson found that teachers had a substantive effect on non-cognitive outcomes that was independent of their effect on test scores • Reduced the likelihood of suspension by 2.8% • Improved the average GPA by .09 (Algebra) or .05 (English) Source: Jackson, K. (2013). Non-Cognitive Ability, Test Scores and Teacher Quality: Evidence from 9th Grade Teachers in North Carolina. Northwestern University and NBER
  • 38.
    Ultimately – theprincipal decides • Evaluation inherently involves judgment – not a bad thing. • Evidence should inform and not direct your judgment. • The implemented system should differentiate performance. • Courts respect the judgment of school administrators relative to personnel decisions.
  • 39.
    Watch out forunintended consequences.