Download to read offline

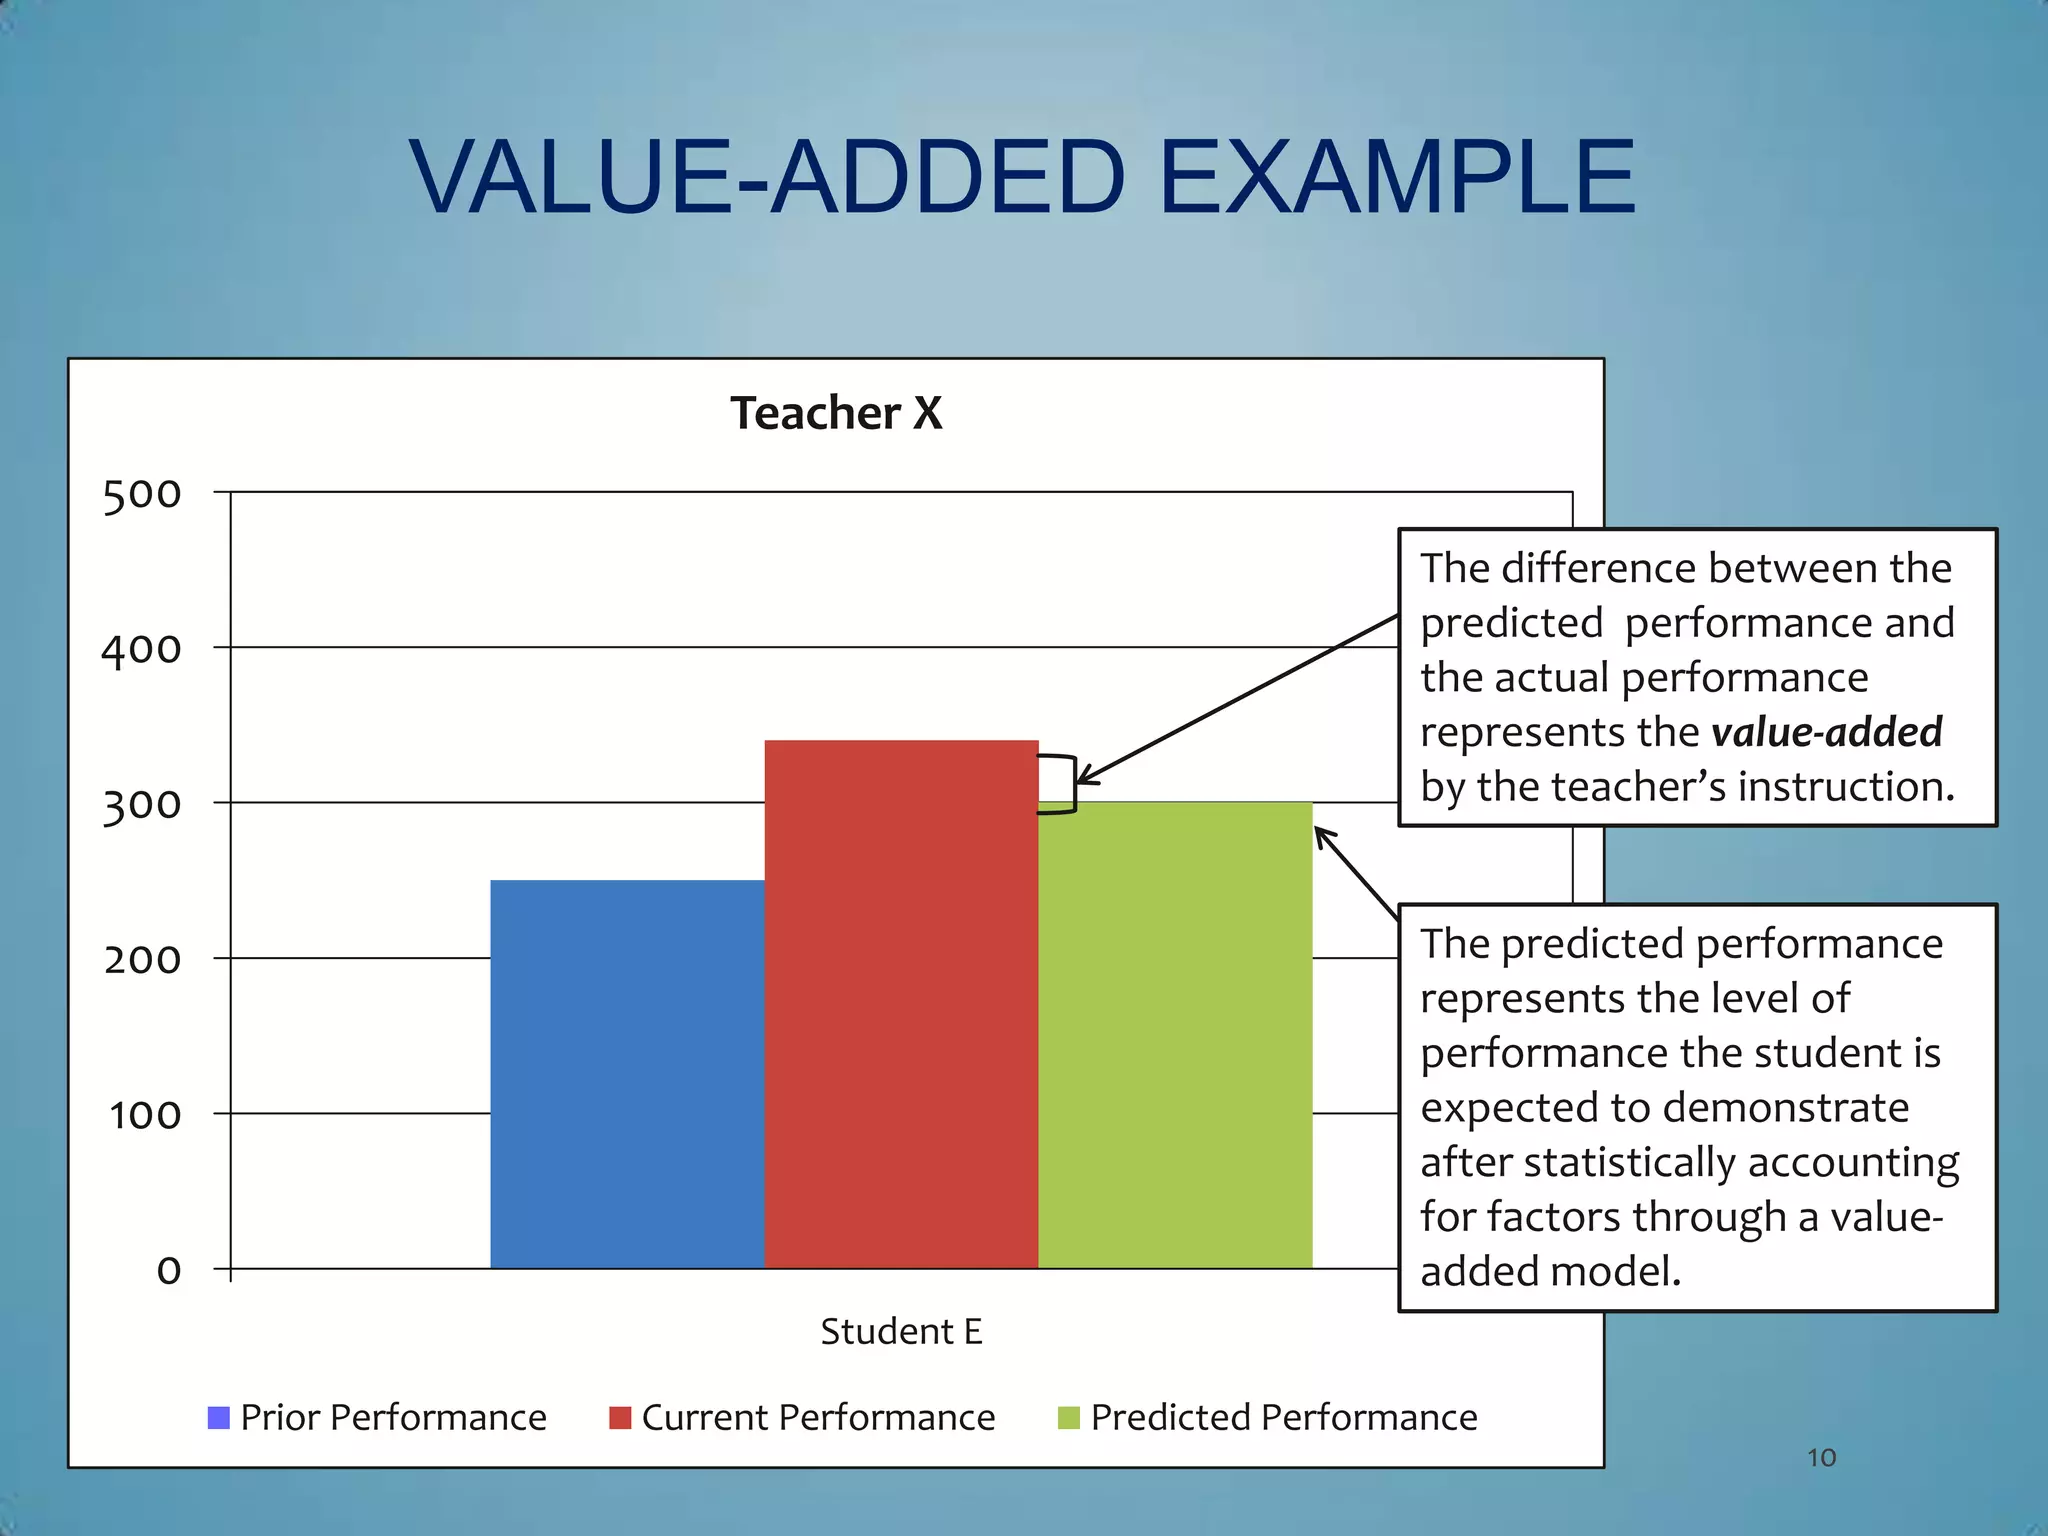
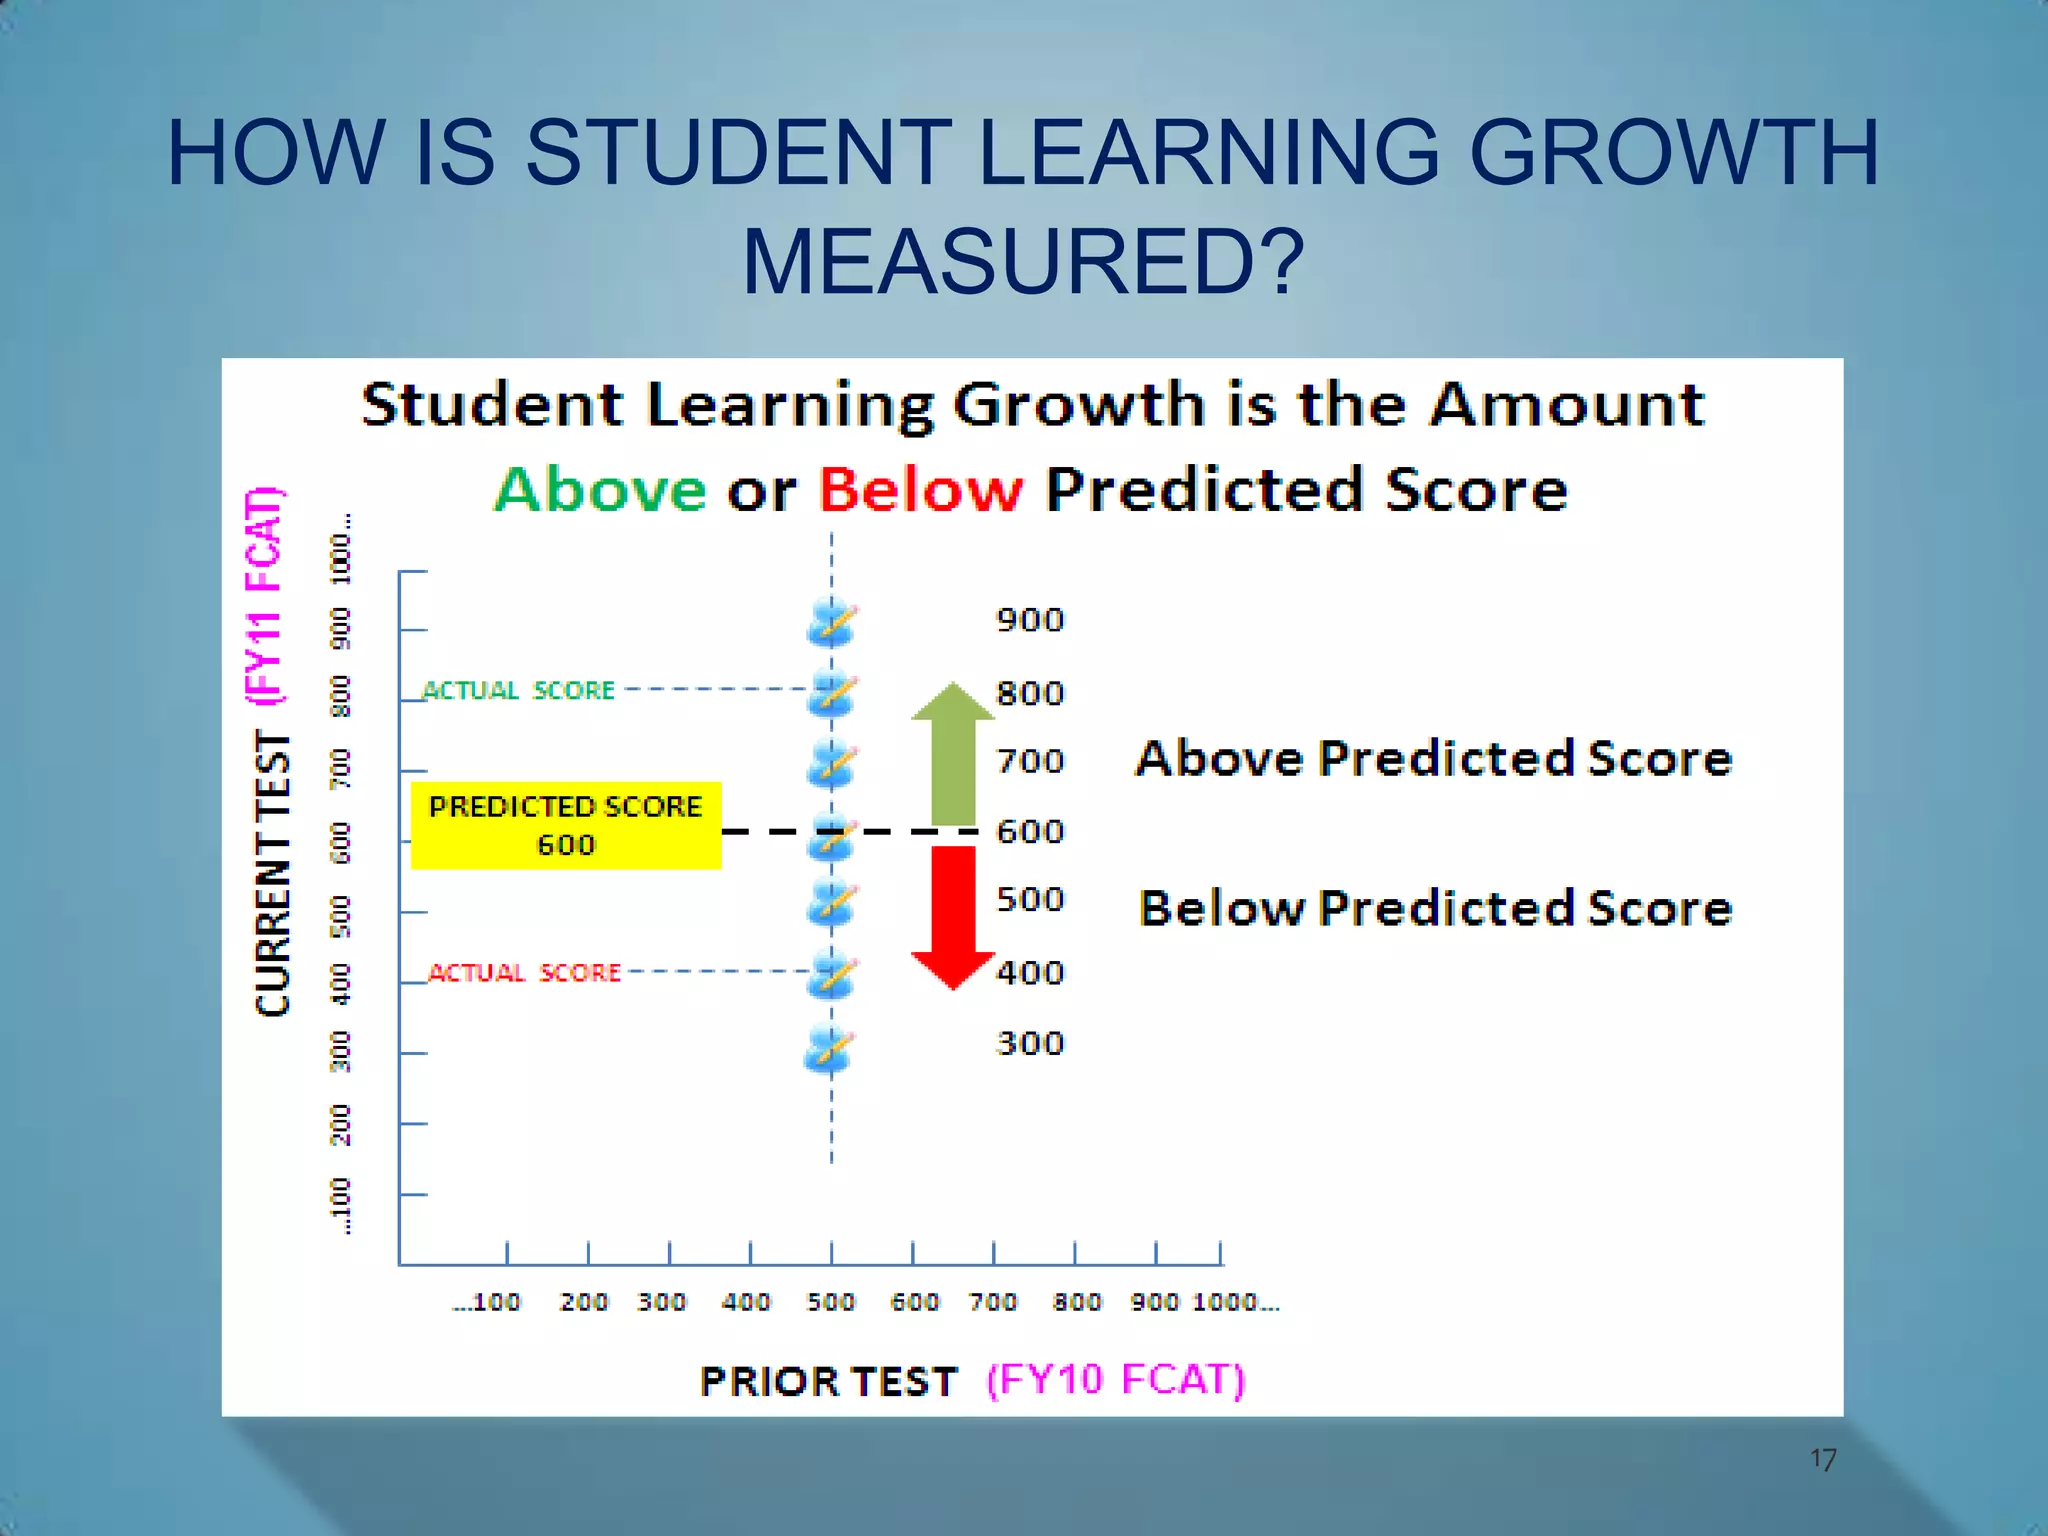
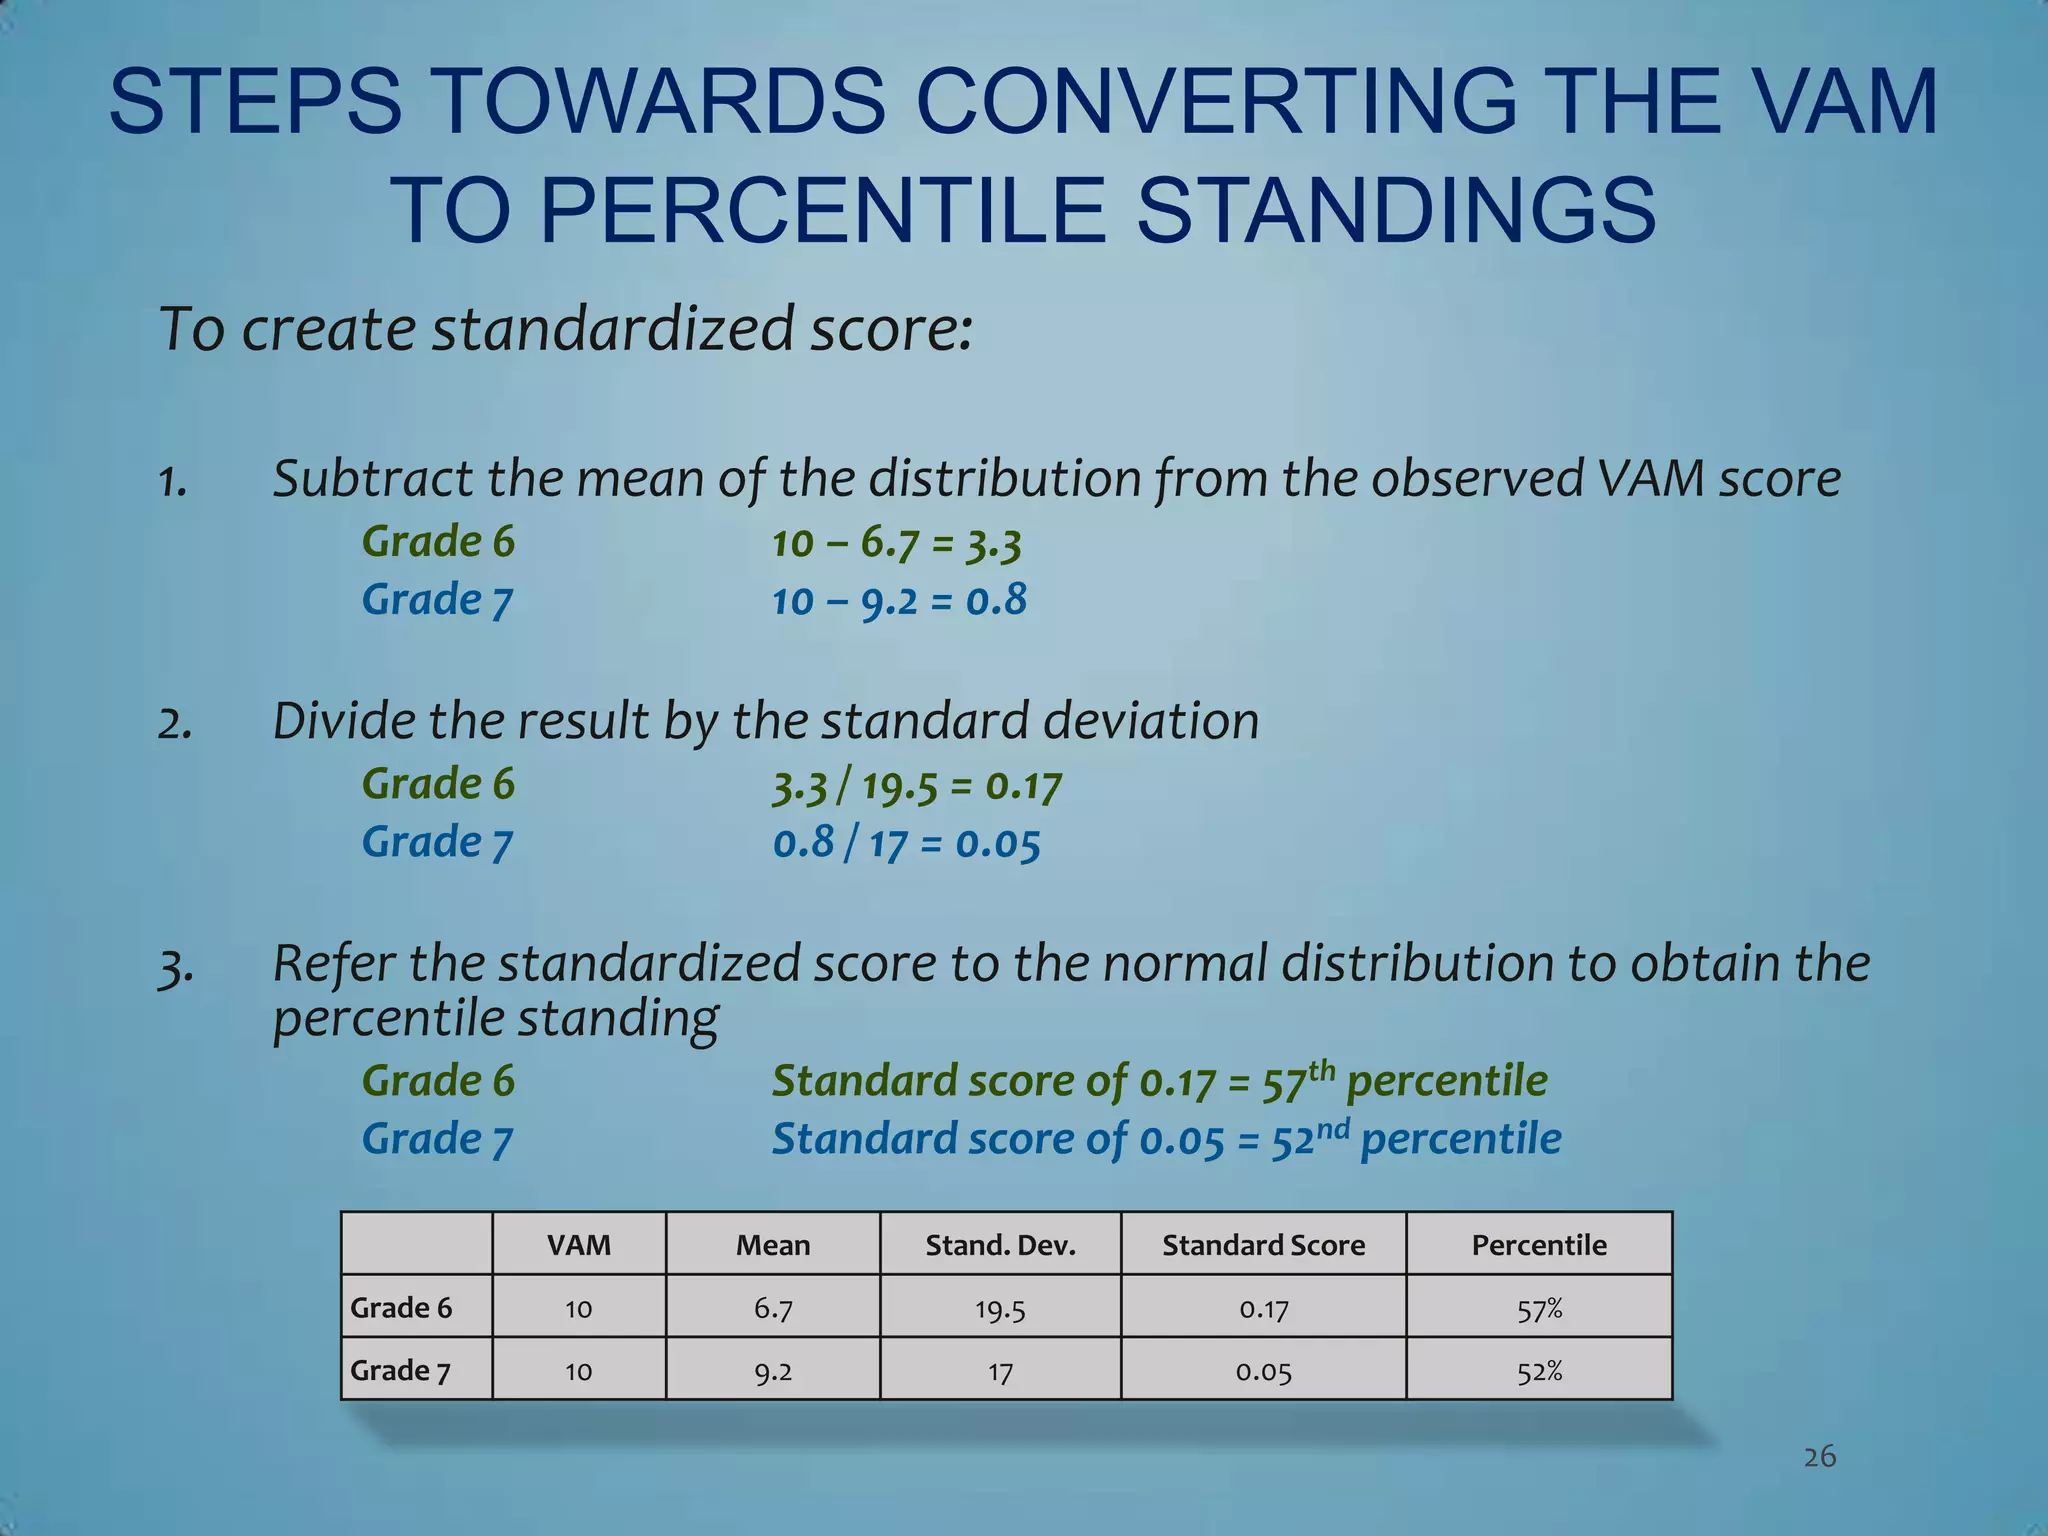
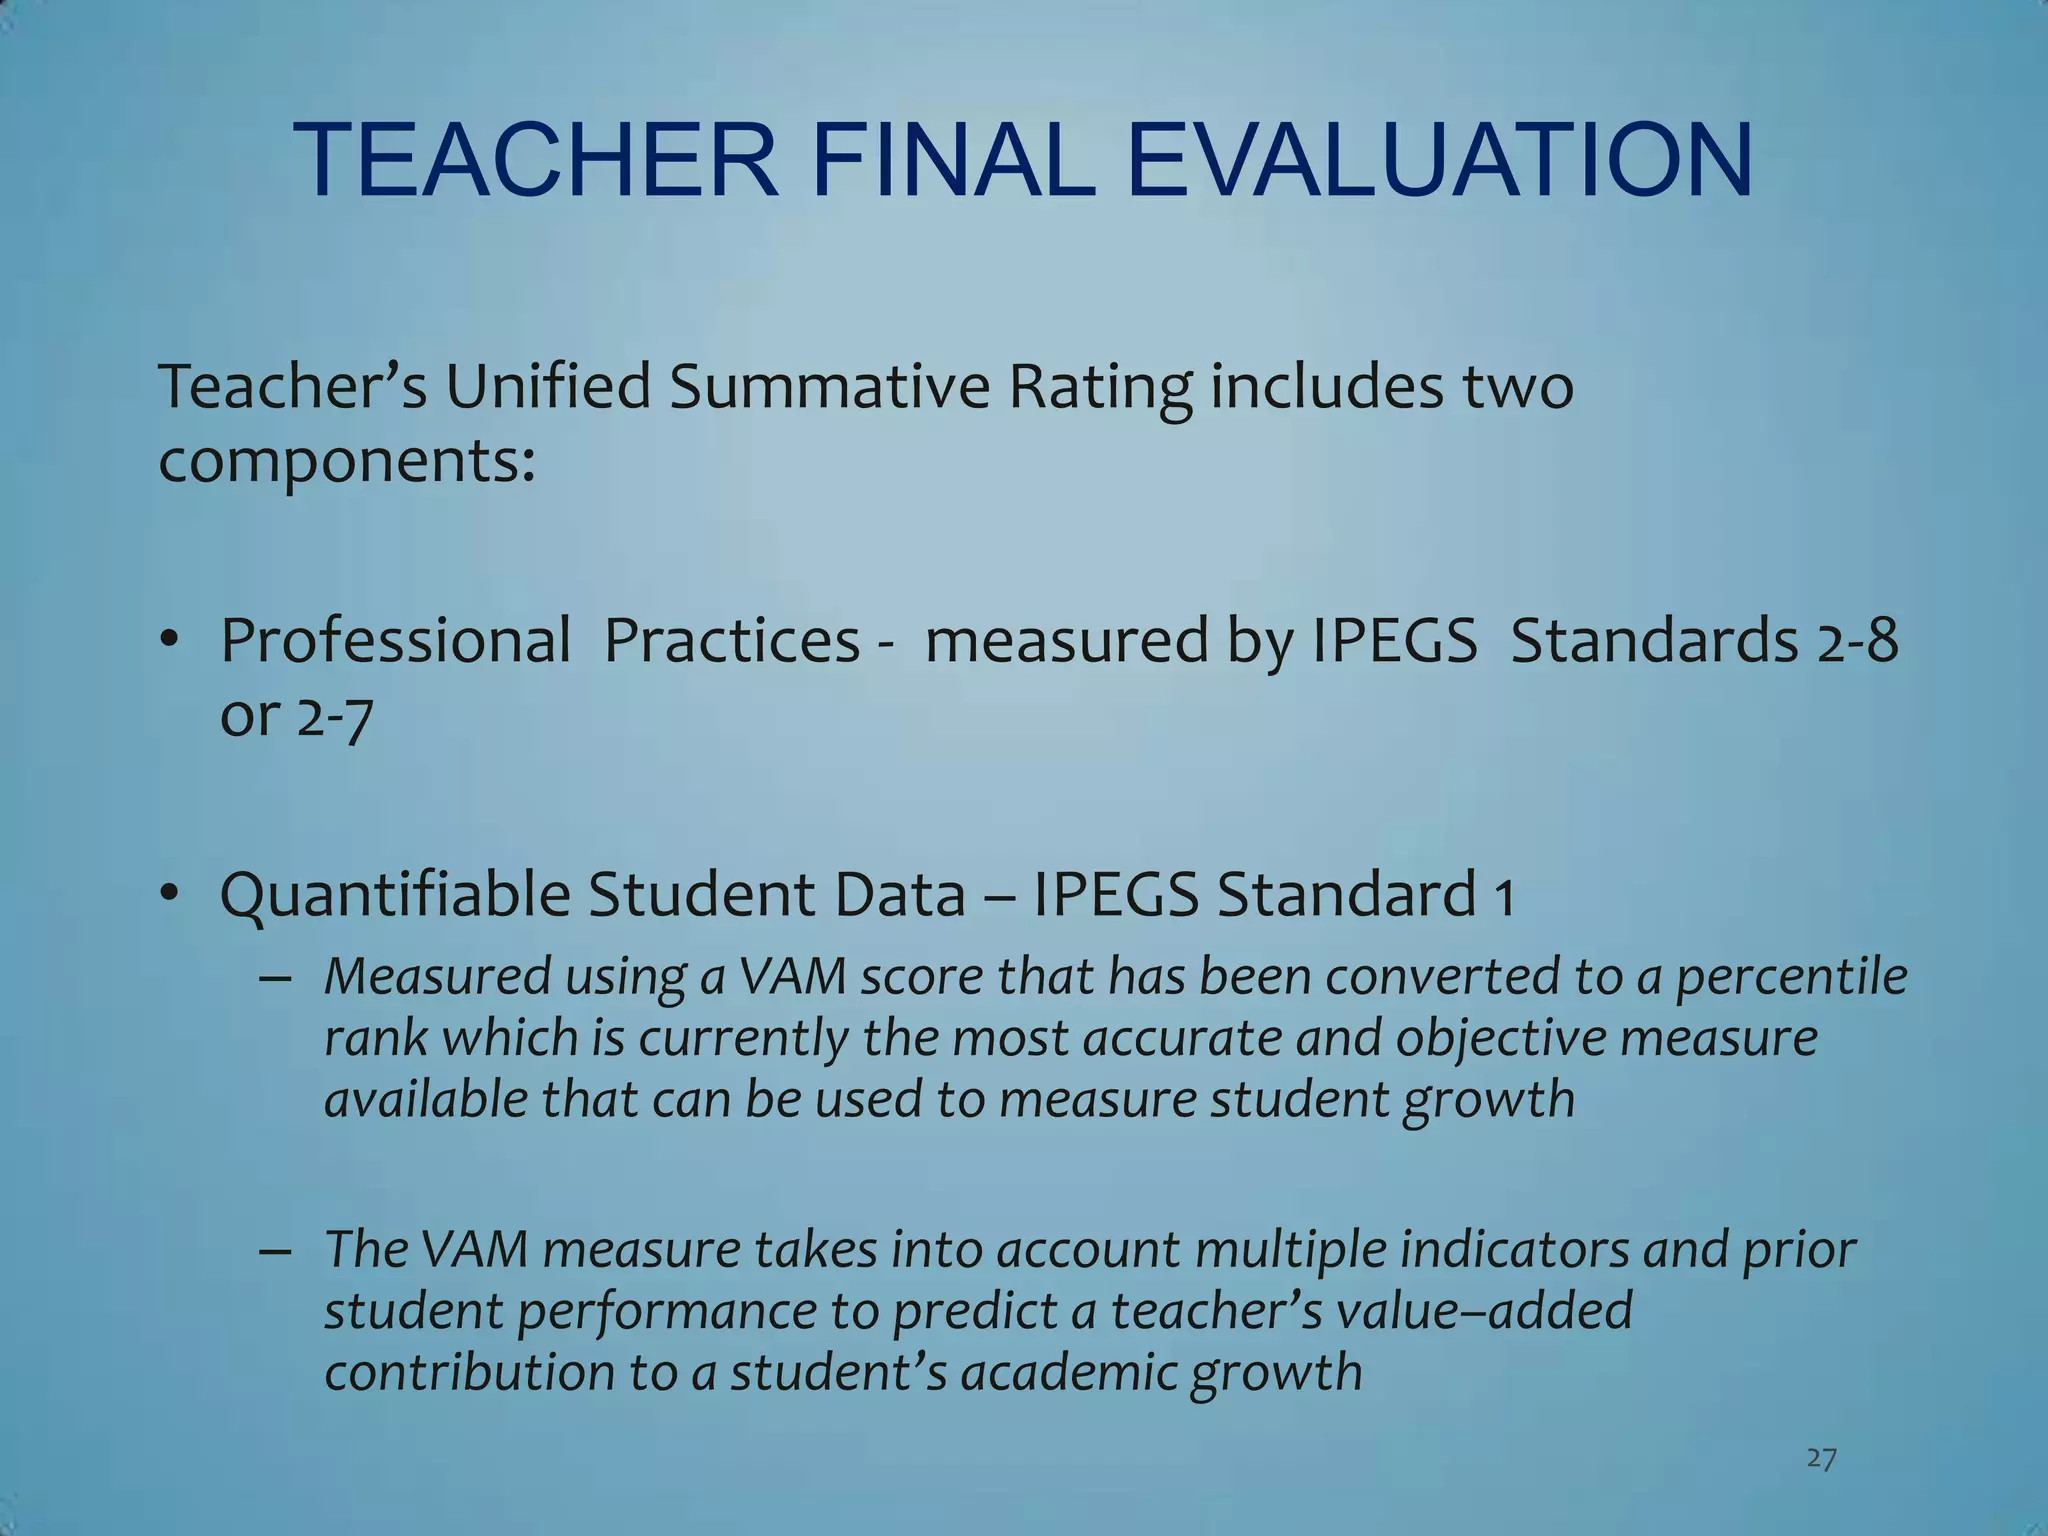


The document describes Florida's value-added model for measuring student growth and evaluating teachers. It was developed by the Student Growth Implementation Committee with input from educators across the state. The model uses multiple years of student test score data and student characteristics to generate an expected score for each student. The difference between actual and expected scores determines student learning growth attributed to the teacher. The model aims to account for factors outside a teacher's control and provide an accurate measure of their impact on students.


