Download as PDF, PPTX


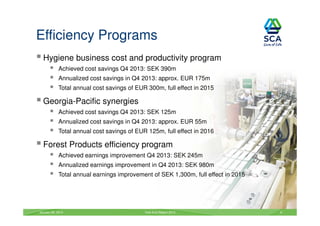
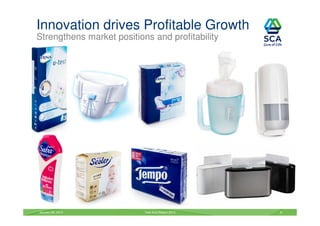

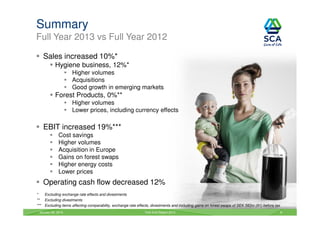
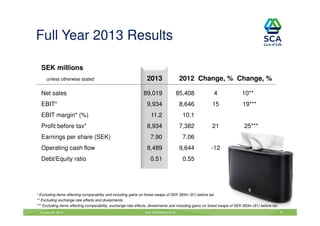

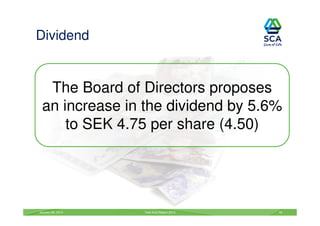
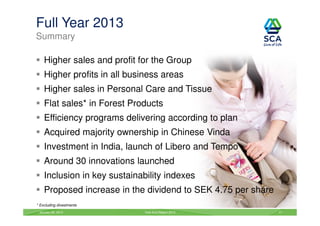


The SCA year-end report for 2013 highlights a 10% increase in sales driven by good growth in personal care and tissue markets, alongside efficiency programs that resulted in significant cost savings. The company made strategic acquisitions, including majority ownership in a Chinese tissue company and investments in India. Overall, SCA reported higher sales and profits across all business areas, as well as a proposed increase in dividends by 5.6%.


