Download to read offline

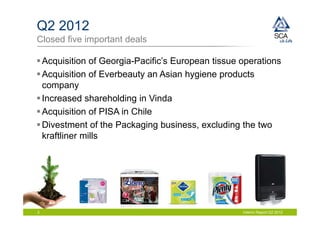


The interim report summarizes the company's performance in the second quarter of 2012. It notes that the global economy slowed in 2012 due to issues in Western Europe. The hygiene products business saw good growth in emerging markets. Forest product sales and prices decreased in Europe. The company acquired several businesses and divested its packaging business. Sales increased 2% year-over-year due to growth in hygiene products, while EBIT grew 16% on higher volumes and lower costs. The personal care and tissue segments saw higher sales and profits from emerging markets. Forest products struggled with lower prices.


