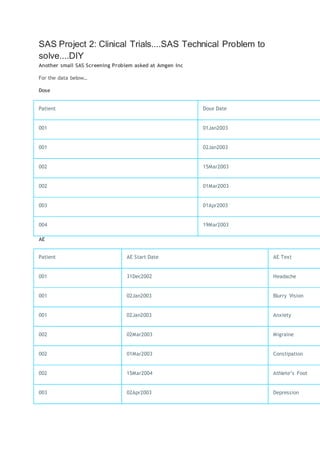
List of SAS programs
Reading data using simple list input.
Reading data using column input
Reading data using formatted input
Reading data using named input
Reading comma delimited data w ith modified list input
Reading a TAB delimited file
Reading multiple records to create one observation
Use of PROC IMPORT to read a CSV, TAB or delimited file
Reading a comma delimited file w ith a .csv extension
Creating a delimited file using a PUT statement
Creating an external file w ith column-aligned data
Concatenating data sets Using SET
A Simple MERGE
Merging and creation of subsets based on Origin
Convert missing values to zero and values of zero to missing
Convert selected numeric values from zero to missing
Create and apply user-defined formats
Convert values from character to numeric
Convert values from numeric to character
Working w ith Dates in the SAS System
Use of MDY function
Convert a SAS date to a character variable
Calculate number of years, months, and days betw een tw o dates
Determine the w eek number of the year
DO LOOP block
Using the SCAN function
INDEX Function for String Search
Using arrays and DO loop in Data Step
Using _TEMPORARY_ arrays for Missing value Treatment
A Simple SAS Macro
BASIC PROC SQL Exercises
MERGING using PROC SQL
PROC FREQ- Options available
PROC MEANS
PROC SUMMARY
Comparison of MEANS and SUMMARY Output
PROC GPLOT
Appendix-I Practice Programs
Reading data using simple list input.
This program reads in data separated by a blank space using simple list input style in the INPUT
statement. If your data is delimited by another character other than a blank or space, the DLM= option
and/or DSD option on the INFILE statement will need to be specified.
data grades;
infile datalines;
input student $ test1-test4;
datalines;
A1237 3.8 3.7 3.2 3.9
A9361 2.9 3.0 3.6 3.5
B3051 4.0 3.8 3.9 4.0
;
proc print;
run;
Reading data using column input
Note: Column input requires the data to be standard numeric or character data
data employee;
input lastname $ 1-10 fname $ 12-21 ssn 23-31 status $ 33-38;
datalines;
Green Samual 888888888 Hourly
Brennon Carol 123456789 Salary
Wang Robert 999999999 Salary
Randolph Virginia 987654321 Salary
;
proc print;
run;
Reading data using formatted input
This program reads in data using informats for a file with no delimiters.
data acctinfo;
input acctnum $8. date mmddyy10. amount comma9.;
format date mmddyy10.;
datalines;
0074309801/15/2001$1,003.59
1028754301/17/2001$672.05
3320899201/19/2001$702.77
0345900601/19/2001$1,209.61
;
proc print;
run;
Reading data using named input
Read datalines or records that contain a variable name followed by an equal sign and the value.
data deptinfo;
input dept $ last= $ first= $ start= $10.;
datalines;
acct start=15-01-2000 first=Mary last=Lowe
hr start=01-09-1984 first=Greg last=Richards
oper start=01-11-1990 first=Cindy last=Lou
oper start=15-05-1995 first=Julie last=Simpson
acct start=01-03-1999 first=Sam last=Hampton
;
proc print;
run;
Reading comma delimited data with modified list input
Read in comma-delimited data by specifying the DSD option on the INFILE statement and using modified
list-input style.
data grades;
infile datalines dsd;
input student :$20. test1-test4 fee :dollar8.;
datalines;
"Alexander,Bertrum",3.8,,,3.9,$500
"Chang,Daniel",,3.0,3.6,3.5,$400
"Elano,Fen",4.0,3.8,3.9,4.0,$300
;
proc print;
run;
Reading a TAB delimited file
Read an external file into a SAS data set when the variables in the external file are separated with a
TAB character. Note: On ASCII systems (PC, UNIX, MAC, VMS) the hex representation of a TAB
character is '09'x. On EBCDIC systems (VM, MVS, VSE) the hex representation of a TAB is '05'x.
data _null_;
file 'c:temptabdlm.txt';
put "Samuel B. Thompson" '09'x "04/28/1995" '09'x "Raleigh";
put "Suzy B. Thomspon" '09'x "5/1/1993" '09'x "Wake Forest";
run;
data info;
infile 'c:temptabdlm.txt' DSD dlm='09'x truncover;
input name :$30. DOB :mmddyy8. city :$20.;
run;
proc print;
format dob mmddyy8.; run;
Reading multiple records to create one observation
This program creates one SAS record by reading multiple records from the source dataset.
/* Create sample data with variable length records. */
/* Each person's data spans multiple records. */
data test;
infile datalines n=4 truncover;
input #1 @1 name $15.
#2 @1 address1 $22.
#3 @1 address2 $30.
#4 @1 phone_no $12.;
datalines;
Sonya Larson
10054 Plum Tree Rd
Buffalo NY 10068
716-555-1348
Kip Holfser
902 West Blvd
Lansing, MI 48910
517-555-0227
Chan Rong
3052 East Bank Way
Savannah GA 30058
912-555-0025
Randy Nguyen
100 49th Street
Harrisburg PA 19075
717-555-7773
;
proc print;
run;
Use of PROC IMPORT to read a CSV, TAB or delimited file
This program reads an exclamation point (!) delimited file variable names on the first row.
data _null_;/* Create test file to read using PROC IMPORT below. */
file 'c:temppipefile.txt';
put"x1!x2!x3!x4";
put "11!22!.! ";
put "111!.!333!apple";
run;
proc import
datafile='c:temppipefile.txt'
out=work.test
dbms=dlm
replace; /* note this is the first semi-colon */
delimiter='!';
getnames=yes;
run;
proc print;
run;
Reading a comma delimited file with a .csv extension
Since the DBMS= value is CSV, you do not have to use the DELIMITER= statement. Also
assuming the variable names are on the first row, the GETNAMES= statement is also not
required.
/* Create comma delimited test file to read using PROC IMPORT
below. */
data _null_;
file 'c:tempcsvfile.csv';
put"var1,var2,var3,var4";
put "apple,banana,coconut,date";
put "apricot,berry,crabapple,dewberry";
run;
proc import
datafile='c:tempcsvfile.csv'
out=work.fruit
dbms=csv
replace;
run;
proc print;
run;
Creating a delimited file using a PUT statement
filename xx 'd:test.txt';
data _null_;
set sashelp.shoes (keep= Region Returns Sales obs=20);
file xx dlm='~';
put Region Returns Sales;
run;
Open the file 'd:test.txt' to see the output.
Creating an external file with column-aligned data
With column style output, specify the starting and ending column numbers for the output data after the
variable name. The sample below uses column style PUT for NAME and AGE.
You can also use control pointers on a PUT statement to align data in columns. Below, an absolute
control pointer ("@") specifies column 20 as the starting position for SEX. Relative control pointers
("+n") help align WEIGHT and HEIGHT.
data _null_;
set sashelp.class (obs=8);
file log;
put name 1-8 age 13-15 @20 sex +5 weight 5.1 +5 height;
run;
Concatenating data sets Using SET
data one;
input name $ age;
datalines;
Chris 36
Jane 21
Jerry 30
Joe 49
;
data two;
input name $ age group;
datalines;
Daniel 33 1
Terry 40 2
Michael 60 3
Tyrone 26 4
;
data both;
set one two;
run;
proc print data=both;
A Simple MERGE
/* Create sample data */
data one;
input id $ fruit $;
datalines;
a apple
a apple
b banana
c coconut
;
data two;
input id $ color $;
datalines;
a amber
b brown
c cream
c cocoa
c carmel
;
data both;
merge one two;
by id;
run;
proc print data=both;
run;
Merging and creation of subsets based on Origin
This program demonstrates how to do Merging data sets by a common variable and create output
data sets based upon observation origin.
data one;
input id $ name $ dept $ project
$;
datalines;
000 Miguel A12
Document
111 Fred B45
Survey
222 Diana B45
Document
888 Monique A12
Document
999 Vien D03
Survey
;
data two;
input id $ name $
projhrs;
datalines;
111 Fred
35
222 Diana
40
777 Steve
0
888 Monique
37
999 Vien
42
;
data both one_only
two_only;
merge one(in=in1)
two(in=in2);
by id;
if in1 and
in2 then output both;
else if in1 then output one_only;
else outputtwo_only;
run;
title 'Both';
proc print data=both;
run;
title 'One only';
proc print data=one_only;
run;
title 'Two only';
proc print data=two_only;
run;
Convert missing values to zero and values of zero to missing
This program converts missing values to zero and values of zero to missing for numeric variables.
Method is to Use the ARRAY statement with the automatic _NUMERIC_ variable to process all the
numeric variables from the input data set. Use the DIM function to set the upper bound of an
iterative DO to the number of elements in the array.
/* Example 1 - Convert all numeric missing values to zero. */
/* Create sample data */
data numbers;
input var1 var2 var3;
datalines;
7 1 4
. 0 8
9 9 .
5 6 2
8 3 0
;
data nomiss(drop=i);
set numbers;
array testmiss(*) _numeric_;
do i = 1 to dim(testmiss);
if testmiss(i)=. then testmiss(i)=0;
end;
run;
proc print;
run;
Convert selected numeric values from zero to missing
Use the ARRAY statement to define the specific numeric variables to change from a value of zero to a
missing value. Use the DIM function to set the upper bound of an iterative DO to the number of
elements in the array.
data deptnum;
input dept qrt1 qrt2 qrt3 qrt4;
datalines;
101 3 0 4 9
410 8 7 5 8
600 0 0 6 7
700 6 5 6 9
901 3 8 7 0
;
data nozero(drop=i);
set deptnum;
array testzero(*) qrt1-qrt4;
do i = 1 to dim(testzero);
if testzero(i)=0 then testzero(i)=.;
end;
run;
proc print;
run;
Create and apply user-defined formats
proc format;
value codesc 1-50='low'
50-high='high';
run;
data values;
input prodnum custnum $ code;
datalines;
64412 D0001568 49
64412 Z0056012 51
78001 C0000969 3
78001 F0032140 11
88204 B0000073 79
89569 R0022217 1
99301 H0009355 99
99301 C0000889 58
;
data values;
set values;
codefmt=put(code,codesc.);
run;
proc print data=values;
run;
Convert values from character to numeric
This program converts a character value to a numeric value by using the INPUT function. Specify a
numeric informat that best describes how to read the data value into the numeric variable.
data char;
input string :$8. date :$6.;
numeric=input(string,8.);
sasdate=input(date,mmddyy6.);
format sasdate mmddyy10.;
datalines;
1234.56 031704
3920 123104
;
proc print;
run;
Convert values from numeric to character
Converts a numeric value to a character value by using the PUT function. Specify a numeric format
that describes how to write the numeric value to the character variable. To left align the resulting
character value, specify -L after the format specification.
data num;
input num date: mmddyy6.;
datalines;
123456 110204
1000 120504
;
data now_char;
set num (rename=(num=oldnum date=olddate));
num=put(oldnum,6. -L);
date=put(olddate,date9.);
run;
proc print;
run;
Working with Dates in the SAS System
SAS System has various date formats a the programs below demonstrates various such formats in SAS
data steps.
data dates;
input country $ 1-11 @13 depart date7. nights;
cards;
Japan 13may89 8
Greece 17oct89 12
New Zealand 03feb90 16
Brazil 28feb90 8
Venezuela 10nov89 9
Italy 25apr89 8
USSR 03jun89 14
Switzerland 14jan90 9
Australia 24oct89 12
Ireland 27may89 7
;
proc print data=dates;
title 'Departure Dates with SAS Date Values';
run;
proc print data=dates;
title 'Departure Dates in Calendar Form';
format depart mmddyy8.;
run;
data tourdate;
set dates;
format depart date7.;
run;
proc contents data=tourdate;
run;
proc print data=tourdate;
title 'Report with Departure Date Spelled Out';
format depart worddate18.;
run;
proc sort data=tourdate out=sortdate;
by depart;
run;
proc print data=sortdate;
var depart country nights;
title 'Departure Dates Listed in Chronological Order';
run;
data home;
set tourdate;
return=depart+nights;
format return date7.;
run;
proc print data=home;
title 'Dates of Departure and Return';
run;
data corrdate;
set tourdate;
if country='Switzerland' then depart='21jan90'd;
run;
proc print data=corrdate;
title 'Corrected Value for Switzerland';
run;
data pay;
set tourdate;
duedate=depart-30;
if weekday(duedate)=1 then duedate=duedate-1;
format duedate weekdate29.;
run;
proc print data=pay;
var country duedate;
title 'Date and Day of Week Payment Is Due';
run;
data ads;
set tourdate;
now=today();
if now+90<=depart<=now+120;
run;
proc print data=ads;
title 'Tours Departing between 90 and 120 Days from Today';
format now date7.;
run;
/* Calculating a duration in days */
data temp;
start='08feb82'd;
rightnow=today();
age=rightnow-start;
format start rightnow date7.;
run;
proc print data=temp;
title 'Age of Tradewinds Travel';
run;
/* Calculating a duration in years */
data temp2;
start='08feb82'd;
rightnow=today();
agedays=rightnow-start;
ageyrs=agedays/365.25;
format ageyrs 4.1 start rightnow date7.;
run;
proc print data=temp2;
title 'Age in Years of Tradewinds Travel';
run;
Use of MDY function
/* Use month, day and year variables to create a SAS date*/
data one;
input month day year;
datalines;
1 1 99
02 02 2000
;
data two;
set one;
sasdate=mdy(month,day,year);
format sasdate mmddyy10.;
run;
proc print;
run;
Convert a SAS date to a character variable
data one;
input sasdate :mmddyy6.;
datalines;
010199
;
data two;
set one;
chardate=put(sasdate,mmddyy6.);
run;
proc print;
run;
Calculate number of years, months, and days between two dates
data a;
input @1 dob mmddyy10.;
tod=today(); /* Get the current date from operating system */
/* Determine number of days in the month prior to current month */
bdays=day(intnx('month',tod,0)-1);
/* Find difference in days, months, and years between */
/* start and end dates */
dd=day(tod)-day(dob);
mm=month(tod)-month(dob);
yy=year(tod)-year(dob);
/* If the difference in days is a negative value, add the number */
/* of days in the previous month and reduce the number of months */
/* by 1. */
if dd < 0 then do;
dd=bdays+dd;
mm=mm-1;
end;
/* If the difference in months is a negative number add 12 */
/* to the month count and reduce year count by 1. */
if mm < 0 then do;
mm=mm+12;
yy=yy-1;
end;
format dob tod mmddyy10.;
datalines;
01/01/1970
02/28/1992
01/01/2000
03/01/2000
05/10/1990
05/11/1990
05/12/1990
;
proc print;
run;
Determine the week number of the year
data test; * Create sample data */;
input date :mmddyy6.;
format date date9.;
datalines;
010104
010404
041804
081804
123104
;
data getweek;
set test;
/* Use INTNX to roll DATE back to the first of the year. */
/* Pass the result as the 'start' parameter to INTCK. */
week=intck('week',intnx('year',date,0),date)+1;
run;
proc print;
run;
DO LOOP block
This program demonstrates how to conditionally adjust variable values with a DO block in a SAS data
step
/* Create sample data */
data acctinfo;
format duedate date9.;
input duedate date9. intrate;
datalines;
10oct2000 1.10
10nov2010 1.12
;
/* Conditionally set values for STATUS, INTRATE, and NEWLOAN */
/* based on the value of DUEDATE */
data acctinfo;
set acctinfo;
if duedate ge today() then do;
status='On Time';
intrate=intrate*.99;
newloan='Solicit';
end;
if duedate lt today() then do;
status='Late';
intrate=intrate*1.02;
newloan='Deny';
end;
run;
proc print;
run;
Using the SCAN function
Suppose you want to produce an alphabetical list by last name, but your NAME variable contains
FIRST, possibly a middle initial, and LAST name. The SCAN function makes quick work of this. Note
that the LAST_NAME variable in PROC REPORT has the attribute of ORDER and NOPRINT, so that
the list is in alphabetical order of last name but all that shows up is the original NAME variable in First,
Middle, and Last name order.
DATA FIRST_LAST;
INPUT @1 NAME $20.
@21 PHONE $13.;
***Extract the last name from NAME;
LAST_NAME = SCAN(NAME,-1,' '); /* Scans from the right */
DATALINES;
Jeff W. Snoker (908)782-4382
Raymond Albert (732)235-4444
Steven J. Foster (201)567-9876
Jose Romerez (516)593-2377
;
PROC REPORT DATA=FIRST_LAST NOWD;
TITLE "Names and Phone Numbers in Alphabetical Order (by Last Name)";
COLUMNS NAME PHONE LAST_NAME;
DEFINE LAST_NAME / ORDER NOPRINT WIDTH=20;
DEFINE NAME / DISPLAY 'Name' LEFT WIDTH=20;
DEFINE PHONE / DISPLAY 'Phone Number' WIDTH=13 FORMAT=$13.;
RUN;
INDEX Function for String Search
INDEX, INDEXC, INDEXW functions searches a character expression for a string, specific character,
or word.
* Sample 1: INDEX */
data one;
input string $25.;
position=index(string,'cat'); /* Search for the word 'cat' */
letter=INDEX(string,'c'); /* Search for the letter 'c' */
datalines;
the cat came back
catastrophic
curious cat caterwauls
;
proc print data=one;
run;
* Sample 2: INDEXC */
data two;
input string $25.;
if indexc(string,'0123456789')> 0 then has_numbers=string;
else no_numbers=string;
datalines;
Box 101
Pine Street
;
proc print data=two;
run;
/* Sample 3: INDEXW */
data three;
input string $25.;
if indexw(string,'my') > 0 then contains_the_word_my='yes';
datalines;
my aunt amy
in the army
my oh my
;
proc print data=three;
run;
Using arrays and DO loop in Data Step
This program demonstrates how to compute averages of variable values with arrays and DO loop.
data tripinfo;
infile datalines truncover;
input custno trip1 trip2 trip3 trip4 trip5 trip6 trip7 trip8 trip9
trip10;
datalines;
123 200 225 432 300 100 550 80 325 600 270
124 2000 3000 2205 1400 1385 1240 1000
125 900 890 1000 1025 1200 1120 1000 800 750 300
126 3000 3000 3000 3000 3000
127 699 599
;
/* Put variables TRIP1-TRIP10 into an array and with a DO block, determine
*/
/* if a condition is met and then perform a subsequent action. Use a
DO */
/* loop to process variables in the
array. */
data average;
set tripinfo;
array trip (10) trip1-trip10;
do i=1 to 10;
if i le 5 then do;
if trip(i)=. then avg5=.;
end;
else avg5=mean(of trip1-trip5);
if trip(i)=. then avg10=.;
else avg10=mean(of trip1-trip10);
end;
keep custno avg5 avg10;
run;
proc print;
run;
Using _TEMPORARY_ arrays for Missing value Treatment
/* Create sample data */
data test;
input var1 var2 var3;
datalines;
10 20 30
100 . 300
. 40 400
;
/* The _TEMPORARY_ array values are used to populate the missing values*/
data new(drop=i);
set test;
array newval(3)_TEMPORARY_ (.1 .2 .3) ;
array now(3) var1 var2 var3;
do i=1 to 3;
if now(i)=. then now(i)=newval(i);
end;
run;
proc print;
run;
A Simple SAS Macro
This Macro shows a way to concatenate all datasets together without having to type in each one.
data x1;
x=1;
run;
data x2;
x=2;
run;
data x3;
x=3;
run;
options mprint;
%macro test;
data final;
set %do i = 1 %to 3;
x&i
%end;;
run;
%mend test;
%test
proc print; run;
BASIC PROC SQL Exercises
This code shows three ways in which SQL can create SAS datasets.
1) as an empty copy of some other table
2) as the results of any valid SQL select expression
3) from the traditional SQL DML statements
/* creates a base table for further use */
data paper;
input author$1-8 section$9-16 title$17-43 @45 time time5.
duration;
format time time5.;
label title='Paper Title';
cards;
Tom Testing Automated Product Testing 9:00 35
Jerry Testing Involving Users 9:50 30
Nick Testing Plan to test, test to plan 10:30 20
Peter Info SysArtificial Intelligence 9:30 45
Paul Info SysQuery Languages 10:30 40
Lewis Info SysQuery Optimisers 15:30 25
Jonas Users Starting a Local User Group 14:30 35
Jim Users Keeping power users happy 15:15 20
Janet Users Keeping everyone informed 15:45 30
Marti GraphicsMulti-dimensional graphics 16:30 35
Marge GraphicsMake your own point! 15:10 35
Mike GraphicsMaking do without color 15:50 15
Jane GraphicsPrimary colors, use em! 16:15 25
;
run;
/* This creates table P2, and empty copy of PAPER */
proc sql;
create table p2 like paper;quit;
* In one step, this creates a table, P3, that contains all
of the papers presented after 12:00. */;
proc sql;
create table p3 as select * from paper
where time > '12:00't;quit;
/* This creates a table, unlike any existing table. */
proc sql;
create table counts(
section char(20),
papers num);
quit;
proc contents data=p2;
title2 'Description of table P2';
run;
proc print data=p3;
title2 'Table P3';
run;
proc contents data=counts;
title2 'Description of table COUNTS';
run;
MERGING using PROC SQL
This example demonstrate another example of merging using PROC SQL where the "common"
variable has a different name in each table and the "common" variable has a different format and the
‘common’ variable has some prefix in some table and not in others.
data orders;
input cno $ pno $ qty;
cards;
C001 P001 10
C001 P002 20
C002 P003 30
C002 P002 20
C003 P003 50
;
data parts;
input no $ desc $ 4-20;
cards;
001 Part One
002 Part Two
003 Part Three
;
data cust;
input no $ name $ 4-20;
cards;
001 Cust One
002 Cust Two
003 Cust Three
;
proc sql;
select o.cno, c.name, o.pno, p.desc, o.qty
from orders o, parts p, cust c
where substr(cno, 2) = c.no
and substr(pno, 2) = p.no;
quit;
PROC FREQ- Options available
The examples below show various ways one can use the PROC FREQ procedure. Please read the
title of each step to understand what it does.
options ls=132;
data new;
input a b @@;
cards;
1 2 2 1 . 2 . . 1 1 2 1
;
proc freq;
title 'NO TABLES STATEMENT';
run;
proc freq;
tables a / missprint;
title '1-WAY FREQUENCY TABLE WITH MISSPRINT OPTION';
run;
proc freq;
tables a*b;
title '2-WAY CONTINGENCY TABLE';
run;
proc freq;
tables a*b / missprint;
title '2-WAY CONTINGENCY TABLE WITH MISSPRINT OPTION';
run;
proc freq;
tables a*b / missing;
title '2-WAY CONTINGENCY TABLE WITH MISSING OPTION';
run;
proc freq;
tables a*b / list;
title '2-WAY FREQUENCY TABLE';
run;
proc freq;
tables a*b / list missing;
title '2-WAY FREQUENCY TABLE WITH MISSING OPTION';
run;
proc freq;
tables a*b / list sparse;
title '2-WAY FREQUENCY TABLE WITH SPARSE OPTION';
run;
proc freq order=data;
tables a*b / list;
title '2-WAY FREQUENCY TABLE, ORDER=DATA';
run;
PROC MEANS
The examples below demonstrate the ways PROC MEANS used for basic statistics and variable
checking.
data gains; /*Example:1 */
input name $ team $ age ;
cards;
Alfred blue 6
Alicia red 5
Barbara . 5
Bennett red .
Carol blue 5
Carlos blue 6
;
run;
proc means nmiss n;
class team;
run;
data gains; /*Example:2 */
input name $ height weight;
cards;
Alfred 69.0 122.5
Alicia 56.5 84.0
Barbara 65.3 98.0
Bennett 63.2 96.2
Carol 62.8 102.5
Carlos 63.7 102.9
;
run;
proc means noprint;
class name;
output out=results;
run;
proc print data=results;
run;
data gains; /*Example : 3*/
input name $ sex $ height weight school $ time;
cards;
Alfred M 69.0 122.5 AJH 1
Alfred M 71.0 130.5 AJH 2
Alicia F 56.5 84.0 BJH 1
Alicia F 60.5 86.9 BJH 2
Philip M 69.0 115.0 AJH 1
Philip M 70.0 118.0 AJH 2
Robert M 64.8 128.0 BJH 1
Robert M 68.3 . BJH 2
Thomas M 57.5 85.0 AJH 1
Thomas M 59.1 92.3 AJH 2
Wakana F 61.3 99.0 AJH 1
Wakana F 63.8 102.9 AJH 2
William M 66.5 112.0 BJH 1
William M 68.3 118.2 BJH 2
;
proc means data=gains;
var height weight;
class sex;
output out=test
max=maxht maxwght
maxid(height(name) weight(name))=tallest heaviest;
run;
proc print data=test;
run;
proc means data=gains; /*Example 4:*/
title 'Statistics For All Numeric Variables';
run;
proc means data=gains maxdec=3 nmiss range
uss css t prt sumwgt skewness kurtosis;
var height weight;
title 'Requesting Assorted Statistics';
run;
PROC SUMMARY
A Number of PROC Summary examples are listed below. Rum them in SAS ans see how they are
different from each other.
DATA VIRUS;
INPUT DILUTION $ COMPOUND $ TIME @@;
IF DILUTION='A' THEN DL=1;
ELSE IF DILUTION='B' THEN DL=2;
ELSE IF DILUTION='C' THEN DL=4;
CARDS;
A PA 87 A PA 90
A PM 82 A PM 71
A UN 72 A UN 77
B PA 79 B PA 80
B PM 73 B PM 72
B UN 70 B UN 66
C PA 77 C PA 81
C PM 72 C PM 68
C UN 62 C UN 61
;
/* Use class variable COMPOUND to group data. */
PROC SUMMARY PRINT;
CLASS COMPOUND;
RUN;
PROC SUMMARY PRINT N MEAN STD STDERR SUM VAR MIN MAX CV CSS USS
RANGE NMISS;
VAR TIME DL;
CLASS COMPOUND;
RUN;
PROC SORT;
BY COMPOUND;
RUN;
/* Use by variable to group data, slightly */
/* different from class. */
PROC SUMMARY PRINT;
BY COMPOUND;
VAR TIME DL;
RUN;
PROC SUMMARY DATA=VIRUS;
VAR TIME;
CLASS COMPOUND;
OUTPUT OUT=OUTA MEAN=M STD=S N=COUNT;
RUN;
PROC PRINT;
RUN;
PROC SUMMARY DATA=VIRUS;
VAR TIME;
BY COMPOUND;
OUTPUT OUT=OUTA MEAN=M STD=S N=COUNT;
RUN;
PROC PRINT;
RUN;
Comparison of MEANS and SUMMARY Output
data relay;
input name $ sex $ back breast fly free;
cards;
Sue F 35.1 36.7 28.3 36.1
Karen F 34.6 32.6 26.9 26.2
Jan F 31.3 33.9 27.1 31.2
Andrea F 28.6 34.1 29.1 30.3
Carol F 32.9 32.2 26.6 24.0
Ellen F 27.8 32.5 27.8 27.0
Jim M 26.3 27.6 23.5 22.4
Mike M 29.0 24.0 27.9 25.4
Sam M 27.2 33.8 25.2 24.1
Clayton M 27.0 29.2 23.0 21.9
;run;
proc means data=relay noprint;
var back breast fly free;
class sex;
output out=newmeans min=;run;
proc print data=newmeans;
title 'Using PROC PRINT with PROC MEANS';
run;
proc summary data=relay print min;
var back breast fly free;
class sex;
output out=newsumm min=;
title 'Using PROC SUMMARY with the PRINT option';
run;
proc print data=newsumm;
title 'Using PROC PRINT with PROC SUMMARY';
run;
PROC GPLOT
A simple program to demonstrate the basic construct of GPLOT procedure.
/* Set the graphics environment */
goptions reset=all gunit=pct border cback=white
colors=(black blue green red)
ftext=swiss ftitle=swissb htitle=6 htext=4;
/* Create the data set STATS */
data stats;
input height weight;
datalines;
69.0 112.5
56.5 84.0
65.3 98.0
62.8 102.5
56.3 77.0
66.5 112.0
72.0 150.0
64.8 128.0
67.0 133.0
57.5 85.0
;
/* Define title */
title 'Study of Height vs Weight';
/* Generate scatter plot */
proc gplot data= stats;
plot height*weight;
run;
These Examples are mainly sourced from SAS Institute website. Please
visit: http://support.sas.com/ctx/samples/index.jsp
SAS Project 2: Clinical Trials....SAS Technical Problem to
solve....DIY
Another small SAS Screening Problem asked at Amgen Inc
For the data below…
Dose
Patient Dose Date
001 01Jan2003
001 02Jan2003
002 15Mar2003
002 01Mar2003
003 01Apr2003
004 19Mar2003
AE
Patient AE Start Date AE Text
001 31Dec2002 Headache
001 02Jan2003 Blurry Vision
001 02Jan2003 Anxiety
002 02Mar2003 Migraine
002 01Mar2003 Constipation
002 15Mar2004 Athlete’s Foot
003 02Apr2003 Depression
Patient AE Start Date AE Text
003 02Apr2003 Rash
Final
Patient Dose Date AE Start Date A
001 01Jan2003 02Jan2003 B
001 01Jan2003 02Jan2003 A
002 01Mar2003 01Mar2003 C
002 01Mar2003 02Mar2003 M
003 01Apr2003 02Apr2003 D
003 01Apr2003 02Apr2003 R
Questions
1. Using SAS procedures and data steps, combine the Dose and AE datasets together to get the
Final dataset. The Final dataset should include adverse events that occurred on a dosing date
or one day after a dosing date.
2. Do the same task without using a data step.
3. The data project should be based on a dataset which you select,
probably downloaded from some public web source, and which I
suggest
ought to have at least n=100 observations, a continuous response
variable
Y, and at least several other meaningful continuous or categorical
explanatory
X-columns. Ideally, since you will be looking for relationships between
the
X and Y columns, the source and subject matter of the data should
relate to
a topic about which you have some general knowledge to aid you in
asking and answering meaningful research questions relevant to the
data.
4. (II). The objective of your data project should be to discover and
present
the best fitting regression-type statistical model you can in SAS to
explain the Y
responses in your dataset in terms of the X explanatory variables. So at
the outset,
you should try to pose questions about the data relationships whose
answers
will be interpretable and expressible in clear language as well as a
formal model.
A successful project will relate the research questions to a regression-
type model,
use techniques developed in the Stat 430 course to build the best such
model you
can for the data and to examine the adequacy or goodness of fit of the
model, and
finally (maybe very briefly) explain what conclusions your model lead
to for the
data you studied.
5. (III). It is not required that your data analysis project be "finished"
in the
sense of necessarily reaching firm conclusions about a realistic problem,
but
you should make every effort to showcase tools learned in the course (of
all
kinds: histograms, QQplots, transformations, data-subsetting as
necessary,
residuals plots and prediction intervals, standardized residuals and
considera-
tion of outliers, ANOVA, and automatic model-selection techniques)
and
demonstrate that you have uncovered all the regression-model structure
of
the data that was possible with a reasonable amount of effort.
6. (IV). While it is permissible to violate the guidelines in (I)-(II)
somewhat,
I strongly urge you to discuss your project with me, before investing too
much
effort into it, if you know you want to deviate much from them. This is
mostly
in order that I can help you avoid certain kinds of data (time series
where
successive observations are definitely not independent, or survival data
where
many observations are "censored" in the sense of not being observed
until the
health outcome of main interest, or categorical response-data) where
the main
assumptions of our regression models are not tenable.
7. (V). The guideline for how much material to hand in is much like
the
"Homework Guideline" below. Do not hand in data or any
computations or
pictures you do not explicitly refer to in accompanying text. You must
explain
the data problem and model-building and solution in words, with
reference to
pictures and numerical exhibits. You should hand in the SAS code as an
Appendix,
or email it to me as a text-file: but in either case it should be edited
down to the
code that worked to do the analyses and exhibits you are handing in.

Sas practice programs

  • 1.
    List of SASprograms Reading data using simple list input. Reading data using column input Reading data using formatted input Reading data using named input Reading comma delimited data w ith modified list input Reading a TAB delimited file Reading multiple records to create one observation Use of PROC IMPORT to read a CSV, TAB or delimited file Reading a comma delimited file w ith a .csv extension Creating a delimited file using a PUT statement Creating an external file w ith column-aligned data Concatenating data sets Using SET A Simple MERGE Merging and creation of subsets based on Origin Convert missing values to zero and values of zero to missing Convert selected numeric values from zero to missing Create and apply user-defined formats Convert values from character to numeric Convert values from numeric to character Working w ith Dates in the SAS System Use of MDY function Convert a SAS date to a character variable Calculate number of years, months, and days betw een tw o dates Determine the w eek number of the year DO LOOP block Using the SCAN function INDEX Function for String Search Using arrays and DO loop in Data Step
  • 2.
    Using _TEMPORARY_ arraysfor Missing value Treatment A Simple SAS Macro BASIC PROC SQL Exercises MERGING using PROC SQL PROC FREQ- Options available PROC MEANS PROC SUMMARY Comparison of MEANS and SUMMARY Output PROC GPLOT Appendix-I Practice Programs Reading data using simple list input. This program reads in data separated by a blank space using simple list input style in the INPUT statement. If your data is delimited by another character other than a blank or space, the DLM= option and/or DSD option on the INFILE statement will need to be specified. data grades; infile datalines; input student $ test1-test4; datalines; A1237 3.8 3.7 3.2 3.9 A9361 2.9 3.0 3.6 3.5 B3051 4.0 3.8 3.9 4.0 ;
  • 3.
    proc print; run; Reading datausing column input Note: Column input requires the data to be standard numeric or character data data employee; input lastname $ 1-10 fname $ 12-21 ssn 23-31 status $ 33-38; datalines; Green Samual 888888888 Hourly Brennon Carol 123456789 Salary Wang Robert 999999999 Salary Randolph Virginia 987654321 Salary ; proc print; run; Reading data using formatted input This program reads in data using informats for a file with no delimiters. data acctinfo; input acctnum $8. date mmddyy10. amount comma9.; format date mmddyy10.; datalines; 0074309801/15/2001$1,003.59 1028754301/17/2001$672.05 3320899201/19/2001$702.77
  • 4.
    0345900601/19/2001$1,209.61 ; proc print; run; Reading datausing named input Read datalines or records that contain a variable name followed by an equal sign and the value. data deptinfo; input dept $ last= $ first= $ start= $10.; datalines; acct start=15-01-2000 first=Mary last=Lowe hr start=01-09-1984 first=Greg last=Richards oper start=01-11-1990 first=Cindy last=Lou oper start=15-05-1995 first=Julie last=Simpson acct start=01-03-1999 first=Sam last=Hampton ; proc print; run; Reading comma delimited data with modified list input Read in comma-delimited data by specifying the DSD option on the INFILE statement and using modified list-input style. data grades; infile datalines dsd; input student :$20. test1-test4 fee :dollar8.;
  • 5.
    datalines; "Alexander,Bertrum",3.8,,,3.9,$500 "Chang,Daniel",,3.0,3.6,3.5,$400 "Elano,Fen",4.0,3.8,3.9,4.0,$300 ; proc print; run; Reading aTAB delimited file Read an external file into a SAS data set when the variables in the external file are separated with a TAB character. Note: On ASCII systems (PC, UNIX, MAC, VMS) the hex representation of a TAB character is '09'x. On EBCDIC systems (VM, MVS, VSE) the hex representation of a TAB is '05'x. data _null_; file 'c:temptabdlm.txt'; put "Samuel B. Thompson" '09'x "04/28/1995" '09'x "Raleigh"; put "Suzy B. Thomspon" '09'x "5/1/1993" '09'x "Wake Forest"; run; data info; infile 'c:temptabdlm.txt' DSD dlm='09'x truncover; input name :$30. DOB :mmddyy8. city :$20.; run; proc print; format dob mmddyy8.; run; Reading multiple records to create one observation
  • 6.
    This program createsone SAS record by reading multiple records from the source dataset. /* Create sample data with variable length records. */ /* Each person's data spans multiple records. */ data test; infile datalines n=4 truncover; input #1 @1 name $15. #2 @1 address1 $22. #3 @1 address2 $30. #4 @1 phone_no $12.; datalines; Sonya Larson 10054 Plum Tree Rd Buffalo NY 10068 716-555-1348 Kip Holfser 902 West Blvd Lansing, MI 48910 517-555-0227 Chan Rong 3052 East Bank Way Savannah GA 30058 912-555-0025 Randy Nguyen 100 49th Street Harrisburg PA 19075 717-555-7773
  • 7.
    ; proc print; run; Use ofPROC IMPORT to read a CSV, TAB or delimited file This program reads an exclamation point (!) delimited file variable names on the first row. data _null_;/* Create test file to read using PROC IMPORT below. */ file 'c:temppipefile.txt'; put"x1!x2!x3!x4"; put "11!22!.! "; put "111!.!333!apple"; run; proc import datafile='c:temppipefile.txt' out=work.test dbms=dlm replace; /* note this is the first semi-colon */ delimiter='!'; getnames=yes; run; proc print; run; Reading a comma delimited file with a .csv extension Since the DBMS= value is CSV, you do not have to use the DELIMITER= statement. Also assuming the variable names are on the first row, the GETNAMES= statement is also not required.
  • 8.
    /* Create commadelimited test file to read using PROC IMPORT below. */ data _null_; file 'c:tempcsvfile.csv'; put"var1,var2,var3,var4"; put "apple,banana,coconut,date"; put "apricot,berry,crabapple,dewberry"; run; proc import datafile='c:tempcsvfile.csv' out=work.fruit dbms=csv replace; run; proc print; run; Creating a delimited file using a PUT statement filename xx 'd:test.txt'; data _null_; set sashelp.shoes (keep= Region Returns Sales obs=20); file xx dlm='~'; put Region Returns Sales; run; Open the file 'd:test.txt' to see the output.
  • 9.
    Creating an externalfile with column-aligned data With column style output, specify the starting and ending column numbers for the output data after the variable name. The sample below uses column style PUT for NAME and AGE. You can also use control pointers on a PUT statement to align data in columns. Below, an absolute control pointer ("@") specifies column 20 as the starting position for SEX. Relative control pointers ("+n") help align WEIGHT and HEIGHT. data _null_; set sashelp.class (obs=8); file log; put name 1-8 age 13-15 @20 sex +5 weight 5.1 +5 height; run; Concatenating data sets Using SET data one; input name $ age; datalines; Chris 36 Jane 21 Jerry 30 Joe 49 ; data two; input name $ age group; datalines; Daniel 33 1 Terry 40 2 Michael 60 3
  • 10.
    Tyrone 26 4 ; databoth; set one two; run; proc print data=both; A Simple MERGE /* Create sample data */ data one; input id $ fruit $; datalines; a apple a apple b banana c coconut ; data two; input id $ color $; datalines; a amber b brown c cream c cocoa
  • 11.
    c carmel ; data both; mergeone two; by id; run; proc print data=both; run; Merging and creation of subsets based on Origin This program demonstrates how to do Merging data sets by a common variable and create output data sets based upon observation origin. data one; input id $ name $ dept $ project $; datalines; 000 Miguel A12 Document 111 Fred B45 Survey 222 Diana B45 Document 888 Monique A12 Document
  • 12.
    999 Vien D03 Survey ; datatwo; input id $ name $ projhrs; datalines; 111 Fred 35 222 Diana 40 777 Steve 0 888 Monique 37 999 Vien 42 ; data both one_only two_only; merge one(in=in1) two(in=in2); by id; if in1 and in2 then output both; else if in1 then output one_only; else outputtwo_only; run;
  • 13.
    title 'Both'; proc printdata=both; run; title 'One only'; proc print data=one_only; run; title 'Two only'; proc print data=two_only; run; Convert missing values to zero and values of zero to missing This program converts missing values to zero and values of zero to missing for numeric variables. Method is to Use the ARRAY statement with the automatic _NUMERIC_ variable to process all the numeric variables from the input data set. Use the DIM function to set the upper bound of an iterative DO to the number of elements in the array. /* Example 1 - Convert all numeric missing values to zero. */ /* Create sample data */ data numbers; input var1 var2 var3; datalines; 7 1 4
  • 14.
    . 0 8 99 . 5 6 2 8 3 0 ; data nomiss(drop=i); set numbers; array testmiss(*) _numeric_; do i = 1 to dim(testmiss); if testmiss(i)=. then testmiss(i)=0; end; run; proc print; run; Convert selected numeric values from zero to missing Use the ARRAY statement to define the specific numeric variables to change from a value of zero to a missing value. Use the DIM function to set the upper bound of an iterative DO to the number of elements in the array. data deptnum; input dept qrt1 qrt2 qrt3 qrt4; datalines; 101 3 0 4 9 410 8 7 5 8 600 0 0 6 7 700 6 5 6 9 901 3 8 7 0 ;
  • 15.
    data nozero(drop=i); set deptnum; arraytestzero(*) qrt1-qrt4; do i = 1 to dim(testzero); if testzero(i)=0 then testzero(i)=.; end; run; proc print; run; Create and apply user-defined formats proc format; value codesc 1-50='low' 50-high='high'; run; data values; input prodnum custnum $ code; datalines; 64412 D0001568 49 64412 Z0056012 51 78001 C0000969 3 78001 F0032140 11 88204 B0000073 79 89569 R0022217 1 99301 H0009355 99 99301 C0000889 58
  • 16.
    ; data values; set values; codefmt=put(code,codesc.); run; procprint data=values; run; Convert values from character to numeric This program converts a character value to a numeric value by using the INPUT function. Specify a numeric informat that best describes how to read the data value into the numeric variable. data char; input string :$8. date :$6.; numeric=input(string,8.); sasdate=input(date,mmddyy6.); format sasdate mmddyy10.; datalines; 1234.56 031704 3920 123104 ; proc print; run;
  • 17.
    Convert values fromnumeric to character Converts a numeric value to a character value by using the PUT function. Specify a numeric format that describes how to write the numeric value to the character variable. To left align the resulting character value, specify -L after the format specification. data num; input num date: mmddyy6.; datalines; 123456 110204 1000 120504 ; data now_char; set num (rename=(num=oldnum date=olddate)); num=put(oldnum,6. -L); date=put(olddate,date9.); run; proc print; run; Working with Dates in the SAS System SAS System has various date formats a the programs below demonstrates various such formats in SAS data steps. data dates; input country $ 1-11 @13 depart date7. nights; cards; Japan 13may89 8
  • 18.
    Greece 17oct89 12 NewZealand 03feb90 16 Brazil 28feb90 8 Venezuela 10nov89 9 Italy 25apr89 8 USSR 03jun89 14 Switzerland 14jan90 9 Australia 24oct89 12 Ireland 27may89 7 ; proc print data=dates; title 'Departure Dates with SAS Date Values'; run; proc print data=dates; title 'Departure Dates in Calendar Form'; format depart mmddyy8.; run; data tourdate; set dates; format depart date7.; run; proc contents data=tourdate; run; proc print data=tourdate;
  • 19.
    title 'Report withDeparture Date Spelled Out'; format depart worddate18.; run; proc sort data=tourdate out=sortdate; by depart; run; proc print data=sortdate; var depart country nights; title 'Departure Dates Listed in Chronological Order'; run; data home; set tourdate; return=depart+nights; format return date7.; run; proc print data=home; title 'Dates of Departure and Return'; run; data corrdate; set tourdate; if country='Switzerland' then depart='21jan90'd; run; proc print data=corrdate; title 'Corrected Value for Switzerland'; run;
  • 20.
    data pay; set tourdate; duedate=depart-30; ifweekday(duedate)=1 then duedate=duedate-1; format duedate weekdate29.; run; proc print data=pay; var country duedate; title 'Date and Day of Week Payment Is Due'; run; data ads; set tourdate; now=today(); if now+90<=depart<=now+120; run; proc print data=ads; title 'Tours Departing between 90 and 120 Days from Today'; format now date7.; run; /* Calculating a duration in days */ data temp; start='08feb82'd; rightnow=today(); age=rightnow-start; format start rightnow date7.;
  • 21.
    run; proc print data=temp; title'Age of Tradewinds Travel'; run; /* Calculating a duration in years */ data temp2; start='08feb82'd; rightnow=today(); agedays=rightnow-start; ageyrs=agedays/365.25; format ageyrs 4.1 start rightnow date7.; run; proc print data=temp2; title 'Age in Years of Tradewinds Travel'; run; Use of MDY function /* Use month, day and year variables to create a SAS date*/ data one; input month day year; datalines; 1 1 99 02 02 2000 ; data two; set one; sasdate=mdy(month,day,year);
  • 22.
    format sasdate mmddyy10.; run; procprint; run; Convert a SAS date to a character variable data one; input sasdate :mmddyy6.; datalines; 010199 ; data two; set one; chardate=put(sasdate,mmddyy6.); run; proc print; run; Calculate number of years, months, and days between two dates data a; input @1 dob mmddyy10.; tod=today(); /* Get the current date from operating system */ /* Determine number of days in the month prior to current month */ bdays=day(intnx('month',tod,0)-1);
  • 23.
    /* Find differencein days, months, and years between */ /* start and end dates */ dd=day(tod)-day(dob); mm=month(tod)-month(dob); yy=year(tod)-year(dob); /* If the difference in days is a negative value, add the number */ /* of days in the previous month and reduce the number of months */ /* by 1. */ if dd < 0 then do; dd=bdays+dd; mm=mm-1; end; /* If the difference in months is a negative number add 12 */ /* to the month count and reduce year count by 1. */ if mm < 0 then do; mm=mm+12; yy=yy-1; end; format dob tod mmddyy10.; datalines; 01/01/1970 02/28/1992 01/01/2000 03/01/2000 05/10/1990 05/11/1990 05/12/1990
  • 24.
    ; proc print; run; Determine theweek number of the year data test; * Create sample data */; input date :mmddyy6.; format date date9.; datalines; 010104 010404 041804 081804 123104 ; data getweek; set test; /* Use INTNX to roll DATE back to the first of the year. */ /* Pass the result as the 'start' parameter to INTCK. */ week=intck('week',intnx('year',date,0),date)+1; run; proc print; run;
  • 25.
    DO LOOP block Thisprogram demonstrates how to conditionally adjust variable values with a DO block in a SAS data step /* Create sample data */ data acctinfo; format duedate date9.; input duedate date9. intrate; datalines; 10oct2000 1.10 10nov2010 1.12 ; /* Conditionally set values for STATUS, INTRATE, and NEWLOAN */ /* based on the value of DUEDATE */ data acctinfo; set acctinfo; if duedate ge today() then do; status='On Time'; intrate=intrate*.99; newloan='Solicit'; end; if duedate lt today() then do; status='Late';
  • 26.
    intrate=intrate*1.02; newloan='Deny'; end; run; proc print; run; Using theSCAN function Suppose you want to produce an alphabetical list by last name, but your NAME variable contains FIRST, possibly a middle initial, and LAST name. The SCAN function makes quick work of this. Note that the LAST_NAME variable in PROC REPORT has the attribute of ORDER and NOPRINT, so that the list is in alphabetical order of last name but all that shows up is the original NAME variable in First, Middle, and Last name order. DATA FIRST_LAST; INPUT @1 NAME $20. @21 PHONE $13.; ***Extract the last name from NAME; LAST_NAME = SCAN(NAME,-1,' '); /* Scans from the right */ DATALINES; Jeff W. Snoker (908)782-4382 Raymond Albert (732)235-4444 Steven J. Foster (201)567-9876 Jose Romerez (516)593-2377 ; PROC REPORT DATA=FIRST_LAST NOWD; TITLE "Names and Phone Numbers in Alphabetical Order (by Last Name)"; COLUMNS NAME PHONE LAST_NAME;
  • 27.
    DEFINE LAST_NAME /ORDER NOPRINT WIDTH=20; DEFINE NAME / DISPLAY 'Name' LEFT WIDTH=20; DEFINE PHONE / DISPLAY 'Phone Number' WIDTH=13 FORMAT=$13.; RUN; INDEX Function for String Search INDEX, INDEXC, INDEXW functions searches a character expression for a string, specific character, or word. * Sample 1: INDEX */ data one; input string $25.; position=index(string,'cat'); /* Search for the word 'cat' */ letter=INDEX(string,'c'); /* Search for the letter 'c' */ datalines; the cat came back catastrophic curious cat caterwauls ; proc print data=one; run; * Sample 2: INDEXC */ data two;
  • 28.
    input string $25.; ifindexc(string,'0123456789')> 0 then has_numbers=string; else no_numbers=string; datalines; Box 101 Pine Street ; proc print data=two; run; /* Sample 3: INDEXW */ data three; input string $25.; if indexw(string,'my') > 0 then contains_the_word_my='yes'; datalines; my aunt amy in the army my oh my ; proc print data=three; run; Using arrays and DO loop in Data Step This program demonstrates how to compute averages of variable values with arrays and DO loop. data tripinfo; infile datalines truncover;
  • 29.
    input custno trip1trip2 trip3 trip4 trip5 trip6 trip7 trip8 trip9 trip10; datalines; 123 200 225 432 300 100 550 80 325 600 270 124 2000 3000 2205 1400 1385 1240 1000 125 900 890 1000 1025 1200 1120 1000 800 750 300 126 3000 3000 3000 3000 3000 127 699 599 ; /* Put variables TRIP1-TRIP10 into an array and with a DO block, determine */ /* if a condition is met and then perform a subsequent action. Use a DO */ /* loop to process variables in the array. */ data average; set tripinfo; array trip (10) trip1-trip10; do i=1 to 10; if i le 5 then do; if trip(i)=. then avg5=.; end; else avg5=mean(of trip1-trip5); if trip(i)=. then avg10=.; else avg10=mean(of trip1-trip10); end; keep custno avg5 avg10; run;
  • 30.
    proc print; run; Using _TEMPORARY_arrays for Missing value Treatment /* Create sample data */ data test; input var1 var2 var3; datalines; 10 20 30 100 . 300 . 40 400 ; /* The _TEMPORARY_ array values are used to populate the missing values*/ data new(drop=i); set test; array newval(3)_TEMPORARY_ (.1 .2 .3) ; array now(3) var1 var2 var3; do i=1 to 3; if now(i)=. then now(i)=newval(i); end; run;
  • 31.
    proc print; run; A SimpleSAS Macro This Macro shows a way to concatenate all datasets together without having to type in each one. data x1; x=1; run; data x2; x=2; run; data x3; x=3; run; options mprint; %macro test; data final; set %do i = 1 %to 3; x&i %end;; run; %mend test; %test
  • 32.
    proc print; run; BASICPROC SQL Exercises This code shows three ways in which SQL can create SAS datasets. 1) as an empty copy of some other table 2) as the results of any valid SQL select expression 3) from the traditional SQL DML statements /* creates a base table for further use */ data paper; input author$1-8 section$9-16 title$17-43 @45 time time5. duration; format time time5.; label title='Paper Title'; cards; Tom Testing Automated Product Testing 9:00 35 Jerry Testing Involving Users 9:50 30 Nick Testing Plan to test, test to plan 10:30 20 Peter Info SysArtificial Intelligence 9:30 45 Paul Info SysQuery Languages 10:30 40 Lewis Info SysQuery Optimisers 15:30 25 Jonas Users Starting a Local User Group 14:30 35 Jim Users Keeping power users happy 15:15 20 Janet Users Keeping everyone informed 15:45 30 Marti GraphicsMulti-dimensional graphics 16:30 35 Marge GraphicsMake your own point! 15:10 35 Mike GraphicsMaking do without color 15:50 15
  • 33.
    Jane GraphicsPrimary colors,use em! 16:15 25 ; run; /* This creates table P2, and empty copy of PAPER */ proc sql; create table p2 like paper;quit; * In one step, this creates a table, P3, that contains all of the papers presented after 12:00. */; proc sql; create table p3 as select * from paper where time > '12:00't;quit; /* This creates a table, unlike any existing table. */ proc sql; create table counts( section char(20), papers num); quit; proc contents data=p2; title2 'Description of table P2'; run; proc print data=p3;
  • 34.
    title2 'Table P3'; run; proccontents data=counts; title2 'Description of table COUNTS'; run; MERGING using PROC SQL This example demonstrate another example of merging using PROC SQL where the "common" variable has a different name in each table and the "common" variable has a different format and the ‘common’ variable has some prefix in some table and not in others. data orders; input cno $ pno $ qty; cards; C001 P001 10 C001 P002 20 C002 P003 30 C002 P002 20 C003 P003 50 ; data parts; input no $ desc $ 4-20; cards; 001 Part One 002 Part Two 003 Part Three ;
  • 35.
    data cust; input no$ name $ 4-20; cards; 001 Cust One 002 Cust Two 003 Cust Three ; proc sql; select o.cno, c.name, o.pno, p.desc, o.qty from orders o, parts p, cust c where substr(cno, 2) = c.no and substr(pno, 2) = p.no; quit; PROC FREQ- Options available The examples below show various ways one can use the PROC FREQ procedure. Please read the title of each step to understand what it does. options ls=132; data new; input a b @@; cards;
  • 36.
    1 2 21 . 2 . . 1 1 2 1 ; proc freq; title 'NO TABLES STATEMENT'; run; proc freq; tables a / missprint; title '1-WAY FREQUENCY TABLE WITH MISSPRINT OPTION'; run; proc freq; tables a*b; title '2-WAY CONTINGENCY TABLE'; run; proc freq; tables a*b / missprint; title '2-WAY CONTINGENCY TABLE WITH MISSPRINT OPTION'; run; proc freq; tables a*b / missing; title '2-WAY CONTINGENCY TABLE WITH MISSING OPTION'; run; proc freq; tables a*b / list;
  • 37.
    title '2-WAY FREQUENCYTABLE'; run; proc freq; tables a*b / list missing; title '2-WAY FREQUENCY TABLE WITH MISSING OPTION'; run; proc freq; tables a*b / list sparse; title '2-WAY FREQUENCY TABLE WITH SPARSE OPTION'; run; proc freq order=data; tables a*b / list; title '2-WAY FREQUENCY TABLE, ORDER=DATA'; run; PROC MEANS The examples below demonstrate the ways PROC MEANS used for basic statistics and variable checking. data gains; /*Example:1 */ input name $ team $ age ; cards; Alfred blue 6 Alicia red 5 Barbara . 5
  • 38.
    Bennett red . Carolblue 5 Carlos blue 6 ; run; proc means nmiss n; class team; run; data gains; /*Example:2 */ input name $ height weight; cards; Alfred 69.0 122.5 Alicia 56.5 84.0 Barbara 65.3 98.0 Bennett 63.2 96.2 Carol 62.8 102.5 Carlos 63.7 102.9 ; run; proc means noprint; class name; output out=results; run; proc print data=results; run;
  • 39.
    data gains; /*Example: 3*/ input name $ sex $ height weight school $ time; cards; Alfred M 69.0 122.5 AJH 1 Alfred M 71.0 130.5 AJH 2 Alicia F 56.5 84.0 BJH 1 Alicia F 60.5 86.9 BJH 2 Philip M 69.0 115.0 AJH 1 Philip M 70.0 118.0 AJH 2 Robert M 64.8 128.0 BJH 1 Robert M 68.3 . BJH 2 Thomas M 57.5 85.0 AJH 1 Thomas M 59.1 92.3 AJH 2 Wakana F 61.3 99.0 AJH 1 Wakana F 63.8 102.9 AJH 2 William M 66.5 112.0 BJH 1 William M 68.3 118.2 BJH 2 ; proc means data=gains; var height weight; class sex; output out=test max=maxht maxwght maxid(height(name) weight(name))=tallest heaviest; run; proc print data=test; run;
  • 40.
    proc means data=gains;/*Example 4:*/ title 'Statistics For All Numeric Variables'; run; proc means data=gains maxdec=3 nmiss range uss css t prt sumwgt skewness kurtosis; var height weight; title 'Requesting Assorted Statistics'; run; PROC SUMMARY A Number of PROC Summary examples are listed below. Rum them in SAS ans see how they are different from each other. DATA VIRUS; INPUT DILUTION $ COMPOUND $ TIME @@; IF DILUTION='A' THEN DL=1; ELSE IF DILUTION='B' THEN DL=2; ELSE IF DILUTION='C' THEN DL=4; CARDS; A PA 87 A PA 90 A PM 82 A PM 71 A UN 72 A UN 77 B PA 79 B PA 80 B PM 73 B PM 72 B UN 70 B UN 66 C PA 77 C PA 81 C PM 72 C PM 68 C UN 62 C UN 61
  • 41.
    ; /* Use classvariable COMPOUND to group data. */ PROC SUMMARY PRINT; CLASS COMPOUND; RUN; PROC SUMMARY PRINT N MEAN STD STDERR SUM VAR MIN MAX CV CSS USS RANGE NMISS; VAR TIME DL; CLASS COMPOUND; RUN; PROC SORT; BY COMPOUND; RUN; /* Use by variable to group data, slightly */ /* different from class. */ PROC SUMMARY PRINT; BY COMPOUND; VAR TIME DL; RUN; PROC SUMMARY DATA=VIRUS; VAR TIME; CLASS COMPOUND; OUTPUT OUT=OUTA MEAN=M STD=S N=COUNT; RUN;
  • 42.
    PROC PRINT; RUN; PROC SUMMARYDATA=VIRUS; VAR TIME; BY COMPOUND; OUTPUT OUT=OUTA MEAN=M STD=S N=COUNT; RUN; PROC PRINT; RUN; Comparison of MEANS and SUMMARY Output data relay; input name $ sex $ back breast fly free; cards; Sue F 35.1 36.7 28.3 36.1 Karen F 34.6 32.6 26.9 26.2 Jan F 31.3 33.9 27.1 31.2 Andrea F 28.6 34.1 29.1 30.3 Carol F 32.9 32.2 26.6 24.0 Ellen F 27.8 32.5 27.8 27.0 Jim M 26.3 27.6 23.5 22.4 Mike M 29.0 24.0 27.9 25.4 Sam M 27.2 33.8 25.2 24.1 Clayton M 27.0 29.2 23.0 21.9 ;run;
  • 43.
    proc means data=relaynoprint; var back breast fly free; class sex; output out=newmeans min=;run; proc print data=newmeans; title 'Using PROC PRINT with PROC MEANS'; run; proc summary data=relay print min; var back breast fly free; class sex; output out=newsumm min=; title 'Using PROC SUMMARY with the PRINT option'; run; proc print data=newsumm; title 'Using PROC PRINT with PROC SUMMARY'; run; PROC GPLOT A simple program to demonstrate the basic construct of GPLOT procedure. /* Set the graphics environment */ goptions reset=all gunit=pct border cback=white colors=(black blue green red) ftext=swiss ftitle=swissb htitle=6 htext=4; /* Create the data set STATS */
  • 44.
    data stats; input heightweight; datalines; 69.0 112.5 56.5 84.0 65.3 98.0 62.8 102.5 56.3 77.0 66.5 112.0 72.0 150.0 64.8 128.0 67.0 133.0 57.5 85.0 ; /* Define title */ title 'Study of Height vs Weight'; /* Generate scatter plot */ proc gplot data= stats; plot height*weight; run; These Examples are mainly sourced from SAS Institute website. Please visit: http://support.sas.com/ctx/samples/index.jsp
  • 45.
    SAS Project 2:Clinical Trials....SAS Technical Problem to solve....DIY Another small SAS Screening Problem asked at Amgen Inc For the data below… Dose Patient Dose Date 001 01Jan2003 001 02Jan2003 002 15Mar2003 002 01Mar2003 003 01Apr2003 004 19Mar2003 AE Patient AE Start Date AE Text 001 31Dec2002 Headache 001 02Jan2003 Blurry Vision 001 02Jan2003 Anxiety 002 02Mar2003 Migraine 002 01Mar2003 Constipation 002 15Mar2004 Athlete’s Foot 003 02Apr2003 Depression
  • 46.
    Patient AE StartDate AE Text 003 02Apr2003 Rash Final Patient Dose Date AE Start Date A 001 01Jan2003 02Jan2003 B 001 01Jan2003 02Jan2003 A 002 01Mar2003 01Mar2003 C 002 01Mar2003 02Mar2003 M 003 01Apr2003 02Apr2003 D 003 01Apr2003 02Apr2003 R Questions 1. Using SAS procedures and data steps, combine the Dose and AE datasets together to get the Final dataset. The Final dataset should include adverse events that occurred on a dosing date or one day after a dosing date. 2. Do the same task without using a data step. 3. The data project should be based on a dataset which you select, probably downloaded from some public web source, and which I suggest ought to have at least n=100 observations, a continuous response variable Y, and at least several other meaningful continuous or categorical explanatory X-columns. Ideally, since you will be looking for relationships between the X and Y columns, the source and subject matter of the data should relate to a topic about which you have some general knowledge to aid you in asking and answering meaningful research questions relevant to the data. 4. (II). The objective of your data project should be to discover and present the best fitting regression-type statistical model you can in SAS to
  • 47.
    explain the Y responsesin your dataset in terms of the X explanatory variables. So at the outset, you should try to pose questions about the data relationships whose answers will be interpretable and expressible in clear language as well as a formal model. A successful project will relate the research questions to a regression- type model, use techniques developed in the Stat 430 course to build the best such model you can for the data and to examine the adequacy or goodness of fit of the model, and finally (maybe very briefly) explain what conclusions your model lead to for the data you studied. 5. (III). It is not required that your data analysis project be "finished" in the sense of necessarily reaching firm conclusions about a realistic problem, but you should make every effort to showcase tools learned in the course (of all kinds: histograms, QQplots, transformations, data-subsetting as necessary, residuals plots and prediction intervals, standardized residuals and considera- tion of outliers, ANOVA, and automatic model-selection techniques) and demonstrate that you have uncovered all the regression-model structure of the data that was possible with a reasonable amount of effort. 6. (IV). While it is permissible to violate the guidelines in (I)-(II) somewhat, I strongly urge you to discuss your project with me, before investing too much effort into it, if you know you want to deviate much from them. This is mostly in order that I can help you avoid certain kinds of data (time series where successive observations are definitely not independent, or survival data where many observations are "censored" in the sense of not being observed until the health outcome of main interest, or categorical response-data) where
  • 48.
    the main assumptions ofour regression models are not tenable. 7. (V). The guideline for how much material to hand in is much like the "Homework Guideline" below. Do not hand in data or any computations or pictures you do not explicitly refer to in accompanying text. You must explain the data problem and model-building and solution in words, with reference to pictures and numerical exhibits. You should hand in the SAS code as an Appendix, or email it to me as a text-file: but in either case it should be edited down to the code that worked to do the analyses and exhibits you are handing in.