This document summarizes a study that used radar imagery from the European Remote Sensing satellites ERS-1 and ERS-2 to map burnt forest areas in South Kalimantan, Indonesia following extensive fires in 1997. The researchers analyzed coherence images from 1996 and 1997 to identify areas that showed increased coherence after the fires, indicating vegetation clearing. They identified 552,000 hectares of burnt scars out of the 3.6 million hectare study area. Comparison to a multispectral SPOT image from September 1997 validated the radar analysis in delineating burnt areas. The study demonstrated the capability of radar interferometry to map fire-affected areas through changes in vegetation, providing an alternative to optical imagery during times of smoke and
![GEOPHYSICAL RESEARCH LETTERS, VOL. 26, NO. 16, PAGES 2409-2412, AUGUST 15, 1999
Copyright 1999 by American Geophysical Union. Paper number 1999GL900189. 0094-8276/99/1999GL900189$05.00
Delineating Land/Forest Fire Burnt Scars with ERS
Interferometric Synthetic Aperture Radar
S. C. Liew, L. K. Kwoh, K. Padmanabhan, O. K. Lim and H. Lim
Centre for Remote Imaging, Sensing and Processing, National University of Singapore, Republic of Singapore
Abstract. Cloud-penetrating C-band synthetic aperture radar
imagery acquired during two ERS-1/2 tandem missions (April
1996 and October 1997) was used in mapping burnt areas in
South Kalimantan, Indonesia, during the 1997 Southeast Asia
forest fire episode. Vegetated areas were classified by their
low interferometric coherence in both the 1996 and 1997
imagery while the burnt areas were delineated by their
increased coherence in 1997. A total of 552 kha of land was
found to be burnt scars out of the 3.6 Mha area surveyed. The
results were validated using a multispectral SPOT image of
the area acquired in September 1997.
Introduction
In 1997, during the dry season from July to November,
fires raged out of control in the tropical forest of Sumatra and
Kalimantan, Indonesia. In addition to transboundary pollution
in the form of smoke haze, the effects of forest fires on the
environment include the loss of biodiversity, loss of forests as
carbon sinks and emission of greenhouse gases with potential
contribution to global warming [Levine, 1991, 1996; Zepp,
1994].
In order to assess the impacts of the fires to the
environment, it is important to acquire information such as the
location of fires, spatial extent of burnt areas, types of land
cover on fire and geographical distribution of fires. Satellite
remote sensing is able to provide some of the essential
information [Malingreau, 1990]. Remote sensing studies of
fires are usually carried out using optical/Infrared sensors
[Kaufman et al., 1990] such as the NOAA-AVHRR
[Robinson, 1991; Matson, 1987], LANDSAT-TM [Pereira
and Setzer, 1993] and SPOT-HRV [Liew et al., 1998]. The
AVHRR sensors on board the NOAA Polar Orbiting Satellites
are able to detect the presence of fire hot spots using channel
3 (3.8 µm) and provide images showing the spatial
distribution and temporal evolution of fire hot spots
[Robinson, 1991; Matson, 1987]. The channels 1 and 2 of the
same sensors also provide information about the aerosols
characteristics and distribution of the smoke haze [Ferrare et
al., 1990]. However, due to the coarse resolution (1.1 km) of
the AVHRR sensors, the exact locations of fires and the types
of land cover on fire cannot be determined. Measurement
from hot spot images generally overestimates the area burnt
but underestimates the total fire count [Malingreau, 1990;
Kaufman et al., 1990]. Burnt areas can be mapped with high-
resolution optical sensors such as the LANDSAT-TM (30 m)
and SPOT-HRV (20 m), using the spectral characteristics of
the fire scars. Individual smoke plumes can be observed in the
images and hence the precise locations of the active fire areas
can be determined using the high-resolution images. The
types of land cover on fire can also be determined from the
spectral and contextual features of the fire areas. One major
limitation of optical/infrared remote sensing imagery lies in
the inability of optical/infrared radiation in penetrating clouds
and thick haze.
In this paper, we report on the use of the cloud-penetrating
C-band SAR on-board the ERS-1 and ERS-2 satellites in
mapping burnt areas during the 1997 Southeast Asia forest
fire episode. SAR backscatter intensity and interferometric
coherence have been used in forest mapping and monitoring
[LeToan et al., 1996; Wegmuller and Werner, 1995; Stussi et
al., 1997]. In particular, tropical forests are known to have a
constant backscattering coefficient (σo
) between -7 and -6 dB
in C-band. The interferometric coherence of the vegetated
area is typically low compared with the clearcuts or sparsely
vegetated area. If multitemporal SAR data of an area of
interest are acquired, clearings of forests/vegetation can be
detected by an observed change in σo
and/or an increase in
coherence of the area. Unlike optical/infrared sensors, SAR is
unable to detect hot spots or smoke plumes directly associated
with fires. It is thus not able to tell whether the clearings are
due to fires or other means. However, if fires have been
known to occur in an area of interest, the extent of fire
affected areas can be mapped using SAR backscattered
intensity and interferometric coherence signatures.
Methods
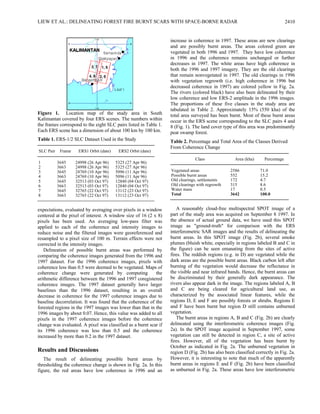
The location map of the study area covering four ERS
frames is shown in Fig. 1 and the dataset used in the study is
shown in Table 1. The study area is located in South
Kalimantan, near the town of Banjarmasin. This area is
known to be severely affected by fires from observations
using NOAA-AVHRR and SPOT imagery. The ERS data
were acquired during two tandem missions in April 1996 and
October 1997 and processed to the level of Single-Look
Complex (SLC). Altogether 8 pairs of tandem-SLC data were
used. Each pair of the SLC images were first co-registered
and the coherence (γ1,2) and intensity (I1, I2) images were
generated by,
γ1 2
1 2
1 1 2 2
, =
∗
∗ ∗
s s
s s s s
(1)
I s s kk k k= =
∗
( , )1 2 (2)
where s1, s2 are the complex pixel values of the two
coregistered SLC images and the brackets denote statistical](https://image.slidesharecdn.com/ec767e19-b2b6-49c8-a250-99097330dd60-160208140021/85/GRL99-1-320.jpg)
![GEOPHYSICAL RESEARCH LETTERS, VOL. 26, NO. 16, PAGES 2409-2412, AUGUST 15, 1999
Copyright 1999 by American Geophysical Union. Paper number 1999GL900189. 0094-8276/99/1999GL900189$05.00
Delineating Land/Forest Fire Burnt Scars with ERS
Interferometric Synthetic Aperture Radar
S. C. Liew, L. K. Kwoh, K. Padmanabhan, O. K. Lim and H. Lim
Centre for Remote Imaging, Sensing and Processing, National University of Singapore, Republic of Singapore
Abstract. Cloud-penetrating C-band synthetic aperture radar
imagery acquired during two ERS-1/2 tandem missions (April
1996 and October 1997) was used in mapping burnt areas in
South Kalimantan, Indonesia, during the 1997 Southeast Asia
forest fire episode. Vegetated areas were classified by their
low interferometric coherence in both the 1996 and 1997
imagery while the burnt areas were delineated by their
increased coherence in 1997. A total of 552 kha of land was
found to be burnt scars out of the 3.6 Mha area surveyed. The
results were validated using a multispectral SPOT image of
the area acquired in September 1997.
Introduction
In 1997, during the dry season from July to November,
fires raged out of control in the tropical forest of Sumatra and
Kalimantan, Indonesia. In addition to transboundary pollution
in the form of smoke haze, the effects of forest fires on the
environment include the loss of biodiversity, loss of forests as
carbon sinks and emission of greenhouse gases with potential
contribution to global warming [Levine, 1991, 1996; Zepp,
1994].
In order to assess the impacts of the fires to the
environment, it is important to acquire information such as the
location of fires, spatial extent of burnt areas, types of land
cover on fire and geographical distribution of fires. Satellite
remote sensing is able to provide some of the essential
information [Malingreau, 1990]. Remote sensing studies of
fires are usually carried out using optical/Infrared sensors
[Kaufman et al., 1990] such as the NOAA-AVHRR
[Robinson, 1991; Matson, 1987], LANDSAT-TM [Pereira
and Setzer, 1993] and SPOT-HRV [Liew et al., 1998]. The
AVHRR sensors on board the NOAA Polar Orbiting Satellites
are able to detect the presence of fire hot spots using channel
3 (3.8 µm) and provide images showing the spatial
distribution and temporal evolution of fire hot spots
[Robinson, 1991; Matson, 1987]. The channels 1 and 2 of the
same sensors also provide information about the aerosols
characteristics and distribution of the smoke haze [Ferrare et
al., 1990]. However, due to the coarse resolution (1.1 km) of
the AVHRR sensors, the exact locations of fires and the types
of land cover on fire cannot be determined. Measurement
from hot spot images generally overestimates the area burnt
but underestimates the total fire count [Malingreau, 1990;
Kaufman et al., 1990]. Burnt areas can be mapped with high-
resolution optical sensors such as the LANDSAT-TM (30 m)
and SPOT-HRV (20 m), using the spectral characteristics of
the fire scars. Individual smoke plumes can be observed in the
images and hence the precise locations of the active fire areas
can be determined using the high-resolution images. The
types of land cover on fire can also be determined from the
spectral and contextual features of the fire areas. One major
limitation of optical/infrared remote sensing imagery lies in
the inability of optical/infrared radiation in penetrating clouds
and thick haze.
In this paper, we report on the use of the cloud-penetrating
C-band SAR on-board the ERS-1 and ERS-2 satellites in
mapping burnt areas during the 1997 Southeast Asia forest
fire episode. SAR backscatter intensity and interferometric
coherence have been used in forest mapping and monitoring
[LeToan et al., 1996; Wegmuller and Werner, 1995; Stussi et
al., 1997]. In particular, tropical forests are known to have a
constant backscattering coefficient (σo
) between -7 and -6 dB
in C-band. The interferometric coherence of the vegetated
area is typically low compared with the clearcuts or sparsely
vegetated area. If multitemporal SAR data of an area of
interest are acquired, clearings of forests/vegetation can be
detected by an observed change in σo
and/or an increase in
coherence of the area. Unlike optical/infrared sensors, SAR is
unable to detect hot spots or smoke plumes directly associated
with fires. It is thus not able to tell whether the clearings are
due to fires or other means. However, if fires have been
known to occur in an area of interest, the extent of fire
affected areas can be mapped using SAR backscattered
intensity and interferometric coherence signatures.
Methods
The location map of the study area covering four ERS
frames is shown in Fig. 1 and the dataset used in the study is
shown in Table 1. The study area is located in South
Kalimantan, near the town of Banjarmasin. This area is
known to be severely affected by fires from observations
using NOAA-AVHRR and SPOT imagery. The ERS data
were acquired during two tandem missions in April 1996 and
October 1997 and processed to the level of Single-Look
Complex (SLC). Altogether 8 pairs of tandem-SLC data were
used. Each pair of the SLC images were first co-registered
and the coherence (γ1,2) and intensity (I1, I2) images were
generated by,
γ1 2
1 2
1 1 2 2
, =
∗
∗ ∗
s s
s s s s
(1)
I s s kk k k= =
∗
( , )1 2 (2)
where s1, s2 are the complex pixel values of the two
coregistered SLC images and the brackets denote statistical](https://image.slidesharecdn.com/ec767e19-b2b6-49c8-a250-99097330dd60-160208140021/75/GRL99-1-2048.jpg)