Download as PDF, PPTX


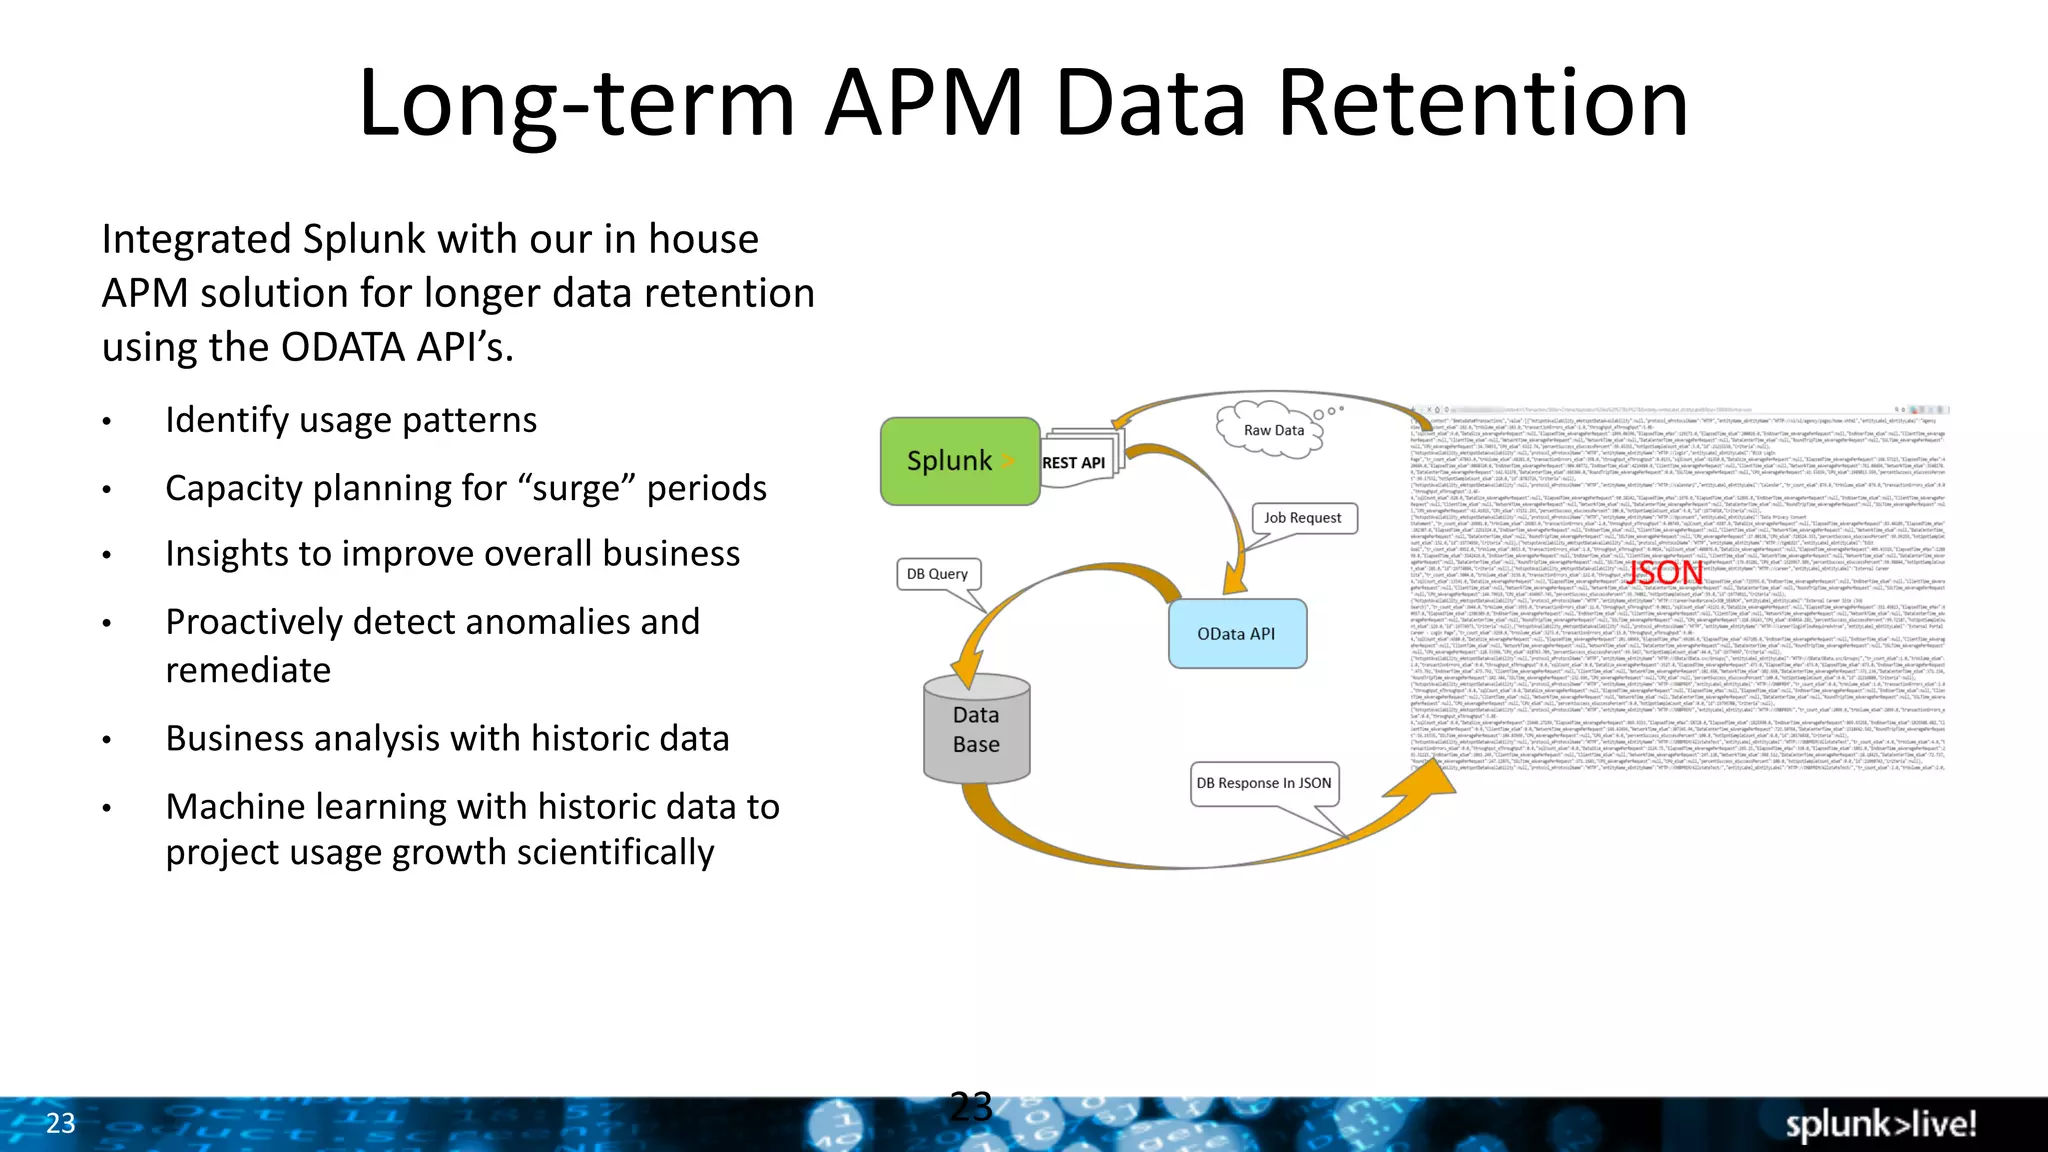


This document discusses SAP SuccessFactors' use of Splunk for log management and IT service monitoring. It provides context about SAP SuccessFactors and the speaker's team, describes challenges they previously faced with manual and siloed tools, and how adopting Splunk improved visibility, troubleshooting and availability. It outlines a proof of concept for an IT Service Intelligence dashboard in Splunk to monitor key performance indicators, detect anomalies, and improve mean time to resolution. Examples of personalized visualizations and potential future projects like long-term data retention and log verbosity analysis are also mentioned.


![Vibe Coding vs. Spec-Driven Development [Free Meetup]](https://cdn.slidesharecdn.com/ss_thumbnails/vibecodingvsspecdrivendevelopment-251209105622-43f455e7-thumbnail.jpg?width=640&height=640&fit=bounds)


