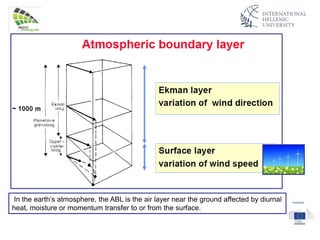
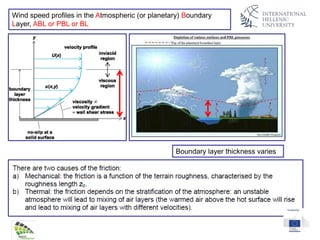
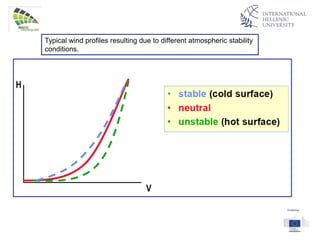
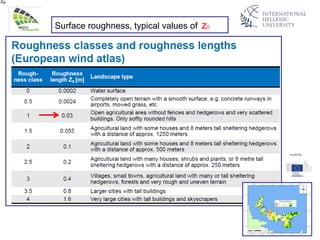
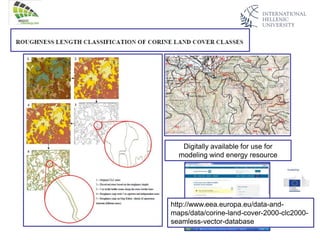
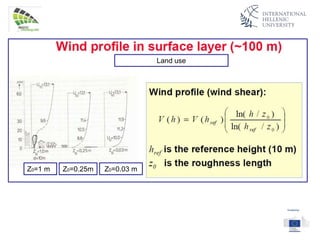
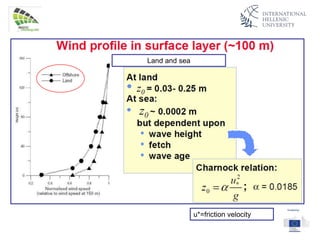
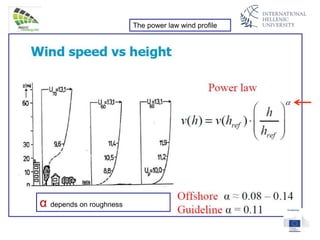
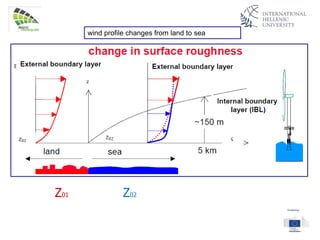
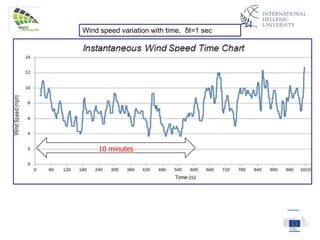
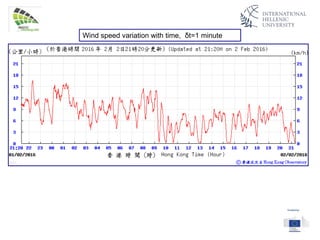
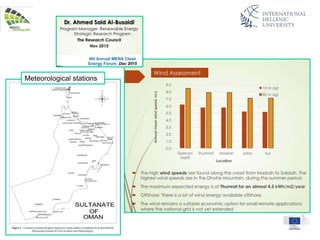
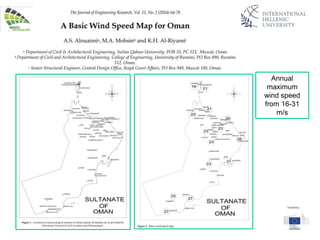
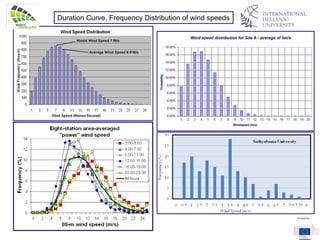
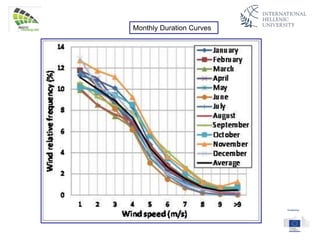
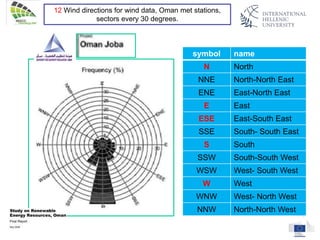
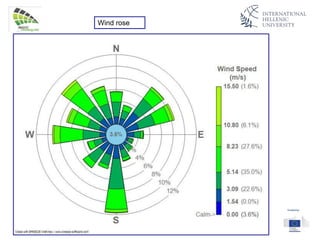
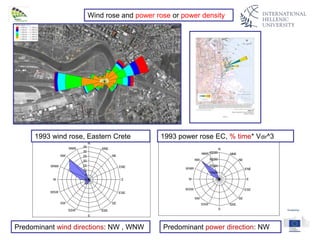
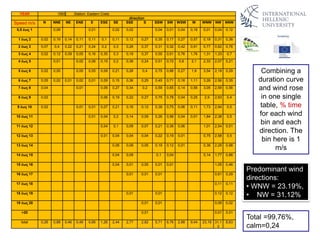
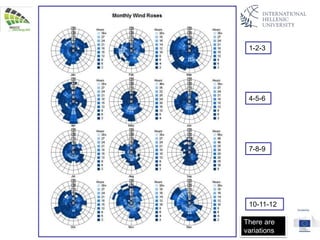
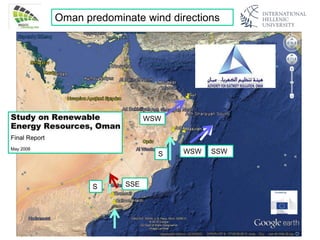
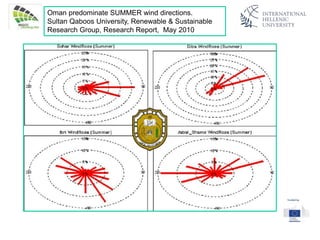
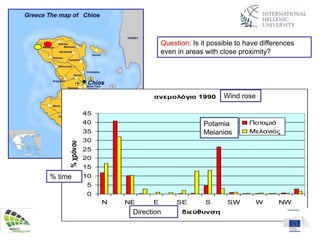
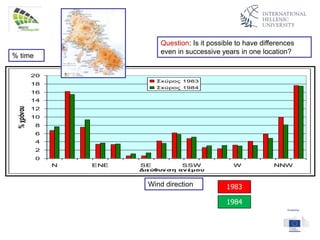
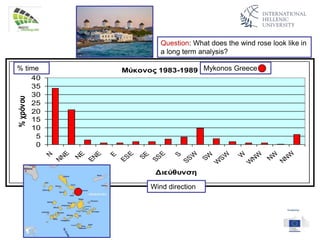
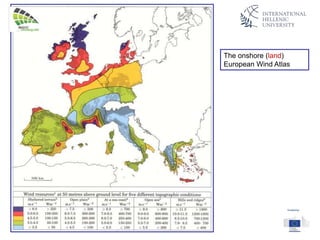
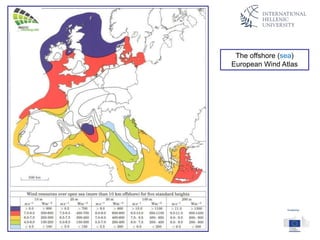
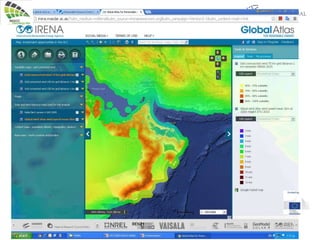
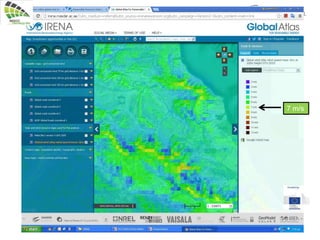
11
Welcome to the world of wind energy
Wind Speed
Wind Direction
Dr. D. V. Kanellopoulos
OPWP Renewable Energy
Training Program
11-14 December 2016
Muscat, Oman
In the earth’s atmosphere, the ABL is the air layer near the ground affected by diurnal
heat, moisture or momentum transfer to or from the surface.
Wind speed profiles in the Atmospheric (or planetary) Boundary
Layer, ABL or PBL or BL
Boundary layer thickness varies
Typical wind profiles resulting due to different atmospheric stability
conditions.
Surface roughness, or roughness length, Z0 or z0
Is a parameter of some vertical wind profile equations that model the horizontal mean
wind speed near the ground. In the log profile, it is equivalent to the height at which the
wind speed theoretically becomes zero.
In reality the wind at this height no longer follows a mathematical logarithm. It is so named
because it is typically related to the height of terrain roughness elements.
Whilst it is not a physical length, it can be considered as a length-scale a representation
of the roughness of the surface.
As an approximation, the roughness length is approximately one-tenth of the height of the
surface roughness elements.
For example, short grass of height 0.01m has a roughness length of approximately
0.001m.
Surfaces are rougher if they have more protrusions.
Forests have much larger roughness lengths than tundra, for example.
Roughness length is an important concept in urban meteorology as the building of tall
structures, such as skyscrapers, has an effect on roughness length and wind patterns.
When estimating the AEP of a wind farm, it has to be taken as accurate as possible.
Surface roughness, typical values of z0
Portugal,
experimental
verification locations
Digitally available for use for
modeling wind energy resource
http://www.eea.europa.eu/data-and-
maps/data/corine-land-cover-2000-clc2000-
seamless-vector-database
Land use
Z0=1 m Z0=0.25m Z0=0.03 m
Land and sea
u*=friction velocity
The power law wind profile
α depends on roughness
wind profile changes from land to sea
Z01 Z02
Wind profiles compared to IEC standard
Wind speed variation with time, δt=1 sec
10 minutes
Wind speed variation with time, δt=1 minute
Wind speed variation with time, δt= 1 hour
Notice the diurnal wind speed pattern
Daily
average
wind
speeds at
11 met
stations in
India for the
same year
Annual average wind speed in km/h at Canberra
Airport from 1943 to 2002. Note: the long-term (1961-
90) average is indicated by the horizontal line through
the centre of the graph
Analysis and presentation of wind data.
Southeast China - yearly mean wind speeds
How good is a site based upon
the average annual
wind speed?
Quality of
site
Wind
speed at
10 m AGL
poor < 4 m/s
Poor-fair 4-5
fair 5-6
good 6-7
Very good 7-8
excellent > 8
Make sure you compare speeds measured for the same height above ground or sea when
comparing sites. Otherwise vertical extrapolations will be necessary.
Study 11.2014
V(m/s) at 10 m AGL
28 meteorological
stations
Meteorological stations
Annual
maximum
wind speed
from 16-31
m/s
Duration Curve, Frequency Distribution of wind speeds
Monthly Duration Curves
Wind speed, m/s
% time
Time, number of hours
One year =8760 h
Yearly Duration Curve
The DC coupled with
the wt’s PC will give
the AEP
B m/s
1 0.8 - 1.7
2 1.9 - 3
3 3.3 - 5.3
4 5.5 - 7.8
5 8 - 10.5
6 10.8 - 13.6
7 13.9 - 16.9
8 17.2 - 20.5
9 20.8 - 24.4
10 24.7 - 28.3
Wind Turbulence
Fast time-scale fluctuations of less than 10 minutes in the wind
speed are associated with turbulence.
The Reynolds number of the atmospheric wind speed is
around 10^8 , which corresponds to a turbulent wind field.
The wind speed can then be decomposed in a 10 minute averaged
velocity and a turbulent fluctuation , such that during a 10
minutes sample:
The main causes of turbulence is the friction of
the wind with the earth surface, and local
fluctuations of temperature in the atmosphere.
Thus, the turbulence will depend on the
surface roughness Z0
To measure the level of turbulence,
the Turbulence intensity (TI or I) factor is used.
It is generally defined for a time scale of 10
minutes
Vw=U10
σ=wind speed standard deviation
Gusts, Ug or Vg
A discrete gust event: a, amplitude; b, rise time; c,
maximum gust variation; d, lapse time
+ve
-ve
Gusts, Ug or Vg
One hour 60 seconds
Wind directions-wind rose
Roman definitions, 30 degrees
intervals
Hellenic wind gods
Boreas
16 Wind directions needed for wind energy analysis
symbol name
N North
NE Northeast
E East
SE South east
S South
SW Southwest
W West
NW Northwest
12 Wind directions for wind data, Oman met stations,
sectors every 30 degrees.
symbol name
N North
NNE North-North East
ENE East-North East
E East
ESE East-South East
SSE South- South East
S South
SSW South-South West
WSW West- South West
W West
WNW West- North West
NNW North-North West
Wind rose
Wind rose and power rose or power density
ανεμολόγιο Ξηρολίμνης 1993
0
5
10
15
20
25
30
35
N
NNE
NE
ENE
E
ESE
SE
SSE
S
SSW
SW
WSW
W
WNW
NW
NNW
ανεμολόγιο "ισχύος", Ξηρολίμνη Κρήτης(% χρόνου*V3
)
0
10000
20000
30000
40000
N
NNE
NE
ENE
E
ESE
SE
SSE
S
SSW
SW
WSW
W
WNW
NW
NNW
1993 wind rose, Eastern Crete 1993 power rose EC, % time* Vdir^3
Predominant wind directions: NW , WNW Predominant power direction: NW
YEAR 1993 Station: Eastern Crete
direction
Speed m/s N NNE NE ENE E ESE SE SSE S SSW SW WSW W WNW NW NNW
0,5 έως 1 0,09 0,01 0,02 0,02 0,04 0,01 0,04 0,16 0,01 0,04 0,12
1 έως 2 0,02 0,19 0,14 0,11 0,11 0,1 0,11 0,12 0,27 0,35 0,17 0,27 0,57 0,19 0,31 0,36
2 έως 3 0,07 0,4 0,22 0,21 0,24 0,2 0,3 0,26 0,37 0,31 0,32 0,42 0,91 0,77 0,62 0,76
3 έως 4 0,02 0,12 0,09 0,05 0,16 0,35 0,3 0,19 0,37 0,55 0,51 0,76 1,76 1,31 1,33 0,7
4 έως 5 0,01 0,02 0,06 0,15 0,2 0,36 0,24 0,51 0,72 0,6 2,1 2,33 2,07 0,21
5 έως 6 0,02 0,05 0,05 0,05 0,09 0,21 0,26 0,4 0,75 0,86 0,27 1,9 3,54 2,18 0,29
6 έως 7 0,05 0,02 0,01 0,02 0,01 0,09 0,15 0,36 0,25 0,45 0,71 0,16 1,11 3,26 2,56 0,35
7 έως 8 0,04 0,01 0,06 0,27 0,34 0,2 0,59 0,65 0,14 0,56 3,05 2,59 0,56
8 έως 9 0,02 0,06 0,19 0,22 0,27 0,75 0,78 0,04 0,25 2,9 2,93 0,4
9 έως 10 0,02 0,01 0,01 0,07 0,21 0,16 0,12 0,39 0,75 0,06 0,11 1,73 2,94 0,5
10 έως 11 0,01 0,04 0,2 0,14 0,09 0,26 0,56 0,04 0,01 1,84 2,38 0,5
11 έως 12 0,04 0,1 0,09 0,07 0,21 0,36 0,06 1,01 2,54 0,51
12 έως 13 0,01 0,04 0,04 0,04 0,22 0,19 0,01 0,75 2,58 0,5
13 έως 14 0,06 0,09 0,05 0,19 0,12 0,01 0,36 2,29 0,98
14 έως 15 0,04 0,09 0,1 0,04 0,14 1,77 0,88
15 έως 16 0,04 0,01 0,05 0,01 0,01 1,05 0,46
16 έως 17 0,01 0,01 0,01 0,61 0,29
17 έως 18 0,11 0,11
18 έως 19 0,01 0,01 0,12 0,12
19 έως 20 0,01 0,01 0,09 0,02
>20 0,01 0,01 0,01
total 0,26 0,88 0,46 0,48 0,66 1,26 2,44 2,77 2,82 5,71 6,76 2,88 9,44 23,19 31,1
2
8,63
Combining a
duration curve
and wind rose
in one single
table, % time
for each wind
bin and each
direction. The
bin here is 1
m/s
Total =99,76%,
calm=0,24
Predominant wind
directions:
• WNW = 23.19%,
• NW = 31.12%
1-2-3
4-5-6
7-8-9
10-11-12
There are
variations
Oman predominate wind directions
WSW
WSW SSW
SSES
S
Oman predominate SUMMER wind directions.
Sultan Qaboos University, Renewable & Sustainable
Research Group, Research Report, May 2010
ανεμολόγιο 1990
0
5
10
15
20
25
30
35
40
45
N NE E SE S SW W NW
διεύθυνση
%χρόνου
Ποταμιά
Μελανιός
Wind rose
Direction
% time
Potamia
Melanios
Question: Is it possible to have differences
even in areas with close proximity?
Question: Is it possible to have differences
even in successive years in one location?
0
2
4
6
8
10
12
14
16
18
20
N ENE SE SSW W NNW
Διεύθυνση ανέμου
%χρόνου
Σκύρος 1983
Σκύρος 1984
Wind direction
% time
1983
1984
Question: What does the wind rose look like in
a long term analysis?
Μύκονος 1983-1989
0
5
10
15
20
25
30
35
40
N
NNE
NE
ENE E
ESE SE
SSE S
SSW SW
W
SW W
W
NW NW
NNW
Διεύθυνση
%χρόνου
Wind direction
% time Mykonos Greece
The onshore (land)
European Wind Atlas
The offshore (sea)
European Wind Atlas
The Greek land Wind
Atlas
www.cres.gr
www.rae.gr
Please keep in
mind, the atlas is
an indication,
measurements
are necessary for
bankable projects
www.cres.gr
The Greek offshore
Wind Atlas
http://www.irena.org/
3 m/s
6 m/s
9 m/s
The wind atlas and major power lines in Kenya
Power lines
7 m/s
2 m/s
12 m/s
7 m/s

S4 oman wind energy speed direction 2016

  • 1.
    11 Welcome to theworld of wind energy Wind Speed Wind Direction Dr. D. V. Kanellopoulos OPWP Renewable Energy Training Program 11-14 December 2016 Muscat, Oman
  • 2.
    In the earth’satmosphere, the ABL is the air layer near the ground affected by diurnal heat, moisture or momentum transfer to or from the surface.
  • 3.
    Wind speed profilesin the Atmospheric (or planetary) Boundary Layer, ABL or PBL or BL Boundary layer thickness varies
  • 4.
    Typical wind profilesresulting due to different atmospheric stability conditions.
  • 5.
    Surface roughness, orroughness length, Z0 or z0 Is a parameter of some vertical wind profile equations that model the horizontal mean wind speed near the ground. In the log profile, it is equivalent to the height at which the wind speed theoretically becomes zero. In reality the wind at this height no longer follows a mathematical logarithm. It is so named because it is typically related to the height of terrain roughness elements. Whilst it is not a physical length, it can be considered as a length-scale a representation of the roughness of the surface. As an approximation, the roughness length is approximately one-tenth of the height of the surface roughness elements. For example, short grass of height 0.01m has a roughness length of approximately 0.001m. Surfaces are rougher if they have more protrusions. Forests have much larger roughness lengths than tundra, for example. Roughness length is an important concept in urban meteorology as the building of tall structures, such as skyscrapers, has an effect on roughness length and wind patterns. When estimating the AEP of a wind farm, it has to be taken as accurate as possible.
  • 6.
  • 7.
  • 8.
    Digitally available foruse for modeling wind energy resource http://www.eea.europa.eu/data-and- maps/data/corine-land-cover-2000-clc2000- seamless-vector-database
  • 9.
    Land use Z0=1 mZ0=0.25m Z0=0.03 m
  • 10.
  • 11.
    The power lawwind profile α depends on roughness
  • 12.
    wind profile changesfrom land to sea Z01 Z02
  • 13.
    Wind profiles comparedto IEC standard
  • 14.
    Wind speed variationwith time, δt=1 sec 10 minutes
  • 15.
    Wind speed variationwith time, δt=1 minute
  • 16.
    Wind speed variationwith time, δt= 1 hour Notice the diurnal wind speed pattern
  • 17.
  • 18.
    Annual average windspeed in km/h at Canberra Airport from 1943 to 2002. Note: the long-term (1961- 90) average is indicated by the horizontal line through the centre of the graph
  • 19.
    Analysis and presentationof wind data. Southeast China - yearly mean wind speeds
  • 20.
    How good isa site based upon the average annual wind speed? Quality of site Wind speed at 10 m AGL poor < 4 m/s Poor-fair 4-5 fair 5-6 good 6-7 Very good 7-8 excellent > 8 Make sure you compare speeds measured for the same height above ground or sea when comparing sites. Otherwise vertical extrapolations will be necessary.
  • 21.
    Study 11.2014 V(m/s) at10 m AGL 28 meteorological stations
  • 22.
  • 23.
  • 24.
    Duration Curve, FrequencyDistribution of wind speeds
  • 25.
  • 26.
    Wind speed, m/s %time Time, number of hours One year =8760 h Yearly Duration Curve The DC coupled with the wt’s PC will give the AEP
  • 27.
    B m/s 1 0.8- 1.7 2 1.9 - 3 3 3.3 - 5.3 4 5.5 - 7.8 5 8 - 10.5 6 10.8 - 13.6 7 13.9 - 16.9 8 17.2 - 20.5 9 20.8 - 24.4 10 24.7 - 28.3
  • 28.
    Wind Turbulence Fast time-scalefluctuations of less than 10 minutes in the wind speed are associated with turbulence. The Reynolds number of the atmospheric wind speed is around 10^8 , which corresponds to a turbulent wind field. The wind speed can then be decomposed in a 10 minute averaged velocity and a turbulent fluctuation , such that during a 10 minutes sample: The main causes of turbulence is the friction of the wind with the earth surface, and local fluctuations of temperature in the atmosphere. Thus, the turbulence will depend on the surface roughness Z0 To measure the level of turbulence, the Turbulence intensity (TI or I) factor is used. It is generally defined for a time scale of 10 minutes Vw=U10 σ=wind speed standard deviation
  • 29.
    Gusts, Ug orVg A discrete gust event: a, amplitude; b, rise time; c, maximum gust variation; d, lapse time +ve -ve
  • 30.
    Gusts, Ug orVg One hour 60 seconds
  • 31.
  • 32.
    Roman definitions, 30degrees intervals Hellenic wind gods Boreas
  • 33.
    16 Wind directionsneeded for wind energy analysis symbol name N North NE Northeast E East SE South east S South SW Southwest W West NW Northwest
  • 34.
    12 Wind directionsfor wind data, Oman met stations, sectors every 30 degrees. symbol name N North NNE North-North East ENE East-North East E East ESE East-South East SSE South- South East S South SSW South-South West WSW West- South West W West WNW West- North West NNW North-North West
  • 35.
  • 36.
    Wind rose andpower rose or power density ανεμολόγιο Ξηρολίμνης 1993 0 5 10 15 20 25 30 35 N NNE NE ENE E ESE SE SSE S SSW SW WSW W WNW NW NNW ανεμολόγιο "ισχύος", Ξηρολίμνη Κρήτης(% χρόνου*V3 ) 0 10000 20000 30000 40000 N NNE NE ENE E ESE SE SSE S SSW SW WSW W WNW NW NNW 1993 wind rose, Eastern Crete 1993 power rose EC, % time* Vdir^3 Predominant wind directions: NW , WNW Predominant power direction: NW
  • 37.
    YEAR 1993 Station:Eastern Crete direction Speed m/s N NNE NE ENE E ESE SE SSE S SSW SW WSW W WNW NW NNW 0,5 έως 1 0,09 0,01 0,02 0,02 0,04 0,01 0,04 0,16 0,01 0,04 0,12 1 έως 2 0,02 0,19 0,14 0,11 0,11 0,1 0,11 0,12 0,27 0,35 0,17 0,27 0,57 0,19 0,31 0,36 2 έως 3 0,07 0,4 0,22 0,21 0,24 0,2 0,3 0,26 0,37 0,31 0,32 0,42 0,91 0,77 0,62 0,76 3 έως 4 0,02 0,12 0,09 0,05 0,16 0,35 0,3 0,19 0,37 0,55 0,51 0,76 1,76 1,31 1,33 0,7 4 έως 5 0,01 0,02 0,06 0,15 0,2 0,36 0,24 0,51 0,72 0,6 2,1 2,33 2,07 0,21 5 έως 6 0,02 0,05 0,05 0,05 0,09 0,21 0,26 0,4 0,75 0,86 0,27 1,9 3,54 2,18 0,29 6 έως 7 0,05 0,02 0,01 0,02 0,01 0,09 0,15 0,36 0,25 0,45 0,71 0,16 1,11 3,26 2,56 0,35 7 έως 8 0,04 0,01 0,06 0,27 0,34 0,2 0,59 0,65 0,14 0,56 3,05 2,59 0,56 8 έως 9 0,02 0,06 0,19 0,22 0,27 0,75 0,78 0,04 0,25 2,9 2,93 0,4 9 έως 10 0,02 0,01 0,01 0,07 0,21 0,16 0,12 0,39 0,75 0,06 0,11 1,73 2,94 0,5 10 έως 11 0,01 0,04 0,2 0,14 0,09 0,26 0,56 0,04 0,01 1,84 2,38 0,5 11 έως 12 0,04 0,1 0,09 0,07 0,21 0,36 0,06 1,01 2,54 0,51 12 έως 13 0,01 0,04 0,04 0,04 0,22 0,19 0,01 0,75 2,58 0,5 13 έως 14 0,06 0,09 0,05 0,19 0,12 0,01 0,36 2,29 0,98 14 έως 15 0,04 0,09 0,1 0,04 0,14 1,77 0,88 15 έως 16 0,04 0,01 0,05 0,01 0,01 1,05 0,46 16 έως 17 0,01 0,01 0,01 0,61 0,29 17 έως 18 0,11 0,11 18 έως 19 0,01 0,01 0,12 0,12 19 έως 20 0,01 0,01 0,09 0,02 >20 0,01 0,01 0,01 total 0,26 0,88 0,46 0,48 0,66 1,26 2,44 2,77 2,82 5,71 6,76 2,88 9,44 23,19 31,1 2 8,63 Combining a duration curve and wind rose in one single table, % time for each wind bin and each direction. The bin here is 1 m/s Total =99,76%, calm=0,24 Predominant wind directions: • WNW = 23.19%, • NW = 31.12%
  • 38.
  • 39.
    Oman predominate winddirections WSW WSW SSW SSES S
  • 40.
    Oman predominate SUMMERwind directions. Sultan Qaboos University, Renewable & Sustainable Research Group, Research Report, May 2010
  • 41.
    ανεμολόγιο 1990 0 5 10 15 20 25 30 35 40 45 N NEE SE S SW W NW διεύθυνση %χρόνου Ποταμιά Μελανιός Wind rose Direction % time Potamia Melanios Question: Is it possible to have differences even in areas with close proximity?
  • 42.
    Question: Is itpossible to have differences even in successive years in one location? 0 2 4 6 8 10 12 14 16 18 20 N ENE SE SSW W NNW Διεύθυνση ανέμου %χρόνου Σκύρος 1983 Σκύρος 1984 Wind direction % time 1983 1984
  • 43.
    Question: What doesthe wind rose look like in a long term analysis? Μύκονος 1983-1989 0 5 10 15 20 25 30 35 40 N NNE NE ENE E ESE SE SSE S SSW SW W SW W W NW NW NNW Διεύθυνση %χρόνου Wind direction % time Mykonos Greece
  • 44.
  • 45.
  • 47.
    The Greek landWind Atlas www.cres.gr www.rae.gr Please keep in mind, the atlas is an indication, measurements are necessary for bankable projects
  • 48.
  • 49.
  • 50.
    3 m/s 6 m/s 9m/s The wind atlas and major power lines in Kenya Power lines
  • 54.
  • 56.