Detailed UN-REACH stakeholders mapping report. For more information contact Jeanette Kayirangwa (WFP) or Venuste Muhamyankaka (SUN Alliance Rwanda). https://www.facebook.com/groups/SUNCSNLearningRoute/ and http://suncivilsocietynet.wixsite.com/learningroute
Monitoring, evaluation and accountability staff presentationkltpollock
April 30th SRC Staff presentation on MEA monitoring and impact tables, their roles and responsibilities in relation to those tables, and SRC priority actions for the coming year
Expanded Immunization Program Leadership Coordination and Management in EthiopiaYohannesLakew1
This document summarizes the leadership, management, and coordination (LMC) of immunization programs in Ethiopia. It describes the organizational structure for immunization coordination including the Ministry of Health, regional health bureaus, the Interagency Coordinating Committee, technical working groups, and the National Immunization Technical Advisory Group. It highlights progresses made in planning, monitoring, advocacy, and human resources. It also outlines successes in coverage gains, challenges with turnover and data quality, and prospects for continued capacity building, research, and addressing equity issues.
Policies and Programs on food and Nutrition in Ethiopiaessp2
This document outlines policies and programs on food and nutrition in Ethiopia. It discusses nutrition-specific and nutrition-sensitive interventions, and the pathways through which nutrition-sensitive interventions can affect diet and food systems. It then provides an overview of Ethiopia's policy landscape on food and nutrition, outlining various strategies and policies that aim to improve nutrition, including the Food, Nutrition and Policy, Agriculture Growth Program Phase II, Productive Safety Net Program, and National Nutrition Program. The document concludes that Ethiopia has a favorable policy environment for improving diets and nutrition, but effective implementation, coordination, evidence-based scaling up of interventions, and strong monitoring and evaluation are still needed.
The document discusses monitoring and evaluation (M&E) of health programs, defining monitoring as the routine collection of data to track progress towards objectives, while evaluation assesses the impact of a program by measuring outcomes at baseline and endline using a control group. It provides guidance on developing M&E plans, including describing programs and expected outcomes, identifying indicators, data collection sources and schedules, and disseminating findings to inform decision-making.
The Community Score Card (CSC) is a participatory governance tool that brings together community members, service providers, and local government to identify challenges and generate solutions to improve services. It follows a 5 phase process: 1) Planning, 2) Community assessment and scoring, 3) Provider assessment and scoring, 4) Joint prioritization and action planning, 5) Implementation and monitoring. Research in Malawi evaluated CSC's impact and found it effective for quality improvement. CARE developed the CSC and it has now spread across sectors and organizations worldwide. New resources and guidance have been created to support CSC implementation.
This document discusses the importance of results-based monitoring and evaluation (M&E) in government. It defines results-based M&E as regularly collecting data on performance indicators to see if projects are achieving their goals. Traditional M&E focuses only on implementation, while results-based M&E demonstrates whether goals are being met. The document provides examples of a results chain from inputs to long-term goals and explains why selecting outcome indicators is important for monitoring progress toward outcomes. Results-based M&E helps improve management, focus interventions, demonstrate successes, and ensure accountability by showing that programs are producing benefits.
Identifying the basic purposes and scope of M&E. Describing the functions of an M&E plan. Identifying and understanding the main components of an M&E plan
This document summarizes Nepal's progress toward achieving several health-related Sustainable Development Goals by 2030. It finds that Nepal has made progress in reducing poverty, child and maternal mortality, and increasing life expectancy, but still needs to achieve targets for maternal mortality, neonatal and child mortality, tuberculosis, and universal health coverage. It recommends focusing on underserved groups, increasing health funding and workers, strengthening data systems, and encouraging multi-sector partnerships to achieve the remaining goals.
The document outlines the requirements and purpose of an Annual Work Plan and Budget (AWPB) for borrowers. An AWPB must be submitted to IFAD for review and approval before each project year. The main purposes of an AWPB are to guide project implementation, set benchmarks to measure progress, and avoid issues that could arise without proper planning. An AWPB should include general project information, implementation progress to date, plans and budgets for the upcoming year, and annexes with additional details. The planning process involves needs assessments, evaluations, workshops, and consolidating component plans into a draft AWPB for review and approval.
A series of modules on project cycle, planning and the logical framework, aimed at team leaders of international NGOs in developing countries.
Part 8 of 11
The document provides an overview of monitoring and evaluation methods for programs. It discusses key concepts like monitoring, evaluation, attributes of each, and who conducts them. The five phases of evaluation are outlined: planning, method selection, data collection and analysis, reporting, and implementing recommendations. Specific monitoring and evaluation tools are also described. The overall summary is:
Monitoring and evaluation follow a five phase process including planning, method selection, data collection and analysis, reporting, and implementing recommendations to improve programs. Key concepts like monitoring, evaluation, attributes of each, tools used, and who conducts them are outlined.
The document discusses using a Community Score Card (CSC) tool to promote governance in Bombo, Uganda. The CSC is a qualitative monitoring tool used by communities to evaluate local services and projects. It allows service users to provide feedback to providers, and providers to learn what is working and what needs improvement directly from communities. Eight villages in Bombo participated in a CSC process where community members identified and scored performance indicators, proposed improvements, and met with service providers to present results and discuss solutions. The process aimed to strengthen communication between communities and local governance in Bombo.
The document discusses the logical framework approach, which is a technique used to plan, monitor, and evaluate extension projects. It was initially developed for USAID in 1970. The logical framework involves a hierarchy of objectives from goals to inputs, along with objectively verifiable indicators, means of verification, and critical assumptions. It helps reveal the logic and major elements of a project to evaluate and monitor progress. Using a logical framework ensures objectives are clear and critical assumptions are identified. It also helps with monitoring, establishing accountability, and understanding project sustainability.
Introduction to Routine Health Information System SlidesSaide OER Africa
Introduction to Routine Health Information System was created for undergraduate and postgraduate health science students to introduce them to the concepts and methods of routine health information systems.
The learning objectives are to help users explain the roles of routine health information systems (RHIS) in health service management; examine strategies used to improve routine health information systems; acquaint with skills to carry out the process of improving RHIS performance; discuss three categories of determinants that influence RHIS.
This document provides an introduction to monitoring and evaluation for interns. It defines monitoring as the routine collection and analysis of project data to provide information on progress, while evaluation assesses a project's achievements against its objectives and identifies lessons learned. Several tools for monitoring and evaluation are described, including Gantt charts, timelines, and logical frameworks. The presentation emphasizes that monitoring and evaluation are important project management processes that help ensure quality, allow for course corrections, and provide lessons for future projects.
The Rural Health Care program provides funding to support telecommunications services for rural health care providers. It is administered by the Universal Service Administrative Company on behalf of the Federal Communications Commission. There are two main funding programs - a Pilot Program that supports 85% of broadband network costs, and a Primary Program that provides discounts for telecom services and internet access. To be eligible, a provider must be located in a rural area, be non-profit or public, and be a type of health care organization defined by the program such as a hospital, clinic, or health department. Applicants complete a four-step process involving filing forms to request services, select bids, receive funding, and confirm services. The program is undergoing changes including
This document discusses monitoring, evaluation and learning (MEL) for development projects. It emphasizes that MEL is important to: 1) support decision making by generating feedback; 2) enhance partnerships; and 3) foster development effectiveness by indicating results. The document outlines the differences between monitoring, evaluation and learning. Monitoring refers to routine data collection and analysis to guide implementation, while evaluation assesses projects periodically. Learning is the process of intentionally using information from MEL to continuously improve projects. The document provides examples of MEL focus, indicators, targets and feedback mechanisms for a cassava agronomy project in order to effectively measure and improve results over time.
The document outlines the organizational structure and roles of Nepal's central health services. It describes three departments under the Ministry of Health: Department of Health Services, Department of Ayurveda, and Department of Drug Administration. The Department of Health Services has seven divisions that oversee areas like management, child health, and primary care. It also operates several centers for tuberculosis control, health training, public health laboratories, and AIDS/STD control. The organizational structure extends from the central level down to regional, district, and local health facilities. The central level determines resources and plans while lower levels provide services and refer patients within the network.
Consultant's technical & financial proposalMohamed Ahmed
Mr. Mohamed Abdi Ahmed is submitting a proposal to provide entrepreneurship training to Save the Children. He has over 5 years of experience conducting similar work in Somalia, including research and training in vocational education, livelihoods, microfinancing, and entrepreneurship.
If selected, his methodology would include participatory training techniques like demonstrations, exercises, and discussions. He would tailor internationally recognized strategies to the specifications set by Save the Children.
The timeline includes a 3-day intensive training in 3 locations, for a total of 15 consultant days. Deliverables include training manuals and reports submitted after each location. The financial proposal requests a daily rate of $200 for a total cost of $3,
National monitoring and evaluation guidelines and standard operating procedur...Obongo Komingola
This document provides guidelines and standard operating procedures for monitoring and evaluating HIV programs in Kenya (Pillar 1). It was developed through extensive consultation with stakeholders from the Kenyan government, implementing partners, and the CDC. The guidelines define the roles and responsibilities for monitoring and evaluation at the community, facility, district, provincial, and national levels. They also provide standard operating procedures for key M&E activities like data collection, validation, supervision, and dissemination. The goal is to streamline HIV data management and ensure accurate, complete and timely data that can be used to guide the national HIV response and improve outcomes in Kenya.
This document outlines the process for developing District Health Action Plans (DHAPs) in India. It discusses how DHAPs are created through participatory planning at the village, block, and district levels. The planning process involves forming teams, conducting surveys, developing village health plans, and holding consultations. DHAPs include a situational analysis, objectives, interventions, work plans, budgets, and monitoring plans. They are meant to guide implementation and be tailored to local health needs and resources. The document reviews framework, components, strategy for technical assistance, and provides a critical appraisal to improve the DHAP process.
The document provides an overview of the Ethiopian Primary Health Care Clinical Guidelines (EPHCG). The EPHCG is an algorithmic clinical guideline developed for primary healthcare workers in Ethiopia. It covers 98 adult symptoms, 37 child symptoms, and 25 chronic illnesses. Implementation of the EPHCG involves 4 pillars: the guideline itself, a training program, health systems engagement, and monitoring and evaluation. Initial piloting of the EPHCG identified some gaps around implementation that require additional support like strengthening management buy-in and improving health worker motivation.
This presentation provides an overview of resource mobilization and fundraising. It discusses key topics like the types of resources, defining resource mobilization, the resource mobilization process, challenges, and the importance of resource mobilization. The presentation outlines the development and management of a resource mobilization program, including preparing a strategy, identifying stakeholders, developing messages, selecting vehicles, monitoring and evaluation, and ensuring readiness. It also covers funding proposal writing. The overall goal is to help organizations attract resources and broaden donor support through effective resource mobilization.
This document outlines the District Health Action Plan (DHAP) for a district. It begins by introducing the DHAP and its origins in the National Rural Health Mission. It then discusses what a Programme Implementation Plan and DHAP are, and why DHAPs are needed. It describes the process for preparing a DHAP, including using a bottom-up approach involving various levels from village to district. It outlines the key components that should be included in a DHAP, such as situational analysis, interventions, monitoring and evaluation, and budgeting. It provides guidance on how to structure, implement, monitor and fund the DHAP.
Capacity building u nder pepfar ii final cobranded template final 9 20 (2)jgermanow
The document discusses designing a capacity building program for a district health team in partnership with the Ministry of Health. It lists interventions that should be considered like building leadership capacity, ensuring the program aligns with national priorities, and sustainability. It emphasizes that capacity building takes time and programs should focus on ongoing functioning, not just implementing specific programs. Monitoring and evaluation are also essential to build an evidence base.
This document outlines a monitoring and evaluation (M&E) system for the health sector in Ethiopia. It discusses planning M&E, conducting monitoring through routine data collection using clear indicators, and evaluating outcomes. Monitoring tracks implementation through regular data reviews, while evaluation assesses outcomes objectively. Together, M&E provides information for decision-making to improve health sector strategies and interventions.
This document analyzes Oxfam Vietnam's Participatory Poverty Mapping Analysis project using Porter's Value Chain Analysis. It examines the project as a three-stage process: activity analysis to identify data collection, analysis and utilization activities; value analysis to identify processes behind each activity and their impact; and evaluation and planning to determine interventions for process innovations and efficiencies. The analysis aims to systematically capture how qualitative community-level data is translated into national advocacy and policy campaigns.
Stakeholder Mapping - service design workshop toolssimonorafferty
This is a brief example of how you go from stakeholder mapping in a service design workshop to some data that you can analyse or visualise. It involves creating an .xls dataset of nodes and links from the post-it notes added to worksheets by users
The essential first step in effective communication and reputation management lies in understanding the perspective of your stakeholders. Our presentation explores stakeholder mapping, a tool to help you achieve your communication objectives. For more information visit Insignia Communication's website at http://insigniacomms.com/services/reputation-management/stakeholder-mapping/
This document discusses stakeholder mapping and engagement strategies. It defines stakeholder mapping as identifying relevant individuals, groups, and organizations; categorizing them; mapping relationships; ranking by influence; and prioritizing key audiences. Two specific processes are described: Participatory Impact Pathways Analysis (PIPA) uses network maps of current and desired future relationships to identify strategies; and the Alignment, Interest, and Influence Matrix (AIIM) ranks stakeholders to guide engagement approaches from developing awareness to challenging beliefs. The document serves as an introduction to stakeholder mapping and analysis techniques.
This document discusses stakeholder mapping and provides guidance on its purpose, when it should be created, and how stakeholders should be identified. A stakeholder map helps visually consolidate and communicate the key constituents of a project. It is preferably created when the project plan is being developed. Stakeholders can be identified by general or specific roles, by actual people, and relationships can be visualized through methods like scale, line, and proximity. The conclusion states there is no right way to create a stakeholder map as long as it serves the purpose of identifying key players and their relationships.
The roles of stakeholders in curriculum implementationChoc Nat
The roles of stakeholders in curriculum implementation are discussed. Stakeholders include learners, teachers, curriculum managers/administrators, parents, community members, and others. Learners are central to the curriculum. Teachers are curriculum developers and implementers. Curriculum managers oversee implementation. Parents support the curriculum financially and through involvement. Community members provide resources. The document also discusses curriculum pilot testing, monitoring, and evaluation.
This document discusses the concept of curriculum change and the factors that drive it. It provides information on:
- The constant nature of change and how it leads to improvement through technological advancement and increasing knowledge.
- Key drivers of curriculum change including community needs, technology, political influences, and complexity from various stakeholder demands.
- Features of successful change including it being an ongoing process that requires support from individuals.
- Types of curriculum changes and strategies for implementing changes.
- The need to develop curriculum change through cooperative goal-setting and problem-solving approaches while maintaining open communication.
Stakeholder analysis is used to identify an organization's stakeholders, assess how they may be impacted by or influence the organization, and develop strategies for managing stakeholder relationships. The document defines stakeholders as any person or group that can be positively or negatively affected by an organization's actions. It then discusses different frameworks for categorizing stakeholders, such as internal vs. external, primary vs. secondary, and mapping stakeholders based on attributes like power, interests, and urgency. Performing a stakeholder analysis helps an organization develop strategies to meet stakeholder needs and create value, thereby gaining acceptance and managing risks from stakeholders.
The document provides information on nutrition stakeholder and action mapping conducted in Rwanda, including:
- An overview of what nutrition stakeholder and action mapping is and its objectives to better understand who is working in nutrition, where, and how many people they are reaching.
- Results from mappings conducted in 2012 and 2015 that identified stakeholders, their coverage areas, interventions conducted, and beneficiaries reached to help inform scale-up.
- Information on how the mappings can help various groups including government, districts, organizations, and donors to enhance coordination and identify gaps.
Joyce Njoro, Senior Programme Officer, REACH/UN Network for SUNSUN_Movement
The document discusses functional capacities needed for effective nutrition governance. It defines functional capacities as essential management skills like planning, managing change, and sustaining technical capacities. REACH supports developing capacities for multi-sector coordination of national nutrition policies. Key functional capacities include engaging stakeholders, assessing situations to create shared visions, formulating multi-sector strategies and plans, budgeting and implementing in a coordinated way, and jointly monitoring and learning. The document provides examples of how these capacities can be strengthened in different country contexts.
Data compilation during the intermediate phase in preparation for the next wo...TransformNutritionWe
This presentation is about TNWA Policy and programs component and more specifically on search approaches for current/ongoing policy and programs focusing on nutrition at national level for Nigeria and Burkina Faso
It also presents TNWA's Stories of Change: change over time in policy and programs: Examples of Senegal and Zambia.
Presentation from the second conference call regarding the development of COP2 - planning, costing, implementing and financing multi-sectoral actions for improved nutrition
Jeanne d'Arc Nyirajyambere is a bilingual Senior Nutrition Advisor with over 20 years of experience in health, nutrition, WASH, and HIV/AIDS programs in Rwanda. She currently works for Global Communities on the USAID Twiyubake nutrition and WASH program across 12 districts in Rwanda. Previously, she held senior nutrition roles with Save the Children, MSF, and other organizations, designing and implementing various community health and nutrition initiatives in Rwanda. She has a Master's in Public Health and Bachelor's in health facilities management.
Cop1 costing and financing sandra mutumaSUN_Movement
1) The document discusses stocktaking and potential priorities for the Scaling Up Nutrition (SUN) Community of Practice (COP1) meeting in 2015, based on publications by Action Contre la Faim (ACF) on aid for nutrition.
2) It notes several issues including a lack of alignment between country costed plans, the OECD DAC nutrition code, and SUN definitions of nutrition-specific interventions. Disaggregated data by intervention is also lacking.
3) ACF advocates for longer funding cycles for nutrition-specific interventions like acute malnutrition management, and increasing domestic investment alongside external funding for comprehensive nutrition packages. ACF staff are actively advocating in relevant subgroups.
Purnima Menon - Strategic capacity building in nutrition for district officialsPOSHAN
Presentation by Purnima Menon on "Strategic capacity building in nutrition for district officials" at Developing a nutrition training roadmap to support India’s nutrition progress (17-18 Dec 2019)
An examination of the dynamics of nutrition program implementation in Ethiopi...essp2
1) The study assessed facilitators and constraints to implementing Ethiopia's National Nutrition Program (NNP) at national and sub-national levels. It found that while the NNP design considered multi-sector involvement, implementation faced challenges with leadership, capacity, awareness, coordination, and budget constraints, especially at sub-national levels.
2) Key challenges included lack of nutrition focal points in non-health sectors, limited awareness outside health sectors, and minimal sub-national coordination. Budget limitations were also a constraint.
3) Recommendations included establishing high-level multi-sectoral coordination led by the Prime Minister's office, capacity building at sub-national levels, and designating nutrition focal points in all
An examination of the dynamics of nutrition program implementation in Ethiopi...TogetherForNutrition
1) The study assessed facilitators and constraints to implementing Ethiopia's National Nutrition Program (NNP) at national and sub-national levels. It found that while the NNP design considered multi-sector involvement, implementation faced challenges with leadership, capacity, awareness, coordination, and budget constraints, especially at sub-national levels.
2) Key challenges included lack of nutrition focal points in non-health sectors, limited awareness outside health sectors, and minimal sub-national coordination. Budget limitations were also a constraint.
3) Recommendations included establishing high-level multi-sectoral coordination led by the Prime Minister's office, capacity building, and designating nutrition focal points in all sectors. Increased awareness,
A presentation given by Manaan Mumma at the Transform Nutrition regional meeting 'Using evidence to inspire action in East Africa' Nairobi, Kenya 8 June 2017.
Using the government health system to deliver nutrition interventions in Bang...Transform Nutrition
This presentation by Masum Billah, icddr,b was shown at the Transform Nutrition - Evidence for Action regional meeting in Kathmandu, Nepal on 8 July 2017. This one-day event shared Transform Nutrition evidence on key issues related to nutrition policy in Nepal, Bangladesh and India, lessons on strategies for change from other contexts and discuss the relevance and applicability of the research findings to policies/programmes that aim to address nutrition in South Asia.
This document outlines the 5 step process for conducting a needs assessment in public health care: 1) Getting Started, 2) Identifying Health Priorities, 3) Assessing Health Priorities, 4) Planning for Change, and 5) Moving On/Reviewing. The goals of needs assessment are to understand the health issues facing a population and agree on priorities and resource allocation to improve health and reduce inequalities. Key aspects include defining the target population, gathering data on health conditions and their impacts, selecting priorities based on impact and changeability, and developing an action plan to address priorities through acceptable and feasible interventions.
Joint Nutrition, M&E, and SBC Working Groups Session SALLY ABBOTTCORE Group
This document discusses indicators to monitor progress on USAID's Multi-Sectoral Nutrition Strategy. It outlines new proposed indicators for nutrition-specific, nutrition-sensitive, and capacity building interventions to replace existing PPR indicators. Key proposed indicators include the number of children and pregnant women reached by nutrition programs, the diversity of diets among female agriculture beneficiaries, and the number of individuals receiving nutrition training. The document provides details on how to define and measure these indicators.
Steps in designing nutrition programmeDavid mbwiga
The document outlines the key steps to plan a nutrition program, which includes gathering and synthesizing quantitative and qualitative data on the nutrition situation. This data is then analyzed to determine the program's focus, goals and objectives. The program will prioritize improving infant and young child feeding practices like exclusive breastfeeding and adequate complementary feeding. A review of existing health services is also required to integrate the program and address gaps. The program goals are to ultimately reduce child mortality by improving children's nutritional status through improved feeding practices and access to preventative health services.
The PSNP in Ethiopia aims to address food insecurity and malnutrition through multi-sectoral collaboration. While PSNP-4 integrated nutrition objectives throughout its design, challenges remain in implementation due to limited capacities at local levels and service availability. Lessons indicate a need to better define implementation modalities across sectors and build frontline worker skills. Ongoing data collection and advocacy can help address bottlenecks and guide the transition from design to effective nutrition-sensitive implementation.
Nutrition Advocacy Process: Using PROFILES and Nutrition CostingCORE Group
This document outlines the nutrition advocacy process using PROFILES and nutrition costing tools. It begins with defining key terms like nutrition advocacy and describing PROFILES and nutrition costing. PROFILES is an evidence-based tool that calculates the consequences of malnutrition and benefits of improved nutrition. Nutrition costing estimates the costs of implementing nutrition programs. The document then discusses how the results of these tools are used in multi-stakeholder workshops to develop advocacy plans and materials. Examples of results from various country applications are provided, showing estimated lives saved and economic impacts. New PROFILES models are described that examine relationships between breastfeeding, stunting, and outcomes.
Using the health system to deliver nutrition interventions in BangladeshTransform Nutrition
This presentation by Masum Billah, iccdr,b was shown at the Transform Nutrition - Evidence for Action regional meeting in Kathmandu, Nepal on 8 July 2017. This one-day event shared Transform Nutrition evidence on key issues related to nutrition policy in Nepal, Bangladesh and India, lessons on strategies for change from other contexts and discuss the relevance and applicability of the research findings to policies/programmes that aim to address nutrition in South Asia.
SUN Civil Society Learning Route: innovation plan submitted by the National Civil Society alliance. More info: http://suncivilsocietynet.wixsite.com/learningroute/rwanda-learning-route or contact C.Ruberto@savethechildren.org.uk
Collaboration with Government for Ensuring Quality Nutrition Services Present...CORE Group
Theme 1: The experiences in Malawi and Nigeria showed that gaining buy-in from governments to test improved nutrition services approaches was achieved through advocacy, partnership development, and taking time to build relationships with local leadership. This allowed the approaches to be customized to each country context.
Theme 2: Initial implementation phases in both countries identified important lessons about integrating the approaches into health systems and scaling up. This included strengthening the health system beyond pilot sites and integrating indicators and guidelines.
Theme 3: Sustaining government ownership required strong political will, empowering communities, integrating services across sectors, defining roles and responsibilities, and ongoing capacity building. Future efforts should focus on sharing lessons learned, updating guidelines and training, and integrating quality
Data and evidence to address India's nutrition challenge: POSHAN's State Poli...POSHAN
Presented at 'Strengthening National, State and District-level Actions for Nutrition: Insights from the National Family Health Survey Data' on 13th December, 2017 at IIC, New Delhi.
Visit the POSHAN website for more: www.poshan.ifpri.info
Similar to Rwanda stakeholder & action mapping 2014 15 (20)
This document discusses monitoring, evaluation, accountability and learning (MEAL) for nutrition advocacy efforts. It outlines why MEAL is important to monitor progress towards objectives, evaluate impact, ensure accountability, and support learning. Key points include developing a theory of change, using participatory and sustainable MEAL systems, and tools to record and share results and changes achieved. Examples are given of capacity building with local NGOs leading to increased access to justice and changes in policies and behaviors. The document promotes peer-to-peer support for MEAL through a new database and working group.
1. Effective monitoring, evaluation, accountability and learning (MEAL) systems for civil society alliances can help ensure impact, sustainability, learning and accountability. MEAL of advocacy and policy work requires identifying changes in attitudes, discourse, procedures, policies and behaviors.
2. Key elements of MEAL systems include developing a theory of change, selecting appropriate methodologies, maintaining organized data records, budgeting for MEAL, and using the SUN MEAL database and website to share results. Nutrition advocacy outcomes can be measured by changes in planning, resources, funding, accountability and civil society strength.
3. Measuring advocacy requires mapping stakeholders, assessing starting knowledge/views/actions and desired changes, identifying tactics, and
The SUN Civil Society Network (CSN) is a global network of over 3,000 civil society organizations in 53 countries working to eliminate malnutrition. The CSN was established in 2011 to mobilize civil society actors and coordinate with other SUN networks to support country governments. Key roles of CSN members include raising awareness, advocacy, capacity building, and implementing nutrition-specific and nutrition-sensitive interventions. The CSN has achieved policy changes, increased commitments and budgets for nutrition, and greater accountability in several countries. Going forward, the CSN will continue efforts to reduce malnutrition and address its root causes.
#SUNCSOpportunities Working with Parliamentarians to accelerate parents friendly workplaces in Zimbabwe, investigating factors that influence families in using BMS in Laos, enabling youth participation in Nutrition MSP to enhance Adolescence Nutrition practices in 2 districts in Malawi, strengthening youth capacity and engagement in Nutrition and advocacy in Zimbabwe and Rwanda and empowering youth leadership in combatting non-communicable diseases in Sri Lanka
These and much more are the intervention areas awarded by the 2019 SUN CSN Awards #Innovation&Research Funds and #YouthGrants
Congratulations to the 2 Civil Society Alliances
And to the 4 Youth Leaders for Nutrition #YL4N
The SUN CSN Award gives the opportunity to members of the SUN CSN to research upon, test and pilot new practices that could make a great impact on current Nutrition intervention at Local, National, Regional and Global level.
The awarded organizations/individuals have 6 months to implement their projects and to assess if the approaches are worth to be scaled up and sustained over the time and which are the improvements & learnings we should keep in consideration to harvest a greater result.
Looking forward know and disseminate the results after their completion in July 2020. Best of luck to you all!
1) Acute malnutrition is a major global problem affecting 50 million children under five annually and contributing to nearly 50% of under-five deaths, yet current treatment strategies only reach 20% of affected children.
2) The document calls on world leaders to transform the acute malnutrition treatment system to make it more effective, efficient and accessible in order to save millions of lives.
3) It recommends that the upcoming UN Global Action Plan on Wasting include commitments to simplifying and unifying the treatment approach, developing a time-bound plan to change to a single treatment system led by the UN, and securing financing to achieve global targets for reducing wasting.
The document summarizes the proceedings of the Asia Regional Coordination Group meeting in Siem Reap, Cambodia on September 18, 2019. The group pledged solidarity to end hunger and malnutrition in line with SUN Movement principles and international human rights. They called on global and country leaders to address malnutrition through developing nutrition plans, establishing multi-sectoral platforms, allocating financial resources, promoting health systems and nutrition education. The group also called for commitments at the 2020 Nutrition for Growth Summit to achieve global nutrition goals and targets.
National CSA impact and achievement - 2017
The document summarizes the achievements of Civil Society Alliances (CSAs) in improving nutrition outcomes in several countries. It describes impacts in four outcomes: 1) Improved planning through new legislation, policy changes, and commitments. 2) Increased resources and funding through higher budgets and resource mobilization. 3) Increased accountability like law enforcement and capacity building. 4) Strengthened CSAs through governance improvements and knowledge sharing. Examples from over 15 countries demonstrate progress in planning, funding, accountability and enabling effective multi-stakeholder nutrition efforts.
New Guidance on inappropriate Promotion of Foods for infants and young Childr...SUN Civil Society Network
The document discusses new WHO guidance on ending the inappropriate promotion of foods for infants and young children. Research presented found widespread cross-promotion of breastmilk substitutes and commercial complementary foods. The guidance provides seven recommendations to ensure optimal infant and young child feeding practices and protect breastfeeding by regulating the marketing of these products.
The document summarizes the process, achievements, and challenges of Rwanda's 2012 nutrition stakeholder and action mapping. Over five months, stakeholders were identified and the activities they undertake to address 21 selected Core Nutrition Actions were mapped. This was the first such mapping produced in Rwanda. It helped identify gaps, engage more stakeholders, and inform national nutrition policies and strategic planning. Challenges included sensitizing all stakeholders, deciding which interventions to include, collecting timely partner information, and reviewing the analysis as new partners joined.
La organización Nutres y otras ONGs realizaron esfuerzos para promover estilos de vida saludables y prevenir la obesidad entre niños y adolescentes, incluyendo presentar un proyecto de ley para regular la venta de comida chatarra en escuelas, talleres educativos sobre nutrición para más de 1,500 personas, y apoyar la agricultura sostenible para mejorar la alimentación de las familias.
Esta propuesta de país en nutrición presentada por El Salvador para la Segunda Cumbre de Nutrición para el Crecimiento en 2017 destaca los avances y desafíos del país en materia de nutrición. Entre los avances se encuentran una mayor tasa de lactancia materna exclusiva, una reducción de la desnutrición crónica en menores de 5 años, y el establecimiento de entidades como CONASAN para abordar la seguridad alimentaria y nutricional. Sin embargo, aún persisten desafíos como la desnutrición crónica por encima
El Ministerio de Salud de El Salvador presentó una propuesta de país en nutrición con objetivos como reducir el retraso en el crecimiento y la desnutrición en niños menores de 5 años, mantener o reducir el sobrepeso y la obesidad, e incrementar la lactancia materna exclusiva. La propuesta fue desarrollada por un equipo interinstitucional y cuenta con el apoyo de varias organizaciones nacionales e internacionales. Los asistentes al lanzamiento de la propuesta resaltaron su importancia para mejorar la nutrición y calidad de vida de los
El documento resume varias actividades realizadas por la Fundación Éxito en 2016 para promover la nutrición infantil en Colombia, incluyendo el Mes por la Nutrición Infantil con eventos de sensibilización, la Lactatón donde 5,000 madres amamantaron a sus hijos, la entrega del Premio por la Nutrición Infantil que reconoce el trabajo de organizaciones en esta área, y la firma del Pacto por la Nutrición Infantil por alcaldes, gobernadores y empresas para generar acciones a favor de los niños. También se
The document summarizes activities of the Ethiopia Civil Society Coalition for Scaling Up Nutrition (ECSC-SUN). Key points include:
1) ECSC-SUN hosted a nutrition learning forum in December 2016 to discuss coordinated efforts to address malnutrition. The forum highlighted ECSC-SUN's achievements and priorities for the next phase.
2) ECSC-SUN delegates participated in an international learning exchange in Rwanda where they developed an innovation plan on using media to raise nutrition awareness. This plan won an award.
3) ECSC-SUN is refining its strategic priorities for 2017-2020 which include supporting implementation of Ethiopia's second National Nutrition Program. It is also discussing leadership and funding arrangements for
La Alianza de las Organizaciones de la Sociedad Civil por la Soberanía y Seguridad Alimentaria Nutricional en El Salvador se creó en 2014 e inicialmente incluyó siete organizaciones. La Alianza aboga por el reconocimiento de la nutrición como una prioridad nacional y por marcos legales que apoyen la soberanía y seguridad alimentaria. Ha beneficiado a 5,000 personas a través de incidencia política y educación nutricional. Además de continuar impulsando iniciativas, la Alianza busca incluir más organizaciones para ampliar
Presentation by Julie Topoleski, CBO’s Director of Labor, Income Security, and Long-Term Analysis, at the 16th Annual Meeting of the OECD Working Party of Parliamentary Budget Officials and Independent Fiscal Institutions.
Jennifer Schaus and Associates hosts a complimentary webinar series on The FAR in 2024. Join the webinars on Wednesdays and Fridays at noon, eastern.
Recordings are on YouTube and the company website.
https://www.youtube.com/@jenniferschaus/videos
FT author
Amanda Chu
US Energy Reporter
PREMIUM
June 20 2024
Good morning and welcome back to Energy Source, coming to you from New York, where the city swelters in its first heatwave of the season.
Nearly 80 million people were under alerts in the US north-east and midwest yesterday as temperatures in some municipalities reached record highs in a test to the country’s rickety power grid.
In other news, the Financial Times has a new Big Read this morning on Russia’s grip on nuclear power. Despite sanctions on its economy, the Kremlin continues to be an unrivalled exporter of nuclear power plants, building more than half of all reactors under construction globally. Read how Moscow is using these projects to wield global influence.
Today’s Energy Source dives into the latest Statistical Review of World Energy, the industry’s annual stocktake of global energy consumption. The report was published for more than 70 years by BP before it was passed over to the Energy Institute last year. The oil major remains a contributor.
Data Drill looks at a new analysis from the World Bank showing gas flaring is at a four-year high.
Thanks for reading,
Amanda
Was this forwarded to you?
If you’re a Premium FT subscriber, sign up here to get this newsletter delivered straight to your inbox.
Sent Tuesdays and Thursdays.
Not a Premium subscriber?
Take out a subscription, or upgrade from standard.
New report offers sobering view of the energy transition
Every year the Statistical Review of World Energy offers a behemoth of data on the state of the global energy market. This year’s findings highlight the world’s insatiable demand for energy and the need to speed up the pace of decarbonisation.
Here are our four main takeaways from this year’s report:
Fossil fuel consumption — and emissions — are at record highs
Countries burnt record amounts of oil and coal last year, sending global fossil fuel consumption and emissions to all-time highs, the Energy Institute reported. Oil demand grew 2.6 per cent, surpassing 100mn barrels per day for the first time.
Meanwhile, the share of fossil fuels in the energy mix declined slightly by half a percentage point, but still made up more than 81 per cent of consumption.
Call Girls Noida Just Call 9711199171 Top Class Call Girl Service Available
Rwanda stakeholder & action mapping 2014 15
1. Stakeholder & Action Mapping for Rwanda 2014/15
Using the Scaling Up Nutrition Planning & Monitoring Tool
August 2015
Compressed versionof the slide deck
2. Rwanda
Stakeholder &
Action Mapping
2014-15 -
2
Disclaimer for the Stakeholder & Action Mapping
It is important to note what the Stakeholder & Action Mapping is, and what it is not.
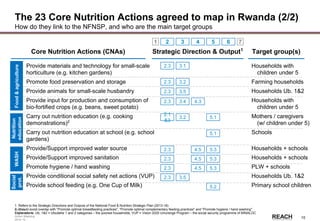
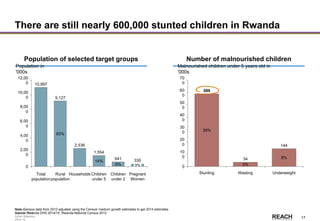
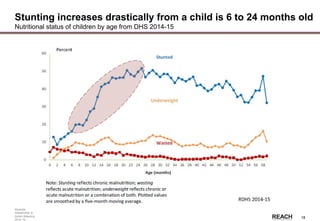
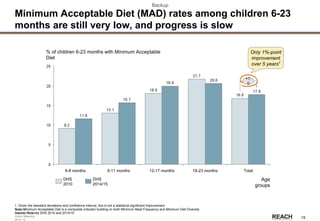
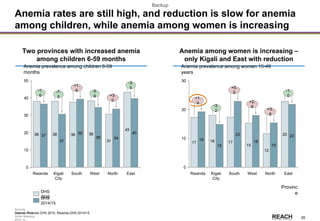
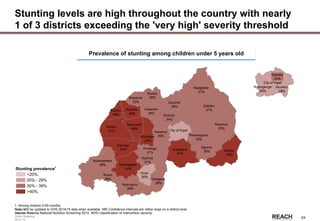
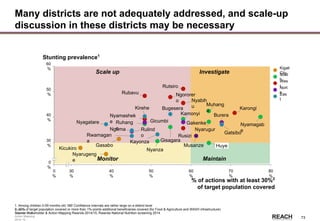
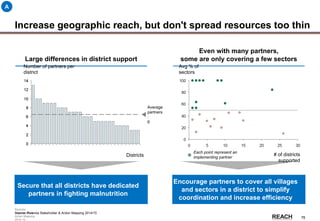
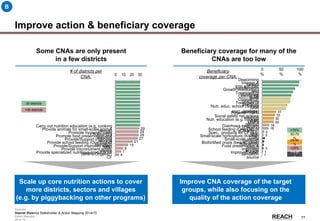
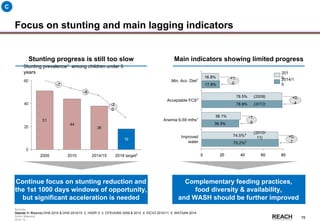
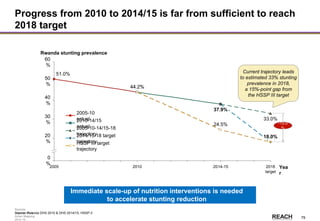
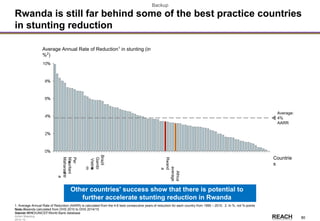
The Rwanda Stakeholder & Action Mapping intends to help improve nutrition coordination and scale-up
discussion by providing an indicative overview of who the key stakeholders in nutrition are, where they
are working, and an estimate of how many they are reaching, on a chosen few Core Nutrition Actions.
However, the Stakeholder & Action Mapping is not research or exact science. Both the geographical and
beneficiary coverage are estimates based only on the information provided by the organizations who have
reported. The coverage is therefore not to be considered as exhaustive or exact. Moreover, it is voluntary
to report, and not necessarily all stakeholders have been identified or have chosen to contribute.
Also, the Stakeholder & Action Mapping is only focusing on the chosen Core Nutrition Actions. Other
organizations may be working on other nutrition actions that have not been included. Furthermore, the
Stakeholder & Action Mapping is not assessing the quality or accuracy of the reported coverage.
The Stakeholder & Action Mapping only represents a snapshot of the situation in Rwanda. Partners,
projects, programs and funding change continuously, and thus also the support and coverage will
change. The coverage data is provided for 2014, i.e. the last full calendar year.
The Stakeholder & Action Mapping should thus only be interpreted as indicative and directional, and
should not be used for other purposes, nor should estimated coverage under any circumstance be used
or referred to as publicly approved or validated data.
IMPORTANT TO READ
3. Rwanda
Stakeholder &
Action Mapping
2014-15 -
3
Executive Summary for the Stakeholder & Action Mapping
Chronic malnutrition (stunting) is still a major public health concern in Rwanda
• Despite progress over the last decade, Rwanda is still in the high severity zone as defined by WHO
• Progress in stunting reduction is consistent, but slow compared to targets set by the Government of Rwanda
• On the positive side, the MDG targets for underweight reduction was achieved, and acute malnutrition
(wasting) is in low severity zones as defined by WHO
There are gaps both in geographical coverage and beneficiary coverage of the Core Nutrition Actions
(CNAs)
• There are many partners supporting the fight against malnutrition in Rwanda, including ministries, donors,
catalysts and field implementers. The scale and support varies across the different stakeholders
• The level of support and coverage of the CNAs also varies among different districts both in number of partners
supporting the district, the number of CNAs implemented, and the coverage of beneficiaries for these CNAs
Further scale-up is needed to accelerate the reduction of stunting in Rwanda
• Geographic coverage of the CNAs should be increased so that more CNAs are reaching all areas of Rwanda
• Beneficiary coverage of the CNAs should be improved so that more CNAs are reaching a higher proportion of
their target groups
• The quality of the coverage needs to be ensured, so that we are not only reaching more beneficiaries, but also
ensuring a level of quality that makes the interventions efficient and sustainable
All partners need to cooperate and contribute to further scale-up nutrition interventions in Rwanda
• The findings in the Stakeholder & Action Mapping can help inform such scale-up discussions
4. Rwanda
Stakeholder &
Action Mapping
2014-15 -
4
The Stakeholder & Action Mapping report is structured
according to the following topics and key questions
Introduction, background and objectives of the Stakeholder & Action Mapping
Recap of the food and nutrition situation in Rwanda – highlights from the Nutrition Analysis
• What is the food and nutrition situation nationally?
• What is the food and nutrition situation per district?
Stakeholder & Action Mapping methodology and approach
Stakeholder & Action Mapping overview and analyses
• Who are the main stakeholders working with nutrition in Rwanda?
• What are the main programs?
• What core nutrition actions are the stakeholders working on?
• Where are we working?
• How many are we reaching?
Implications of the findings from the Stakeholder & Action Mapping
• Where and what are the gaps?
• What recommendations for planning and scale up can be made?
Appendix
1
2
3
4
5
6
7
8
9
5. Rwanda
Stakeholder &
Action Mapping
2014-15 -
5
Agenda
Introduction, background and objectives of the Stakeholder & Action Mapping
Recap of the food and nutrition situation in Rwanda – highlights from the Nutrition Analysis
• What is the food and nutrition situation nationally?
• What is the food and nutrition situation per district?
Stakeholder & Action Mapping methodology and approach
Stakeholder & Action Mapping overview and analyses
• Who are the main stakeholders working in nutrition in Rwanda?
• What are the main programs?
• What core nutrition actions are the stakeholders working on?
• Where are they working?
• How many are they reaching?
Implications of the findings from the Stakeholder & Action Mapping
• Where and what are the gaps?
• Main recommendations and findings for scaling up
Appendix
6. Rwanda
Stakeholder &
Action Mapping
2014-15 -
6
Introduction to the Stakeholder & Action Mapping 2014/15
Objectives of Stakeholder & Action Mapping
• To decide on the prioritized core nutrition actions (CNAs) in Rwanda
• To get a better overview of who is doing what and where in nutrition in Rwanda
• To be better able to identify gaps in coverage of target population and geographies of core nutrition actions
• Ultimately to help inform & improve planning of core nutrition actions, to scale up and eliminate malnutrition
Background for Stakeholder & Action Mapping
• Request by the Social Cluster Ministries and the FNTWG to update the stakeholder mapping from 2012
• Redefining of previous mapping efforts to better understand the coverage of target populations and
geographic areas of CNAs (using updated and improved SUNPMT tool)
What data is collected, and how?
• The mapping exercise collects coverage data directly from key nutrition stakeholders
– Template input from stakeholders on which CNAs they are implementing or supporting and where
– Interview-based data collection for further details on CNAs (including beneficiary coverage)
• The data collected include the following: Organization and program contact details, actions / interventions
being conducted, target group(s), delivery mechanisms, period of program operation, geographic regions of
operation, number of beneficiaries reached
7. Rwanda
Stakeholder &
Action Mapping
2014-15 -
7
What can the Stakeholder & Action Mapping help you with?
For Ministries
Get a better overview
of who the partners are
and what they do
Identify potential gaps
in geographic coverage
Identify potential gaps
in action coverage
Help planning &
scale-up of nutrition
actions
For Districts
See what partners are
working with food &
nutrition in your district
Get info on what
actions are being
conducted, and where
How many people are
being reached by
different actions, what
needs to be scaled up
For UN & NGOs
Enhance coordination
though better info on
what organizations are
working in the same
districts and/or on the
same actions
Identify what districts
need further support
See what actions need
to be scaled up, and
where
For Donors
Identify what districts
need further support
See what actions need
more funds to scale up
Help identify what
organizations can
cover different actions
and districts
Improve coordination among partners, and help inform
planning and scale up of nutrition actions in Rwanda
8. Rwanda
Stakeholder &
Action Mapping
2014-15 -
8
Updating the Rwanda Stakeholder Mapping, using an
upgraded and more comprehensive M&E tool from REACH
2012: General overview of who does what
and where within nutrition in Rwanda
2015: Map coverage of core nutrition actions to
better inform nutrition planning and scale-up
9. Rwanda
Stakeholder &
Action Mapping
2014-15 -
9
The 23 Core Nutrition Actions agreed to map in Rwanda (1/2)
How do they link to the NFNSP, and who are the main target groups
Strategic Direction & Output1
1 2 3 4 5 6 7
Core Nutrition Actions (CNAs) Target group(s)
Promote optimal breastfeeding practices
Promote optimal complementary feeding
practices
Provide specialized nutritious products for
complementary feeding (e.g. CSB)
Provide Fe+FA supplements
Provide MNP supplements (Ongera)
Provide Vit A supplements
Provide deworming tablets
Provide diarrhoea treatment (w/ ORS/ORS-zinc)
Provide treatment of SAM
Provide & support treatment of MAM
Conduct child growth monitoring / screening
Promote/Provide ANC visits (4+)
2.1
&3
4.2
2.1
&3
4.23.5
5.34.32.3
4.32.3
5.34.32.3
5.34.32.3
4.12.1 6.2
2.1
&3
4.1 5.3
4.22.3
2.3
PLW & HHs w/ ch. u5
PLW & Households
w/ children under 5
6-23 months & PLW
in Ubudehe 1 & 2
Pregnant Women
6-23 months
6-59 months
12-59 mths & 5-15 yrs
u5 w/ severe diarrhoea
u5 with SAM
u5 with MAM
6-59 months
Pregnant Women
4.12.1 6.2
6.2
MIYCN
Micro-nutr
ients
Manage
disease
MAM/
SAM
MNCH
1. Refers to the Strategic Directions and Outputs of the National Food & Nutrition Strategic Plan (2013-18)
Explanations: PLW = Pregnant and Lactating Women, HHs = Households, PW = Pregnant Women, LW = Lactating Women, SAM = Severe Acute Malnutrition, MAM = Moderate Acute Malnutrition, u5
= children under 5 years, ANC = Ante-Natal Care, MNP = Micronutrient Powders, CSB = Corn Soya Blend, ORS = Oral Rehydration Salts/Solution, Fe+FA = Iron & Folic Acid supplements
3.5
10. Rwanda
Stakeholder &
Action Mapping
2014-15 -
10
Strategic Direction & Output1
The 23 Core Nutrition Actions agreed to map in Rwanda (2/2)
How do they link to the NFNSP, and who are the main target groups
1 2 3 4 5 6 7
Target group(s)
Provide materials and technology for small-scale
horticulture (e.g. kitchen gardens)
Promote food preservation and storage
Provide animals for small-scale husbandry
Provide input for production and consumption of
bio-fortified crops (e.g. beans, sweet potato)
Carry out nutrition education (e.g. cooking
demonstrations)2
Carry out nutrition education at school (e.g. school
gardens)
Provide/Support improved water source
Provide/Support improved sanitation
Promote hygiene / hand washing
Provide conditional social safety net actions (VUP)
Provide school feeding (e.g. One Cup of Milk)
2.1
&3
5.13.2
5.1
2.3 5.34.5
2.3 5.34.5
2.3 5.34.5
2.3 3.5
5.2
Households with
children under 5
Farming households
Households Ub. 1&2
Households with
children under 5
Mothers / caregivers
(w/ children under 5)
Schools
Households + schools
PLW + schools
Households Ub. 1&2
Primary school children
2.3 3.1
2.3 3.2
2.3 3.5
2.3 4.33.4
Food&agriculture
Nutrition
education
WASH
Social
prot.
Core Nutrition Actions (CNAs)
1. Refers to the Strategic Directions and Outputs of the National Food & Nutrition Strategic Plan (2013-18)
2. Should avoid overlap with "Promote optimal breastfeeding practices", "Promote optimal complementary feeding practices" and "Promote hygiene / hand washing"
Explanations: Ub. 1&2 = Ubudehe 1 and 2 categories – the poorest households, VUP = Vision 2020 Umurenge Program – the social security programme of MINALOC
11. Rwanda
Stakeholder &
Action Mapping
2014-15 -
11
Agenda
Introduction, background and objectives of the Stakeholder & Action Mapping
Recap of the food and nutrition situation in Rwanda – highlights from the Nutrition Analysis
• What is the food and nutrition situation nationally?
• What is the food and nutrition situation per district?
Stakeholder & Action Mapping methodology and approach
Stakeholder & Action Mapping overview and analyses
• Who are the main stakeholders working in nutrition in Rwanda?
• What are the main programs?
• What core nutrition actions are the stakeholders working on?
• Where are they working?
• How many are they reaching?
Implications of the findings from the Stakeholder & Action Mapping
• Where and what are the gaps?
• Main recommendations and findings for scaling up
Appendix
12. Rwanda
Stakeholder &
Action Mapping
2014-15 -
12
Agenda
Introduction, background and objectives of the Stakeholder & Action Mapping
Recap of the food and nutrition situation in Rwanda – highlights from the Nutrition Analysis
• What is the food and nutrition situation nationally?
• What is the food and nutrition situation per district?
Stakeholder & Action Mapping methodology and approach
Stakeholder & Action Mapping overview and analyses
• Who are the main stakeholders working in nutrition in Rwanda?
• What are the main programs?
• What core nutrition actions are the stakeholders working on?
• Where are they working?
• How many are they reaching?
Implications of the findings from the Stakeholder & Action Mapping
• Where and what are the gaps?
• Main recommendations and findings for scaling up
Appendix
13. Rwanda
Stakeholder &
Action Mapping
2014-15 -
13
Key messages on the nutrition situation in Rwanda
While there have been marked reductions in the prevalence of chronic malnutrition (stunting) over the last
decade, stunting in Rwanda still remains in high severity zone as a major public health concern1
• Nearly 600,000 children under 5 (38%) are chronically malnourished
• There is still a large gap to reach the targets set in the HSSP-3 and NFNSP (18% in 2018)
• Very high1
stunting levels (>40%) persist in 1 of 3 of the country’s districts, and only 3 districts are below 30%
• Further action and scale up is needed to address and accelerate the rate of reduction
Wasting (2.2%) is below the critical thresholds set by WHO (5%), but Severe Acute Malnutrition (0.6%) is
still a public health concern1
(>0.1%)
• Underweight targets as set in the Millennium Development Targets were reached (target 14.5%, now 9%
prevalence among under5s), but there is still a gap to the targets set in HSSP-3 and NFNSP (4% in 2018)
Anemia among children 6-59 months has decreased (down from 38.1% in 2010 to 36.5% in 2014/15), while
anemia among women 15-49 years has increased (17.3% in 2010 to 19.2% in 2014/15)
• Both are still far from normal levels1
(<5%), and anemia thus needs to be further addressed
Several core indicators to reduce stunting are showing slow progress, such as Food Consumption Scores,
Minimum Acceptable Diet and WASH indicators
• Indicates that further focus and scale up is needed
1. As defined by WHO
Source: DHS 2014/15, DHS 2010, HSSP-3, NFNSP
14. Rwanda
Stakeholder &
Action Mapping
2014-15 -
14
Situation Analysis Dashboard (National Level)
What is the nutrition situation stakeholders need to address?
Iron deficiency
Underweight
Stunting
Care
Wasting
Food security
Underweight prevalence among children 0-59 mo. old
Stunting prevalence among children 0-59 mo. old
Anemia among women 15-49 yrs old (any anemia)
Indicator Status
SAM prevalence among children 0-59 mo. old
GAM prevalence among children 0-59 mo. old
Population living under national poverty line
Population living in extreme poverty (national line)
Total fertility rate
Percentage with unmet need for family planning
Gender
Poverty
Nutritional
impact
37.9%
2.2%
0.6%
9.3%
19.2%
Underlying
causes
Households with poor & borderline food cons. score
Global Hunger Index rating
21.1%
15.6
Population
Children 6-23 mo. old with min acceptable diet (MAD) 17.8%
Education
Basic
causes
Teenage pregnancy: women 15-19 with a live birth
Women who participate in major household decisions
Global Gender Gap ranking
44.9%
24.1%
5.5%
Xx.x%
7 / 142
4.2
18.9%
Females that completed primary school or higher
Literacy rate 15 years or more - Women
Xx.x%
64.7%
44.2% (2010)
2.8% (2010)
0.8% (2010)
11.4% (2010)
17.3% (2010)
21.5% (2009)
24.1 (2005)
16.8% (2010)
56.7% (2005/06)
35.8% (2005/06)
4.7% (2010)
58.7% (2010)
N/A
4.6 (2010)
18.9% (2010)
30.1% (2010)
60.1% (2005/06)
Severity
N/A
N/A
N/A
N/A
N/A
N/A
N/A
N/A
N/A
N/A
N/A
Source
DHS
DHS
DHS
DHS
DHS
DHS
EICV
EICV
DHS
DHS
GGGI
DHS
DHS
DHS
EICV
CFSVA
GHI
Year
2014/15
2014/15
2014/15
2014/15
2014/15
Health &
Sanitation
Under 5 mortality rate (deaths per 1,000 live births)
Low birthweight prevalence (<2,500g)
Women 15-49yrs with problems accessing health care
Household access to improved water source
Household access to improved sanitation facilities
50
X.x%
Xx.x%
74.2%
74.5%
76 (2010)
6.2% (2010)
61.4% (2010)
70.2% (2005/06)
58.5% (2005/06)
N/A
N/A
N/A
DHS
DHS
DHS
EICV
EICV
2014/15
2014/15
2014/15
2010/11
2010/11
2014/15
2010/11
2010/11
2014/15
2014/15
2014
2014/15
2014/15
2014/15
2010/11
2012
2014
Infants 0–5 mo. exclusively breastfed
Timely initiation of solid or semi-solid foods (6-8 mo)
87.3%
55.8%
84.9% (2010)
62.1% (2010)
N/A
N/A
DHS
DHS
2014/15
2014/15
Anemia among children 6-59 mo. old (any anemia) 36.5% 38.1% (2010)DHS 2014/15
Trend
Low
Medium
High
Severity:
Improvement (blue arrow)
No change (yellow arrow)
Worsening (red arrow)
Trend:
Households with handwashing facility, soap & water Xx.x% 2.1% (2010)N/ADHS 2014/15
Vit A deficiency Vitamin A deficiency among children 0-59 mo. old N/A 6.4% (1996)N/A N/A
Iodine deficiency Iodine deficiency among children 6-12 years old N/A N/AN/AN/A N/A
Note: Missing information to be updated as soon as the full Rwanda DHS 2014/15 is released
15. Rwanda
Stakeholder &
Action Mapping
2014-15 -
15
Significant reductions in stunting, wasting and underweight
Stunting remains a public health concern, while wasting & underweight are below critical thresholds
Stunting Wasting Underweight
Prevalence among children under
5
2005 2010
DH
S
20001992 2014/15
WHO
severity
threshol
d
20051992 2010
WHO
severity
threshol
d
2014/152000
DH
S
Prevalence among children under
5
2000 2005 20101992 2014/15
WHO
severity
threshol
d
DH
S
Prevalence among children under
5
Note: Prevalence for 1992. 2000 and 2005 have been recalculated using 2006 WHO growth standards
Source: Rwanda DHS, WHO classification of malnutrition severity
16. Rwanda
Stakeholder &
Action Mapping
2014-15 -
16
While MDG target is achieved, only wasting seems to be on
track to meet 2018 targets set in the HSSP III and the NFNSP
Stunting Wasting Underweight
Prevalence among children under
5
2005 2010
DH
S
20001992 2014/15
2018
Target
HSSP
3
18%
20051992 2010
2018
Target
HSSP
3
2%
2014/152000
DH
S
Prevalence among children under
5
2000 2005 20101992 2014/15
2018
Target
HSSP
3
4%
DH
S
Prevalence among children under
5
Note: Prevalence for 1992. 2000 and 2005 have been recalculated using 2006 WHO growth standards. HSSP3 = Health Sector Strategic Plan 3 from 2013-2018
Source: Rwanda DHS, WHO classification of malnutrition severity
Backup
MDG
target
14.5
%
17. Rwanda
Stakeholder &
Action Mapping
2014-15 -
17
There are still nearly 600,000 stunted children in Rwanda
Population of selected target groups Number of malnourished children
Note: Census data from 2012 adjusted using the Census' medium growth estimates to get 2014 estimates
Source: Rwanda DHS 2014/15, Rwanda National Census 2012
6,00
0
10,00
0
4,00
0
2,00
0
12,00
0
8,00
0
0
641
9,127
10,997
2,536
1,554
Rural
population
33014%
83%
6%
Pregnant
Women
Children
under 2
Households
3%
Children
under 5
Population in
'000s
Total
population
70
0
60
0
0
40
0
50
0
20
0
30
0
10
0
Malnourished children under 5 years old in
'000s
38%
34
UnderweightWasting
144
Stunting
9%
2%
589
19. Rwanda
Stakeholder &
Action Mapping
2014-15 -
19
Minimum Acceptable Diet (MAD) rates among children 6-23
months are still very low, and progress is slow
Backup
1. Given the standard deviations and confidence interval, this is not a statistical significant improvement
Note: Minimum Acceptable Diet is a composite indicator building on both Minimum Meal Frequency and Minimum Diet Diversity
Source: Rwanda DHS 2010 and 2014/15
18-23 months Total
+1.
0
% of children 6-23 months with Minimum Acceptable
Diet
9-11 months 12-17 months6-8 months
Age
groups
DHS
2010
DHS
2014/15
Only 1%-point
improvement
over 5 years1
20. Rwanda
Stakeholder &
Action Mapping
2014-15 -
20
Anemia rates are still high, and reduction is slow for anemia
among children, while anemia among women is increasing
Two provinces with increased anemia
among children 6-59 months
Anemia among women is increasing –
only Kigali and East with reduction
+1.
8
-3.
5
+3.
0
-7.
5
-3.
9
Anemia prevalence among children 6-59
months
West
-1.
6
Kigali
City
South North EastRwanda
DHS
2014/15
DHS
2010
Provinc
e
North
+3.
8
EastSouth West
+1.
9
-1.
0
Kigali
City
-3.
2
+5.
5
+2.
6
Rwanda
Anemia prevalence among women 15-49
years
Backup
Source: Rwanda DHS 2010, Rwanda DHS 2014/15
21. Rwanda
Stakeholder &
Action Mapping
2014-15 -
21
Food security as measured with acceptable Food
Consumption Score is improving, but slowly
Backup
-0.4
%
3.8%
% of
population
+0.4
%
Acceptable FCS Poor FCSBorderline FCS
201
2
200
9
1. Given the standard deviations and confidence interval, this is not a statistical significant improvement
Note: CFSVA/NS data from 2015 will be added when available
Source: Rwanda CFSVA/NS 2012
Only 0.4%-point
improvement
over 5 years1
22. Rwanda
Stakeholder &
Action Mapping
2014-15 -
22
WASH related indicators are at a low level, and improvement
is limited and behind targets
2017/18
Target
EDPRS2
WATSAN
2014
2010/11
EICV3
25
%
Households with access to
improved water source
Still large gap to reach targets
for access to improved water
Less than half of households
are using appropriate water
treatment methods
Only 2% have a handwashing
facility with soap & water
Households using an appropriate
water treatment method
N/A
DHS 2014/15DHS 2010
10%
Hand
washing
facility
No
water
or
soap
Households with place for
washing hands
Soap
only
0%
Water
& soap
Water
only
Backup
Note: DHS 2014/15 data will be added when available
Source: EICV3, WATSAN 2014, EDPRS2, DHS 2010
23. Rwanda
Stakeholder &
Action Mapping
2014-15 -
23
Agenda
Introduction, background and objectives of the Stakeholder & Action Mapping
Recap of the food and nutrition situation in Rwanda – highlights from the Nutrition Analysis
• What is the food and nutrition situation nationally?
• What is the food and nutrition situation per district?
Stakeholder & Action Mapping methodology and approach
Stakeholder & Action Mapping overview and analyses
• Who are the main stakeholders working in nutrition in Rwanda?
• What are the main programs?
• What core nutrition actions are the stakeholders working on?
• Where are they working?
• How many are they reaching?
Implications of the findings from the Stakeholder & Action Mapping
• Where and what are the gaps?
• Main recommendations and findings for scaling up
Appendix
24. Rwanda
Stakeholder &
Action Mapping
2014-15 -
24
Stunting levels are high throughout the country with nearly
1 of 3 districts exceeding the 'very high' severity threshold
1. Among children 0-59 months
Note: Will be updated to DHS 2014/15 data when available. NB! Confidence intervals are rather large on a district level
Source: Rwanda National Nutrition Screening 2014, WHO classification of malnutrition severity
Prevalence of stunting among children under 5 years old
Nyagatare
37%
Gatsibo
37%
Kayonza
33%
Karongi
42% Bugesera
41%
Rusizi
36%
Nyamasheke
39%
Kirehe
40%
Ngoma
35%
Rwamagana
33%
Nyaruguru
38%
Nyamagabe
40%
Rulindo
34%
Gicumbi
38%
Huye
30%
Nyanza
31%
Musanze
33%
Burera
38%
Gakenke
38%
Ngororero
48%
Nyabihu
46%
Ruhango
37%
Muhanga
43%
Kamonyi
39%
Gisagara
36%
Rubavu
48%
City of Kigali
Rutsiro
51%
City of Kigali
Kicukiro
28%
Gasabo
32%
Nyarugenge
26%
20% - 29%
30% - 39%
>40%
Stunting prevalence1
<20%
25. Rwanda
Stakeholder &
Action Mapping
2014-15 -
25
Vast regional disparities in
anemia levels, spanning nearly
30 point range (52.7% to 23.0%)
40% of the districts in Rwanda
had anemia levels above
(≥40%) in 2010 (12 out of 30
districts)
The urban district of Kicukiro
is above (≥ 40%) , which shows
that anemia is also a latent
urban problem.
The most alarming districts with ≥
45% of children with anemia are:
Rusizi, Nyamagabe, Gatsibo,
Ngoma, Kirehe, Gisagara and
Nyamasheke
Anemia is a critical public health concern, with 40% of the
districts in Rwanda with anemia levels above (≥ 40%)
Backup
Note: Will be updated to DHS 2014/15 data when available NB! Confidence intervals are rather large on a district level
Source: Rwanda DHS 2010, Rwanda Nutrition Situation Analysis
26. Rwanda
Stakeholder &
Action Mapping
2014-15 -
26
Districts with different level of development on key indicators
Ranked by weighted development score (constructed composite index)
<30 30-40 >40
Weighted development
score:
Note: Weighted development score is a composite indicator that consists of stunting prevalence, poverty rates, food security scores, minimum acceptable diet, improved water & improved sanitation.
The chosen weights are shown on top. All indicators are adjusted so that lower is better.
Source: DHS 2010, EICV3 2010-11, CFSVA/NS 2012, National Screening 2014
27. Rwanda
Stakeholder &
Action Mapping
2014-15 -
27
Nyagatare
Gatsibo
Kayonza
Karongi
Bugesera
Rusizi
Nyamasheke
Kirehe
Ngoma
Rwamagana
Nyaruguru
Nyamagabe
Rulindo
Gicumbi
Huye
Nyanza
Musanze
Burera
Gakenke
Ngororero
Nyabihu
Ruhango
Muhanga
Kamonyi
Gisagara
Rubavu
City of Kigali
Rutsiro
Districts in South and West are the least developed
City of Kigali
Kicukiro
Gasabo
Nyarugenge
<30 30-40 >40
Weighted development
score:
Note: Weighted development score is a composite indicator that consists of stunting prevalence, poverty rates, food security scores, minimum acceptable diet, improved water & improved sanitation.
The weighted development score is indicative only, and should not be used for other purposes.
Source: DHS 2010, EICV3 2010-11, CFSVA/NS 2012, National Screening 2014 NB! Confidence intervals are rather large on a district level
Weighted development score per district
28. Rwanda
Stakeholder &
Action Mapping
2014-15 -
28
Agenda
Introduction, background and objectives of the Stakeholder & Action Mapping
Recap of the food and nutrition situation in Rwanda – highlights from the Nutrition Analysis
• What is the food and nutrition situation nationally?
• What is the food and nutrition situation per district?
Stakeholder & Action Mapping methodology and approach
Stakeholder & Action Mapping overview and analyses
• Who are the main stakeholders working in nutrition in Rwanda?
• What are the main programs?
• What core nutrition actions are the stakeholders working on?
• Where are they working?
• How many are they reaching?
Implications of the findings from the Stakeholder & Action Mapping
• Where and what are the gaps?
• Main recommendations and findings for scaling up
Appendix
29. Rwanda
Stakeholder &
Action Mapping
2014-15 -
29
High-level approach for the Stakeholder & Action Mapping
Time
estimate
Activities
Preparation
1-3 months2
• Introducing the
tool & approach
• Discussing and
deciding on the
Core Nutrition
Actions (CNAs1
)
• Preparing
templates &
letters
Data collection
2-4 months3
Quantitative
analysis
~1+ month
Data
interpretation
~1+
month
Mapping
process
Note: The Stakeholder & Action Mapping can be conducted quicker than the timeline above now that it has already been conducted and the tool and templates have been developed and customized
for Rwanda. Also, the timeline has been stretched due to multiple parallel priorities (one resource working ~30% on the Stakeholder & Action Mapping, not 100%)
1. CNA = Core Nutrition Actions 2. Depending on time to get agreement and sign-off on CNAs and Rwanda specifics in tool 3. Depending on number of districts mapped, the number of participating
organizations, the data availability and the time and resources committed to data collection
Datadissemination
Stakeholderdialogueonscalingupnutrition
• Templates &
letters sent out
• Templates filled in
and returned by
stakeholders
• Beneficiary
coverage
meetings set up
and conducted
• Clean and quality
check data
• Remove potential
duplicates
• Add situation
indicators (DHS)
• Analyze data and
make analysis
output
• Interpret coverage
data with situation
indicators
• Identify potential
coverage gaps
• Make
recommendations
• Compile report /
presentation
Jan-Mar Apr-Jul Aug Sep
Iteration
30. Rwanda
Stakeholder &
Action Mapping
2014-15 -
30
The preparation phase consisted of three main deliverables
Customizing tool to country specifics must be conducted and agreed before starting data collection
Country specifics to
customize tool
Rwanda nutrition
stakeholder overview
External data input for
population & indicatorsA B C
Geography
Geography of mapping exercise
A1
Core nutrition actions
E.g. exclusive breastfeeding,
biofortification, ...
A2
Delivery mechanisms
E.g. health centers, radio, ...
A3
Target groups
E.g. pregnant & lactating women,
households, ...
A4
Combine / Link
Relevant target groups, del.
mech. & indicators per action
A6
Situation indicators
E.g. wasting, anemia, ...
A5
Long-list of all stakeholders
• Who they are, where they
work, what they work on
• Contact details
Draft stakeholder profile for
the key stakeholders:
B1
B2
Population data
• Per district
• Per target group
Data on situation indicators
per district
• Wasting, stunting, etc.
C1
C2
For each year and
geography mapped, what
is the population size of
each target group?
For each year and
geography mapped, what
are the situation indicator
levels?
Preparation
phase
31. Rwanda
Stakeholder &
Action Mapping
2014-15 -
31
Population data was mainly collected from the 2012 Census
Preparation
phase
C
1
Target group
Population groups
• Entire population
• Children 6-23 months
• Children 0-59 months (u5)
• Children 6-59 months
• Children 12-59 months
• Children 5-15 years
• Pregnant women (PW)
• Lactating women (LW)
Households
• Households
• Households with children u5
(Mothers/Caregivers w/ ch. u5)
• Farming households
• Households Ubudehe 1&2
Schools
• Schools
• School children
• Primary schools
• Primary school children
Children with illness
• Children u5 with SAM
• Children u5 with MAM
• Children u5 with severe diarrhea
Sources
Rwanda Population and
Household Census, 2012, NISR
• Population by district
• Population by single age and
sex
• Population growth projections
(medium growth)
Rwanda Population and
Household Census, 2012, NISR
• EICV 3, Thematic Report
Agriculture, 2012, NISR
• MINALOC Ubudehe cat. 2014
Rwanda Education statistics,
MINEDUC 2013/14
• School overview MINEDUC
• Education statistics for 2013
DHS & National Screening data
• MAM & SAM prevalence from
DHS 14/15 & Nat. Nutr. Scr.
• Severe diarrhea from DHS
Methodology
Using population data by district, by
single age and by sex
• Adjusting 2012 figures to 2014 figures by
using medium growth projections in the
Census
• PW in 2014 estimated by the number of
children 0 to 1 year in 2015 (estimate)
• LW estimated by the number of children
0-23 months in 2014
Same as above, but with additional data
• Dividing u5 with 1.5 (based on average
birth spacing) to get HHs with childr. U5
• % farming households from EICV3
• % of HHs in U1&2 from MINALOC data
Using Rwanda Education statistics
• MINEDUC provided number of schools
• Number of school children from statistics
• Schools split by type of school
• School children split by type of school
Multiplying prevalence by age group
• Children u5 multiplied by prevalence of
MAM and SAM (from DHS14/15 & NNS)
• U5 multiplied by severe diarrhea prev.
Note: Target group size in SUNPMT may not match with target group sizes used by other organizations if sources and way of estimating differs
32. Rwanda
Stakeholder &
Action Mapping
2014-15 -
32
Data collection was conducted in two steps
Who is doing what and where Coverage for 23 core nutrition actions1 2
Mapping of nutrition stakeholders in
Rwanda – who is doing what and whereObjective
Mapping beneficiary coverage for 23 selected
core nutrition actions
What to
map
Long-list of nutrition stakeholders and their
contribution to the core nutrition actions
• Indicate which of the core nutrition actions
are they working with
• Report their organization role and their
partners for each of the actions
• Report what districts and sectors they are
supporting for each of the actions
Map action coverage for the 23 core nutrition
actions (CNAs)
• How many of the target groups are we covering
for each action, in each district?
• Focus on mapping beneficiaries coverage
• Also get information on project duration,
donors, implementing partners and delivery
mechanism
Data
collection
method
Self-reporting by the stakeholders
• Template was sent out, filled and returned
• Acted as information input for step 2
Collect coverage data using SUNPMT tool
• Interview based data collection
• Careful preparation from stakeholders
Who to
collect
data from
Template sent out to all known nutrition
stakeholders in Rwanda
Selected stakeholders working with the core
nutrition actions (informed by step 1)
Qualitative view Quantitative view
Data
collection
33. Rwanda
Stakeholder &
Action Mapping
2014-15 -
33
Some of the coverage data is provided directly by ministries
Data
collection Backup
Data collection sourceCore nutrition actions
Promote optimal breastfeeding practices
Promote optimal complementary feeding practices
Provide specialized nutritious products for complementary feeding
Provide Fe+FA supplements
Provide MNP supplements
Provide Vit A supplements
Provide deworming tablets
Provide diarrhoea treatment (w/ ORS/ORS-zinc)
Provide treatment of SAM
Support and provide treatment of MAM
Conduct child growth monitoring / screening
Promote/Provide ANC visits (4+)
Provide materials and technology for small-scale horticulture
(Kitchen gardens)
Promote food preservation and storage
Provide animals for small-scale husbandry
Provide input for production and consumption of biofortified crops
(e.g. beans, sweet potato)
Carry out nutrition education (e.g. cooking demonstrations)
Carry out nutrition education at school (school gardens)
Provide/Support improved water source
Provide/Support improved sanitation
Promote hygiene / hand washing
Provide conditional social safety net actions (VUP)
Provide school feeding (One Cup of Milk)
MoH (and partners)
MoH (and partners)
Implementing Partners
MoH
Implementing Partners
MoH
MoH
MoH
MoH
MoH (and partners)
MoH
MoH
Implementing partners
MINAGRI (and partners)
Implementing partners
MINAGRI (and partners)
Implementing partners
MINEDUC
Implementing partners
MINALOC
MINAGRI (and partners)
MIYCN
Micro-nu
trients
Di-se
ase
MAM/
SAM
MCH
Food&
Agriculture
Nut.
Edu.
WASH
Soc.
Sec.
Comments
Split in two target groups
From campaign data
From campaign data
Health facilities treatment data
Other partners also supporting
Other partners also doing promoting
No data available from MINAGRI
Other partners also doing SILC
34. Rwanda
Stakeholder &
Action Mapping
2014-15 -
34
How is the population coverage calculated by the tool?
To have consistent results, it is important to consistently
map the actions at the same geographic level
Number of beneficiaries in the
target group covered by the
action, in the selected
geography
Population size of the target
group, in the selected
geography
Interview
database
Popula-tio
n
Two sources are used as input for the
population coverage calculation Concrete example
Provide vitamin A supplements to children
6-59 months in Gasabo, in 2014
Sum of all beneficiaries covered per action where
• Country = Rwanda
• Province = Kigali City
• District level = Gasabo
• Action = Provide vitamin A supplements
• Target group: Children 6-59 months
• At least 1 month of 2014 is included in timeframe
Population size where
• Country = Rwanda
• Province = Kigali City
• District = Gasabo
• Target group: Children 6-59 months
Quantitative
analysis
35. Rwanda
Stakeholder &
Action Mapping
2014-15 -
35
Important limitations to note on Stakeholder & Action Mapping
Not all nutrition
stakeholders have
participated in the
mapping
Stakeholder & Action Mapping does not cover all organizations working with nutrition in Rwanda
• Focus has been on capturing data from the largest stakeholders, not all stakeholders
• We have sent requests to all known stakeholders, but there may be other organizations that we do not
yet know about that have not been reached out to
• It is voluntary to provide input on the mapping, and some stakeholders have chosen not to participate
Not all
stakeholders have
good data or data
at all
Even for the stakeholders who have participated, there is sometimes limitation in data availability
• Not all stakeholders have collected coverage data for their programs and projects (this is for example
a problem for some of the ministries, e.g. MIGEPROF)
• Some have collected the data, but the data quality is not good enough
• Some organizations are very large and are doing many programs and projects. There may then be
nutrition activities conducted that they have not reported
Missing input
from most WASH
stakeholders
There has been limited participation from WASH stakeholders in the Stakeholder & Action Mapping
• WASH is very important for stunting reduction, and three of the CNAs are related to WASH
• However, WASH is coordinated in separate technical working groups, and have less interaction with
the Food & Nutrition Technical Working Groups than what would be ideal
• The mapping request was therefore also shared with the WASH TWGs, but very few stakeholders
participated in the mapping, meaning that there are large gaps in the completeness of WASH actions
We do not know
the quality of the
coverage or
actions conducted
When providing data of the number of beneficiaries reached with different actions, we do not
necessarily know the quality of these actions
• For example, if one partner have done one large meeting with 500 participants, the quality of the
sensitization may not be as good as if one organization is following 500 beneficiaries individually
• Or for kitchen gardens, the quality and how functional the kitchen garden is may differ
• Coverage is still counted equally, though the quality of the coverage may differ
Data
interpretat.
Note: See also Disclaimer slide
36. Rwanda
Stakeholder &
Action Mapping
2014-15 -
36
Agenda
Introduction, background and objectives of the Stakeholder & Action Mapping
Recap of the food and nutrition situation in Rwanda – highlights from the Nutrition Analysis
• What is the food and nutrition situation nationally?
• What is the food and nutrition situation per district?
Stakeholder & Action Mapping methodology and approach
Stakeholder & Action Mapping overview and analyses
• Who are the main stakeholders working in nutrition in Rwanda?
• What are the main programs?
• What core nutrition actions are the stakeholders working on?
• Where are they working?
• How many are they reaching?
Implications of the findings from the Stakeholder & Action Mapping
• Where and what are the gaps?
• Main recommendations and findings for scaling up
Appendix
37. Rwanda
Stakeholder &
Action Mapping
2014-15 -
37
Agenda
Introduction, background and objectives of the Stakeholder & Action Mapping
Recap of the food and nutrition situation in Rwanda – highlights from the Nutrition Analysis
• What is the food and nutrition situation nationally?
• What is the food and nutrition situation per district?
Stakeholder & Action Mapping methodology and approach
Stakeholder & Action Mapping overview and analyses
• Who are the main stakeholders working in nutrition in Rwanda?
• What are the main programs?
• What core nutrition actions are the stakeholders working on?
• Where are they working?
• How many are they reaching?
Implications of the findings from the Stakeholder & Action Mapping
• Where and what are the gaps?
• Main recommendations and findings for scaling up
Appendix
38. Rwanda
Stakeholder &
Action Mapping
2014-15 -
38
37 food & nutrition stakeholders have provided mapping input
Stakeholder profiles have been made for these organizations
Government
UN Agencies
Research /
Academia2
NGOs
• Ministry of Agriculture and Animal
Resources (MINAGRI)
• Ministry of Education (MINEDUC)
• Ministry of Gender and Family
Promotion (MIGEPROF)
• Ministry of Health (MoH)
• Ministry of Local Government
(MINALOC)
• Food & Agriculture Organization (FAO)
• One UN REACH
• International Fund for Agricultural
Development (IFAD)1
• United Nations Children's Fund
(UNICEF)
• World Food Programme (WFP)
• World Health Organization (WHO)
• World Bank1
• Catholic University of Rwanda (CUR)
• International Center for Tropical
Agriculture (CIAT)2
• University of British Columbia (UBC)
• The Access Project (AP)
• Adventist Development and Relief
Agency (ADRA)
• AVSI Foundation RWANDA (AVSI)
• Caritas International Rwanda (Caritas)
• Catholic Relief Services (CRS)
• Clinton Health Access Initiative (CHAI)
• Concern Worldwide Rwanda (CWR)
• Cooperative for Assistance and Relief
Everywhere (CARE)
• Family Health International 360
(FHI360)
• Gardens for Health International (GHI)
• Global Communities (GC)
• Glocal Forum YaLa Africa (GFYA)
• Heifer International Rwanda (HIR)
• International Rescue Committee (IRC)
• Partners In Health (PIH)
• Peace Corps Rwanda (PCR)3
• Rwanda Nutrition Society (RNS)2
• Send a Cow Rwanda (SaCR)
• Society for Family Health (SFH)
• WaterAid Rwanda (WaterAid)
• World Relief Rwanda (WRR)
• World Vision Rwanda (WVR)
1. IFAD and the World Bank have provided input on some of their nutrition sensitive programs, but not directly on the core nutrition actions 2. CIAT and RNS have provided input on research support,
but not directly on the core nutrition actions 3. Peace Corps is a new partner and the Peace Corps Volunteers will start working with food & nutrition from August 2015
39. Rwanda
Stakeholder &
Action Mapping
2014-15 -
39
An additional 40+ food & nutrition stakeholders have been
mentioned in the mapping by other partners
Government
Bi-/Multilateral
• Canadian Department of Foreign Affairs,
Trade and Development (DFATD)
• Canadian Food Grain Bank (CFGB)
• Embassy of the Kingdom of Netherlands
(EKN) / Government of Netherlands
• European Union (EU)
• Irish Aid (Irish DFAT)
• Korea International Cooperation Agency
(KOICA)
• Swiss Agency for Development and
Cooperation (SDC)
• UK Department for International
Development (DFID) / UK AID
• United States Agency for International
Development (USAID)
• Ministry of Disaster Management and
Refugee Affairs (MIDIMAR)
• Rwanda Agricultural Board (RAB)
• Rwanda Education Board (REB)
• Rwanda Biomedical Center (RBC)
• Local Administrative Entities
Development Agency (LODA)
• National Women Council (NWC)
• Districts
• Health Facilities
• Schools
NGOs &
Foundations
Field implementers:
• ADEPR
• African Evangelist Enterprice (AEE)
• Association for Humanitarian Peace (APH)
• Association Rwandaise pour la Promotion
du Development Integre (ARDI)
• Benishyaka Association
• Caritas Kabgayi & Gikongoro
• COFORWA (Compagnons Fontainiers du
Rwanda)
• Farming cooperatives
• DUHAMIC ADRI
• Eglise Presbytérienne au Rwanda (EPR)
• Mouvement de Lutte contre la Faim au
Monde (MLFM)
• Rwanda Rural Rehabilitation Initiative
(RWARRI)
• Save the Children Rwanda (StC)
• SDA Iriba
Donor organizations:
• CIFF – Children's Investment Fund Found.,
Global Giving, Oxfam, Gates Foundation,
Keurig Green Mountain (KGM), Fondation
d'Harcourt, CASASCHI, FONERWA, SUN
Multi-Partner Trust Fund, Starbucks, African
Development Bank (AfDB)
40. Rwanda
Stakeholder &
Action Mapping
2014-15 -
40
Agenda
Introduction, background and objectives of the Stakeholder & Action Mapping
Recap of the food and nutrition situation in Rwanda – highlights from the Nutrition Analysis
• What is the food and nutrition situation nationally?
• What is the food and nutrition situation per district?
Stakeholder & Action Mapping methodology and approach
Stakeholder & Action Mapping overview and analyses
• Who are the main stakeholders working in nutrition in Rwanda?
• What are the main programs?
• What core nutrition actions are the stakeholders working on?
• Where are they working?
• How many are they reaching?
Implications of the findings from the Stakeholder & Action Mapping
• Where and what are the gaps?
• Main recommendations and findings for scaling up
Appendix
41. Rwanda
Stakeholder &
Action Mapping
2014-15 -
41
Overview of large nutrition specific and sensitive programs
Key programs being implemented in country – see more details in next slides
Nutrition specific
programs
EKN/GoN Nutrition Program
• Lead by UNICEF
• 18 districts (all sectors)
• 2014-17
One UN Joint Nutrition Program
• Lead by WFP
• 2 districts (all sectors)
• 2013-16
CIFF Food & Nutrition Program
• Lead by MoH & MINAGRI
• 4 districts (all sectors)
• 2015-18
USAID INWA Program
• Lead to be decided
• 8 districts (all sectors)
• 2016-20
EU Nutrition Budget Support
• Direct budget support to MoH,
MINAGRI and MINEDUC
• 2013-16
Will in 2016 cover all 30 districts
Programs with food &
nutrition component
USAID Gimbuka Program
• Lead by Caritas
• 9 districts (21 sectors)
• 2012-15
USAID Ejo Heza Program
• Lead by Global Communities
• 8 districts (all sectors)
• 2011-16
USAID Higa Ubeho Program
• Lead by Global Communities
• 10 districts (89 sectors)
• 2009-15
USAID Twiyubake Program
• Lead by Global Communities
• 4 districts (all sectors)
• 2015-20
Nutrition sensitive
agriculture program
USAID Shisha Wumwa Program
• Lead by Land O'Lakes
• 2012-16
Land, Water, Hillside (LWH) program
• Funded by WB, IDA, CIDA, US, ++
• 2010-17
Rural Sector Support Program
• Funded by World Bank
• 2001-16
Post-harvest & Agribusiness
Support Project
• Funded by IFAD
• 2014-19
Rural Income through Exports
• Funded by IFAD
• 2011-18
Kirehe Watershed Mgmt Project
• Funded by IFAD
• 2009-16
A B C
A
1
A
2
A
3
A
4
A
5
B
1
B
2
B
3
B
4
C
1
C
2
C
3
C
4
C
5
C
6
Note: Overview is not exhaustive
Source: Stakeholder interviews
42. Rwanda
Stakeholder &
Action Mapping
2014-15 -
42
Nutrition specific programs will in 2016 cover all districts
But from 2017, many districts will be without funding support unless funding is extended
Province District Organization Donor(s) Implementing partner 2014 2015 2016 2017 2018 2019 2020
Kigali City
Nyarugenge USAID USAID TBD (INGO)
Gasabo UNICEF GoN, USAID, IKEA WRR (from 2015)
Kicukiro USAID USAID TBD (INGO)
South
Nyanza USAID USAID FXB
Gisagara UNICEF EKN CWR (ARDI)
Nyaruguru UNICEF EKN CWR (ARDI)
Huye CIFF CIFF MoH & MINAGRI
Nyamagabe UNICEF EKN, SDC (One UN) WRR, WVR
Ruhango USAID USAID Caritas
Muhanga UNICEF EKN CRS (Caritas Kabgayi)
Kamonyi UNICEF EKN ADRA
West
Karongi UNICEF EKN CRS (EPR)
Rutsiro UNICEF EKN, SDC (One UN) WRR, WVR, Caritas
Rubavu UNICEF GoN, USAID AP
Nyabihu USAID USAID TBD (INGO)
Ngororero CIFF CIFF MoH & MINAGRI
Rusizi UNICEF GoN WRR (from 2015)
Nyamasheke UNICEF EKN, IKEA WVR
North
Rulindo CIFF CIFF MoH & MINAGRI
Gakenke UNICEF GoN, USAID, IKEA AP
Musanze UNICEF GoN, USAID AP
Burera UNICEF GoN Dir. district support
Gicumbi UNICEF EKN, IKEA WVR
East
Rwamagana USAID USAID AEE
Nyagatare CIFF CIFF MoH & MINAGRI
Gatsibo UNICEF EKN ADRA
Kayonza USAID USAID TBD (INGO)
Kirehe UNICEF GoN Dir. district support
Ngoma USAID USAID TBD (INGO)
Bugesera UNICEF GoN, USAID AP
Note: Timeline showing approximate start and end dates with current funding Source: Stakeholder interviews
43. Rwanda
Stakeholder &
Action Mapping
2014-15 -
43
Other partners and programs are also present in the districts
Province District Organization Donor(s) Implementing partn. Other stakeholders working in district1
Kigali City
Nyarugenge USAID USAID TBD (INGO) GFYA (FAO, GG)
Gasabo UNICEF GoN, USAID, IKEA WRR (from 2015) GFH (GHI), GFYA (FAO, GG), SFH (USAID), WVR (WVI), GC (USAID/HU closed 2015, T from 2015)
Kicukiro USAID USAID TBD (INGO) GFYA (FAO, GG), SFH (USAID/EH), WVR (WVI)
South
Nyanza USAID USAID FXB SFH (USAID), GC (USAID/EH), AVSI (3x), SaCR (Oxfam,SaC,DFID GPAF)
Gisagara UNICEF EKN CWR (ARDI) SFH (USAID), GC (USAID/EH), CUR (CUL)
Nyaruguru UNICEF EKN CWR (ARDI) Caritas (USAID), SFH (USAID), GC (USAID/EH), WVR (WVI), SaCR (Oxfam,SaC,DFID GPAF)
Huye CIFF CIFF MoH & MINAGRI
CWR (IA cl.'15), SFH (USAID), GC (USAID/EH & T 2015), WVR (WVI), CUR (CUL), CRS
(KGM-cl.2014)
Nyamagabe UNICEF EKN, SDC (One UN) WRR, WVR CWR (IA cl.'15), Caritas (USAID), One UN (SDC), WVR (SDC), GC (USAID/EH), CRS (KGM-cl.2014)
Ruhango USAID USAID Caritas Caritas (USAID), SFH (USAID), AVSI (3x), GC (USAID/HU closed 2015)
Muhanga UNICEF EKN CRS (Caritas Kabgayi) Caritas (USAID), SFH (USAID), GC (USAID/HU closed 2015)
Kamonyi UNICEF EKN ADRA CARE (USAID - closed Mar 2015), Caritas (USAID), SFH (USAID), AVSI (3x), GC (USAID/HU cl. 2015)
West
Karongi UNICEF EKN CRS (EPR) Caritas (USAID), SFH (USAID), GC (USAID/EH), WVR (WVI)
Rutsiro UNICEF EKN, SDC (One UN) WRR, WVR, Caritas Caritas (USAID), SFH (USAID), One UN (SDC, EKN), GC (USAID/EH), WVR (WVI, Koica)
Rubavu UNICEF GoN, USAID AP SFH (USAID), GC (USAID/HU closed 2015)
Nyabihu USAID USAID TBD (INGO) GC (USAID/HU closed 2015)
Ngororero CIFF CIFF MoH & MINAGRI Caritas (USAID), SFH (USAID), GC (USAID/EH)
Rusizi UNICEF GoN WRR (from 2015) FHI360 (USAID), SFH (USAID)
Nyamasheke UNICEF EKN, IKEA WVR SFH (USAID)
North
Rulindo CIFF CIFF MoH & MINAGRI SFH (USAID), WVR (WVI), SaCR (UKAID,Oxfam,Gates Fundation,SaC), GC (USAID/HU closed 2015)
Gakenke UNICEF GoN, USAID, IKEA AP SFH (USAID), WVR (WVI), GC (USAID/HU closed 2015)
Musanze UNICEF GoN, USAID AP GFH (GHI), SFH (USAID), GC (USAID/T - from 2015)
Burera UNICEF GoN Dir. district support PIH (PIH), GC (USAID/T - from end 2015)
Gicumbi UNICEF EKN, IKEA WVR SFH (USAID), AVSI (3x), GC (USAID/HU closed 2015)
East
Rwamagana USAID USAID AEE SFH (USAID), SaCR (Oxfam,SaC,FONERWA)
Nyagatare CIFF CIFF MoH & MINAGRI SFH (USAID), GC (USAID/HU closed 2015)
Gatsibo UNICEF EKN ADRA Caritas (USAID), AVSI (3x), WVR (WVI)
Kayonza USAID USAID TBD (INGO) ADRA (CFGB), SFH (USAID), WVR (WVI) PIH (PIH), SaCR (UKAID,Oxfam,Gates Fundation,SaC)
Kirehe UNICEF GoN Dir. district support SFH (USAID), PIH (PIH)
Ngoma USAID USAID TBD (INGO) IRC (EU), SFH (USAID)
Backup
Note: Overview showing main catalysts and implementing leads only (with donor in parentheses), but not local implementing partners 1. NB! Overview is not exhaustive
44. Rwanda
Stakeholder &
Action Mapping
2014-15 -
44
Program overview from 2016 – with implementing partners
Nyagatare
Gatsibo
Kayonza
Karongi
Bugesera
Rusizi
Nyamasheke
Kirehe
Ngoma
Rwamagana
Nyaruguru
Nyamagabe
Rulindo
Gicumbi
Huye
Nyanza
Musanze
Burera
Gakenke
Ngororero
Nyabihu
Ruhango
Muhanga
Kamonyi
Gisagara
Rubavu
City of Kigali
Rutsiro
City of Kigali
KicukiroNyarugenge
USAID
CIFF
UNICE
F
Gasabo
WRR'15
8
districts4
districts18
districts
WVR
WRR
'15
CWR
CWR
WRR, WVR
CRS
WRR, WVR
AP
AP
DS
AP
CRS
ADRA
AP DS
ADRAWVR
FxB
TBD
TBDAEE
TBD
Caritas
TBD TBD
DS
DS
DS
DS
Note: DS = Direct Support, TBD = To Be Decided
Source: Stakeholder interviews
45. Rwanda
Stakeholder &
Action Mapping
2014-15 -
45
USD 30+ million in nutrition specific funding on these
programs alone
Donor
Total funding
in USD
Years of
funding
Funding per
year in USD
EKN 17,720,000 3 5,906,667
GoN 6,550,000 4 1,637,500
USAID 1,800,000 3 600,000
IKEA 524,000 2 262,000
UNICEF RR 800,000 4 200,000
SDC 4,900,000 3 1,633,333
USAID 28,800,000 5 5,760,000
CIFF 16,450,000 4 4,112,500
Total nutrition program
funding 77,544,000 20,112,000
EU (Budget support) 33,000,000 3 11,000,000
Total incl. EU budget
support 110,544,000 31,112,000
Over USD 30 million in yearly funding for
next year.. …or ~20 USD per child u51
Pregnant &
Lactating
Women
Target
group USD per
year
USD per
year
Children
u5
Children
u2
6
4
0'
9
7
0'
1,
5
5
0'
Tot
al
#
1. Graph is showing total funding per year divided by total target group, so can not add together figures for Children u2, PLWs and Children u5
Source: Stakeholder interviews, Rwanda National Census
46. Rwanda
Stakeholder &
Action Mapping
2014-15 -
46
Agenda
Introduction, background and objectives of the Stakeholder & Action Mapping
Recap of the food and nutrition situation in Rwanda – highlights from the Nutrition Analysis
• What is the food and nutrition situation nationally?
• What is the food and nutrition situation per district?
Stakeholder & Action Mapping methodology and approach
Stakeholder & Action Mapping overview and analyses
• Who are the main stakeholders working in nutrition in Rwanda?
• What are the main programs?
• What core nutrition actions are the stakeholders working on?
• Where are they working?
• How many are they reaching?
Implications of the findings from the Stakeholder & Action Mapping
• Where and what are the gaps?
• Main recommendations and findings for scaling up
Appendix
49. Rwanda
Stakeholder &
Action Mapping
2014-15 -
49
Explanation of stakeholder roles
Responsible Ministries – Responsible Ministries are the Ministries that take a lead role in
management of a core nutrition action. The majority of actions are under the Ministry of
Health as they are nutrition-specific or health related, but several are also under MINAGRI
(food & agriculture), MINEDUC (schools & school children), MININFRA (water & sanitation)
and MINALOC (social security)
Field Implementers – Field implementers are the organisations implementing a core nutrition
action. A number of international and local NGOs are field implementers, often through
public infrastructure and resources such as health facilities, community health workers and
schools
Catalysts – Catalysts give support and overview to the organisations carrying out the core
nutrition action. They can also be technical leads for several other organizations. The
catalysts are comprised of a number of UN agencies and international NGOs supporting the
government or subcontracting to other organisations
Donors – Donors provide financial support to allow core nutrition actions to be carried out.
Key donors include multilateral and bilateral organisations, trusts and foundations and also
include the government itself
Backup
50. Rwanda
Stakeholder &
Action Mapping
2014-15 -
50
Agenda
Introduction, background and objectives of the Stakeholder & Action Mapping
Recap of the food and nutrition situation in Rwanda – highlights from the Nutrition Analysis
• What is the food and nutrition situation nationally?
• What is the food and nutrition situation per district?
Stakeholder & Action Mapping methodology and approach
Stakeholder & Action Mapping overview and analyses
• Who are the main stakeholders working in nutrition in Rwanda?
• What are the main programs?
• What core nutrition actions are the stakeholders working on?
• Where are they working?
• How many are they reaching?
Implications of the findings from the Stakeholder & Action Mapping
• Where and what are the gaps?
• Main recommendations and findings for scaling up
Appendix
51. Rwanda
Stakeholder &
Action Mapping
2014-15 -
51
Key messages on where the stakeholders are working
All districts have partners working on food & nutrition in their districts:
• However, the number of partners supporting the districts varies widely (from 3 to 13 partners)
The number of Core Nutrition Actions supported by a partner varies substantially
• Some partners are supporting up to 15 (of 23) different Core Nutrition Actions, while others are supporting only one Core
Nutrition Action
• All Core Nutrition Actions are thus not conducted in all districts
There is large variation in the number of sectors that a partner is covering in a district
• Some partners are covering all sectors in a given district, while others may only be supporting 1-2 sectors
• Other partners are only supporting the central district level, e.g. central level coordination and capacity, not direct
implementation at the beneficiary level
• Even though all sectors are covered, that does not necessarily mean that all Core Nutrition Actions are done in all sectors, that
all villages in each sector is supported, or that all beneficiaries are covered
The overview of what partners are working where is only a snapshot of the current situation
• Some projects are being finalized, and others are starting up, so the situation is continuously changing
The geographical mapping builds on the qualitative reporting input provided by the stakeholders in the first phase of the
mapping, and it will thus not necessarily be one to one with the quantitative mapping of beneficiary coverage
• This is e.g. because some districts where not supported in 2014, some CNAs were not carried out in 2014, some data is
provided from central level, data may not be available, etc.
Source: Rwanda Stakeholder & Action Mapping 2014/15
52. Rwanda
Stakeholder &
Action Mapping
2014-15 -
52
What catalysts & implementers are working in which districts?
Nyagatare
Gatsibo
Kayonza
Karongi
Bugesera
Rusizi
Nyamasheke
Kirehe
Ngoma
Rwamagana
Nyaruguru
Nyamagabe
Rulindo
Gicumbi
Huye
Nyanza
Musanze
Burera
Gakenke
Nyabihu
Ruhango
Muhanga
Kamonyi
Gisagara
Rubavu
City of Kigali
Rutsiro
City of Kigali
Kicukiro
Gasabo
Nyarugenge
UNICEF
CIAT
GFYA
GFYA
SFH1
WVR
UNICEF
CIAT
GHI
GC
GFYA
SFH1
WVR
UNICEF
PIH
SFH1
HIR
UNICEF
CIAT
SaCR
SFH1
AP
UNICEF
FAO
CIAT
SaCR
SFH1
AP2
WaterAid
WVR
HIR
GC
SaCR
WVR
UNICEF
ADRA2
AVSI
CARE
Caritas
CIAT
GC
SFH1
HIR
UNICEF
Caritas
CIAT
CRS2
GC
SFH1
UNICEF
WFP
FAO
CUR
CWR2
GC
SFH1
CUR
CIAT
CWR
CRS
GC
SFH1
WVR
UNICEF
WFP
FAO
Caritas
CWR2
GC
SaCR
SFH1
WVR
One UN3
UNICEF3
WFP3
WHO3
FAO3
Caritas
CIAT
CWR
CRS
GC
SFH1
WRR4
WVR4
UNICEF
FAO
FHI 360
SFH1
HIR
UNICEF
FAO
CIAT
GHI
GC
SFH1
AP2
HIR
UNICEF
FAO
GC
SFH1
AP2
UNICEF
FAO
GC
SFH1
AP
HIR
Note: The map shows all organizations that
have provided mapping input, but it does
not show whether they are using anyone as
field implementers in the different districts.
Color code explanations:
Project end in 2015
Mostly central district level support
1. SFH is mostly doing social marketing through local CBOs
2. Implementing partner for UNICEF EKN/GoN program
3. One UN Joint Nutrition Program (SDC funded)
4. Implementing partner for One UN SDC program
Ngororero
CIAT
GC
SFH1
HIR
ADRA
CIAT
PIH
SaCR
SFH1
WVR
HIR
FAO
Caritas
GC
SFH1
AP
UNICEF
IRC
SFH1
AP
UNICEF
FAO
AVSI
Caritas
GC
SFH1
HIR
UNICEF
WFP
FAO
Caritas
CIAT
CRS2
GC
SFH1
WVR
One UN3
UNICEF3
WFP3
WHO3
FAO3
Caritas
GC
SFH1
WRR4
WVR4
AVSI
GC
SaCR
SFH1
AP
UNICEF
CIAT
GC
PIH
UNICEF
FAO
GC
SFH1
AP2
WVR
UNICEF
WFP
AVSI
CIAT
GC
SFH1
WVR2
UNICEF
WFP
FAO
ADRA2
AVSI
Caritas
CIAT
WVR
HIR
UNICEF
FAO
SFH1
WVR2
HIR
NB! Only shows stakeholders who have reported
53. Rwanda
Stakeholder &
Action Mapping
2014-15 -
53
What catalysts & implementers are working in which districts?
And how many Core Nutrition Actions (CNAs) are they conducting?
Nyagatare
Gatsibo
Kayonza
Karongi
Bugesera
Rusizi
Nyamasheke
Kirehe
Ngoma
Rwamagana
Nyaruguru
Nyamagabe
Rulindo
Gicumbi
Huye
Nyanza
Musanze
Burera
Gakenke
Ngororero
Nyabihu
Ruhango
Muhanga
Kamonyi
Gisagara
Rubavu
City of Kigali
Rutsiro
City of Kigali
Kicukiro
Gasabo
Nyarugenge
CIAT
GC
SFH1
HIR
UNICEF
WFP
FAO
ADRA2
AVSI
Caritas
CIAT
WVR
HIR
UNICEF
CIAT
GFYA
GFYA
SFH1
WVR
UNICEF
CIAT
GHI
GC
GFYA
SFH1
WVR
ADRA
CIAT
PIH
SaCR
SFH1
WVR
HIR
UNICEF
PIH
SFH1
HIR
UNICEF
CIAT
SaCR
SFH1
AP
UNICEF
IRC
SFH1
AP
UNICEF
WFP
AVSI
CIAT
GC
SFH1
WVR2
UNICEF
FAO
CIAT
SaCR
SFH1
AP2
WaterAid
WVR
HIR
GC
SaCR
WVR
UNICEF
ADRA2
AVSI
CARE
Caritas
CIAT
GC
SFH1
HIR
UNICEF
Caritas
CIAT
CRS2
GC
SFH1
UNICEF
WFP
FAO
CUR
CWR2
GC
SFH1
CUR
CIAT
CWR
CRS
GC
SFH1
WVR
AVSI
GC
SaCR
SFH1
AP
UNICEF
WFP
FAO
Caritas
CWR2
GC
SaCR
SFH1
WVR
One UN3
UNICEF3
WFP3
WHO3
FAO3
Caritas
CIAT
CWR
CRS
GC
SFH1
WRR4
WVR4
UNICEF
FAO
FHI 360
SFH1
HIR
UNICEF
FAO
SFH1
WVR2
HIR
UNICEF
FAO
AVSI
Caritas
GC
SFH1
HIR
UNICEF
WFP
FAO
Caritas
CIAT
CRS2
GC
SFH1
WVR
One UN3
UNICEF3
WFP3
WHO3
FAO3
Caritas
GC
SFH1
WRR4
WVR4
UNICEF
FAO
GC
SFH1
AP2
WVR
UNICEF
CIAT
GC
PIH
FAO
Caritas
GC
SFH1
AP
UNICEF
FAO
CIAT
GHI
GC
SFH1
AP2
HIR
UNICEF
FAO
GC
SFH1
AP2
UNICEF
FAO
GC
SFH1
AP
HIR
Color code explanations:
Project end in 2015
Mostly central district level support
Note: The map shows all organizations that
have provided mapping input, but it does
not show whether they are using anyone as
field implementers in the different districts.
1. SFH is mostly doing social marketing through local CBOs
2. Implementing partner for UNICEF EKN/GoN program
3. One UN Joint Nutrition Program (SDC funded)
4. Implementing partner for One UN SDC program
CNAs covered:
1 CNA
2-4 CNAs
5-9 CNAs
10-15 CNAs
16-23 CNAs
NB! Only shows stakeholders who have reported
54. Rwanda
Stakeholder &
Action Mapping
2014-15 -
54
What catalysts & implementers are working in which districts?
How many CNAs are they working on, and how many sectors are they covering?
Nyagatare
Gatsibo
Kayonza
Karongi
Bugesera
Rusizi
Nyamasheke
Kirehe
Ngoma
Rwamagana
Nyaruguru
Nyamagabe
Rulindo
Gicumbi
Huye
Nyanza
Musanze
Burera
Gakenke
Ngororero
Nyabihu
Ruhango
Muhanga
Kamonyi
Gisagara
Rubavu
City of Kigali
Rutsiro
City of Kigali
Kicukiro
Gasabo
Nyarugenge
Color code explanations:
Project end in 2015
Mostly central district level support
% of sectors covered:
0-25% of sectors
26-50% of
sectors
51-75% of
sectors
76-99% of
sectors
100% of sectors
Note: The map shows all organizations that
have provided mapping input, but it does
not show whether they are using anyone as
field implementers in the different districts.
UNICEF
CIAT
GFYA
GFYA
SFH1
WVR
UNICEF
CIAT
GHI
GC
GFYA
SFH1
WVR
ADRA
CIAT
PIH
SaCR
SFH1
WVR
HIR
UNICEF
PIH
SFH1
HIR
UNICEF
IRC
SFH1
AP
UNICEF
FAO
CIAT
SaCR
SFH1
AP2
WaterAid
WVR
HIR
GC
SaCR
WVR
UNICEF
ADRA2
AVSI
CARE
Caritas
CIAT
GC
SFH1
HIR
UNICEF
Caritas
CIAT
CRS2
GC
SFH1
UNICEF
WFP
FAO
CUR
CWR2
GC
SFH1
CUR
CIAT
CWR
CRS
GC
SFH1
WVR
AVSI
GC
SaCR
SFH1
AP
UNICEF
WFP
FAO
Caritas
CWR2
GC
SaCR
SFH1
WVR
One UN3
UNICEF3
WFP3
WHO3
FAO3
Caritas
CIAT
CWR
CRS
GC
SFH1
WRR4
WVR4
UNICEF
FAO
FHI 360
SFH1
HIR
UNICEF
FAO
SFH1
WVR2
HIR
UNICEF
FAO
AVSI
Caritas
GC
SFH1
HIR
UNICEF
WFP
FAO
Caritas
CIAT
CRS2
GC
SFH1
WVR
One UN3
UNICEF3
WFP3
WHO3
FAO3
Caritas
GC
SFH1
WRR4
WVR4
FAO
Caritas
GC
SFH1
AP
UNICEF
FAO
GC
SFH1
AP2
UNICEF
FAO
GC
SFH1
AP
HIR
1. SFH is mostly doing social marketing through local CBOs
2. Implementing partner for UNICEF EKN/GoN program
3. One UN Joint Nutrition Program (SDC funded)
4. Implementing partner for One UN SDC program
CNAs covered:
1 CNA
2-4 CNAs
5-9 CNAs
10-15 CNAs
16-23 CNAs
CIAT
GC
SFH1
HIR
UNICEF
CIAT
SaCR
SFH1
AP
UNICEF
FAO
CIAT
GHI
GC
SFH1
AP2
HIR
UNICEF
CIAT
GC
PIH
UNICEF
FAO
GC
SFH1
AP2
WVR
UNICEF
WFP
AVSI
CIAT
GC
SFH1
WVR2
UNICEF
WFP
FAO
ADRA2
AVSI
Caritas
CIAT
WVR
HIR
NB! Only shows stakeholders who have reported
55. Rwanda
Stakeholder &
Action Mapping
2014-15 -
55
What catalysts & implementers are working in which districts?
How many CNAs are they working on, and what districts does not have support in all sectors?
Nyagatare
Gatsibo
Kayonza
Karongi
Bugesera
Rusizi
Nyamasheke
Kirehe
Ngoma
Rwamagana
Nyaruguru
Nyamagabe
Rulindo
Gicumbi
Huye
Nyanza
Musanze
Burera
Gakenke
Ngororero
Nyabihu
Ruhango
Muhanga
Kamonyi
Gisagara
Rubavu
City of Kigali
Rutsiro
City of Kigali
Kicukiro
Gasabo
Nyarugenge
CIAT
GC
SFH1
HIR
UNICEF
CIAT
GFYA
GFYA
SFH1
WVR
UNICEF
CIAT
GHI
GC
GFYA
SFH1
WVR
ADRA
CIAT
PIH
SaCR
SFH1
WVR
HIR
UNICEF
PIH
SFH1
HIR
UNICEF
CIAT
SaCR
SFH1
AP
UNICEF
IRC
SFH1
AP
UNICEF
FAO
CIAT
SaCR
SFH1
AP2
WaterAid
WVR
HIR
GC
SaCR
WVR
UNICEF
ADRA2
AVSI
CARE
Caritas
CIAT
GC
SFH1
HIR
UNICEF
Caritas
CIAT
CRS2
GC
SFH1
UNICEF
WFP
FAO
CUR
CWR2
GC
SFH1
CUR
CIAT
CWR
CRS
GC
SFH1
WVR
AVSI
GC
SaCR
SFH1
AP
UNICEF
WFP
FAO
Caritas
CWR2
GC
SaCR
SFH1
WVR
One UN3
UNICEF3
WFP3
WHO3
FAO3
Caritas
CIAT
CWR
CRS
GC
SFH1
WRR4
WVR4
UNICEF
FAO
FHI 360
SFH1
HIR
UNICEF
FAO
SFH1
WVR2
HIR
UNICEF
FAO
AVSI
Caritas
GC
SFH1
HIR
UNICEF
WFP
FAO
Caritas
CIAT
CRS2
GC
SFH1
WVR
One UN3
UNICEF3
WFP3
WHO3
FAO3
Caritas
GC
SFH1
WRR4
WVR4
FAO
Caritas
GC
SFH1
AP
UNICEF
FAO
GC
SFH1
AP2
UNICEF
FAO
GC
SFH1
AP
HIR
Color code explanations:
Project end in 2015
Mostly central district level support
Note: The map shows all organizations that
have provided mapping input, but it does
not show whether they are using anyone as
field implementers in the different districts.
1. SFH is mostly doing social marketing through local CBOs
2. Implementing partner for UNICEF EKN/GoN program
3. One UN Joint Nutrition Program (SDC funded)
4. Implementing partner for One UN SDC program
CNAs covered:
1 CNA
2-4 CNAs
5-9 CNAs
10-15 CNAs
16-23 CNAs
% of sectors covered:
0-25% of sectors
26-50% of
sectors
51-75% of
sectors
76-99% of
sectors
100% of sectors
Backup
UNICEF
FAO
CIAT
GHI
GC
SFH1
AP2
HIR
UNICEF
CIAT
GC
PIH
UNICEF
FAO
GC
SFH1
AP2
WVR
UNICEF
WFP
AVSI
CIAT
GC
SFH1
WVR2
UNICEF
WFP
FAO
ADRA2
AVSI
Caritas
CIAT
WVR
HIR
NB! Only shows stakeholders who have reported
56. Rwanda
Stakeholder &
Action Mapping
2014-15 -
56
What other implementing partners have they reported?
Nyagatare
Gatsibo
Kayonza
Karongi
Bugesera
Rusizi
Nyamasheke
Kirehe
Ngoma
Rwamagana
Nyaruguru
Nyamagabe
Rulindo
Gicumbi
Huye
Nyanza
Musanze
Burera
Gakenke
Nyabihu
Ruhango
Muhanga
Kamonyi
Gisagara
Rubavu
City of Kigali
Rutsiro
City of Kigali
Kicukiro
Gasabo
Nyarugenge
SFH1
:
LCBOs
UNICEF:
WRR'15
GC:
ICYUZUZO
SINAPISI
CRS
SFH1
:
LCBOs
SFH1
:
LCBOs
SFH1
:
LCBOs
UNICEF:
AP2
WaterAid:
COFORWA
SFH1
:
LCBOs
GC:
DUHAMIC
-ADRI
WIF
CRS
UNICEF:
ADRA2
:
RWARI
AVSI:
MLFM
GC:
DUHAMIC-A
DRI,
EPR, CRS
SFH1
:
LCBOs
UNICEF:
CRS2
Caritas
GC:
DUHAMIC-
ADRI, CRS
SFH1
:
LCBOs
UNICEF:
CWR2
:
ARDI
GC:
DUHAMIC-ADRI
AEE
ADEPR
StC
SFH1
:
LCBOs
CWR:
ARDI
SDA IRIBA
CRS:
Caritas
GC:
DUHAMIC-A
DRI. AEE
ADEPR,StC
SFH1
:
LCBOs
UNICEF:
CWR2
ARDI
SDA Iriba
GC:
DUHAMIC-A
DRI.
ADEPR, StC
SFH1
:
LCBOs
One UN3
WRR4
WVR4
CWR:
ARDI
SDA Iriba
CRS:
Caritas
GC:
DUHAMIC-
ADRI. AEE
ADEPR,StC
SFH1
:
LCBOs
UNICEF:
WRR'15
FHI 360:
Local Coops
SFH1
:
LCBOs
UNICEF:
AP2
SNV
GC:
ADEPR
CRS
SFH1
;
LCBOs
UNICEF:
AP2
GC:
ADEPR
CRS
SFH1
:
LCBOs
UNICEF:
SNV
GC:
ADEPR
CRS
SFH1
:
LCBOs
Note: The map shows all organizations that
have provided mapping input, but it does
not show whether they are using anyone as
field implementers in the different districts.
Color code explanations:
Catalyst / Lead
Project end in 2015
1. SFH is mostly doing social marketing through local CBOs
2. Implementing partner for UNICEF EKN/GoN program
3. One UN Joint Nutrition Program (SDC funded)
4. Implementing partner for One UN SDC program
Ngororero
GC:
EPR
SFH1
:
LCBOs
ADRA:
RWARRI
SFH1
:
LCBOs
GC:
Caritas
ADEPR
StC
SFH1
:
LCBOs
IRC:
BENISHYAKA
SFH1
:
LCBOs
AVSI:
MLFM
GC:
DUHAMIC-ADRI,
CRS
SFH1
:
LCBOs
UNICEF:
CRS2
EPR
GC:
Caritas
ADEPR
StC
SFH1
:
LCBOs
One UN3
:
WRR4
Caritas'15
WVR4
'15
GC:
Caritas
ADEPR
StC
SFH1
:
LCBOs
AVSI:
MLFM
GC:
DUHAMIC-ADRI
ADEPR, StC
SFH1
:
LCBOs
UNICEF:
SNV
UNICEF:
AP2
GC:
ADEPR
WIF, CRS
SFH1
:
LCBOs
UNICEF:
WVR2
AVSI:
MLFM, APH
GC:
ADEPR, CRS
SFH1
:
LCBOs
UNICEF:A
DRA2
RWARRI
AVSI:
MLFM
UNICEF:
WVR2
SFH1
:
LCBOs
Shows stakeholders who have reported to work
with other implementing partners
Backup
57. Rwanda
Stakeholder &
Action Mapping
2014-15 -
57
Where are the ministries working?
And how many Core Nutrition Actions (CNAs) are they conducting?
Nyagatare
Gatsibo
Kayonza
Karongi
Bugesera
Rusizi
Nyamasheke
Kirehe
Ngoma
Rwamagana
Nyaruguru
Nyamagabe
Rulindo
Gicumbi
Huye
Nyanza
Musanze
Burera
Gakenke
Ngororero
Nyabihu
Ruhango
Muhanga
Kamonyi
Gisagara
Rubavu
City of Kigali
Rutsiro
City of Kigali
Kicukiro
Gasabo
Nyarugenge
MoH
MINAGRI
MINALOC
MINEDUC
MIGEPROF
MoH
MINAGRI
MINALOC
MINEDUC
MIGEPROF
MoH
MINAGRI
MINALOC
MINEDUC
MIGEPROF
MoH
MINAGRI
MINALOC
MINEDUC
MIGEPROF
MoH
MINAGRI
MINALOC
MINEDUC
MIGEPROF
MoH
MINAGRI
MINALOC
MINEDUC
MIGEPROF
MoH
MINAGRI
MINALOC
MINEDUC
MIGEPROF
MoH
MINAGRI
MINALOC
MINEDUC
MIGEPROF
MoH
MINAGRI
MINALOC
MINEDUC
MIGEPROF
MoH
MINAGRI
MINALOC
MINEDUC
MIGEPROF
MoH
MINAGRI
MINALOC
MINEDUC
MIGEPROF
MoH
MINAGRI
MINALOC
MINEDUC
MIGEPROF
MoH
MINAGRI
MINALOC
MINEDUC
MIGEPROF
MoH
MINAGRI
MINALOC
MINEDUC
MIGEPROF
MoH
MINAGRI
MINALOC
MINEDUC
MIGEPROF
MoH
MINAGRI
MINALOC
MINEDUC
MIGEPROF
MoH
MINAGRI
MINALOC
MINEDUC
MIGEPROF
MoH
MINAGRI
MINALOC
MINEDUC
MIGEPROF
MoH
MINAGRI
MINALOC
MINEDUC
MIGEPROF
MoH
MINAGRI
MINALOC
MINEDUC
MIGEPROF
MoH
MINAGRI
MINALOC
MINEDUC
MIGEPROF
MoH
MINAGRI
MINALOC
MINEDUC
MIGEPROF
MoH
MINAGRI
MINALOC
MINEDUC
MIGEPROF
MoH
MINAGRI
MINALOC
MINEDUC
MIGEPROF
MoH
MINAGRI
MINALOC
MINEDUC
MIGEPROF
MoH
MINAGRI
MINALOC
MINEDUC
MIGEPROF
MoH
MINAGRI
MINALOC
MINEDUC
MIGEPROF
MoH
MINAGRI
MINALOC
MINEDUC
MIGEPROF
MoH
MINAGRI
MINALOC
MINEDUC
MIGEPROF
CNAs covered:
1 CNA
2-4 CNAs
5-9 CNAs
10-15 CNAs
16-23 CNAs
MoH
MINAGRI
MINALOC
MINEDUC
MIGEPROF
Backup
Note: The ministries are often working through their implementing agencies, such as RBC, REB, RAB, NWC and LODA, and through the public infrastructure (health facilities, schools, etc.)
NB! Only shows stakeholders who have reported
58. Rwanda
Stakeholder &
Action Mapping
2014-15 -
58
Agenda
Introduction, background and objectives of the Stakeholder & Action Mapping
Recap of the food and nutrition situation in Rwanda – highlights from the Nutrition Analysis
• What is the food and nutrition situation nationally?
• What is the food and nutrition situation per district?
Stakeholder & Action Mapping methodology and approach
Stakeholder & Action Mapping overview and analyses
• Who are the main stakeholders working in nutrition in Rwanda?
• What are the main programs?
• What core nutrition actions are the stakeholders working on?
• Where are they working?
• How many are they reaching?
Implications of the findings from the Stakeholder & Action Mapping
• Where and what are the gaps?
• Main recommendations and findings for scaling up
Appendix
59. Rwanda
Stakeholder &
Action Mapping
2014-15 -
59
Key messages on coverage of Core Nutrition Actions
Geographic coverage of Core Nutrition Actions (CNAs):
• 14 of 23 CNAs are being conducted in all districts
• 6 of 23 CNAs are conducted in 15-29 districts
• 3 of 23 CNAs are conducted in less than 10 districts
• South, West and North with the most support and highest coverage
• Low coverage in Kigali City, but also because people here tend to be better off (high development score)
Beneficiary coverage
• Only 5 CNAs have more than 75% of beneficiaries covered
• 4 CNAs have between 50-75% coverage, 4 CNAs have between 25-50% coverage, and 4 CNAs have below
25% coverage
• 6 CNAs are measured as additional %-points reached, ranging from 1 to 8 additional %-points reached
Action category coverage
• Health categories in general have the highest coverage, though some CNAs are lagging behind also here
(e.g. diarrhoea treatment, 4+ ANC visits and SAM/MAM treatment)
• Nutrition education, including promotion of breast feeding, complementary feeding, and promotion of
hygiene and hand washing have lower coverage than ideal, and should be increased
• WASH has in general low coverage, but that may also be due to low participation rates from WASH partners
• Delivery mechanism analysis could be one source of information to discuss how to best scale up CNAs
Source: Rwanda Stakeholder & Action Mapping 2014/15
60. Rwanda
Stakeholder &
Action Mapping
2014-15 -
60
What % of the target group is covered nationally and how? (1/2)
Country relevant actions
# of districts
covered Key delivery mechanisms
CHWs, HFs, Women/Mother groups,
Mass campaigns, PD/H
CHWs, Health centers, UN agencies,
NGOs
CHWs, Health centers, UN agencies
CHWs, Health centers,
Mass campaigns
CHWs, Health centers, Hospitals
Health centers, Hospitals
CHWs, Health centers, PD/H,
Women/Mother groups
CHWs, Health centers, NGOs
Target groups (TG)
Pregnant & lactating women
HHs with children u5 (CBNP)
% of TG
covered
Children 6-23 months
Children 6-59 months
Children 0-59 months with severe
diarrhoea
Children 0-59 months with SAM
Children 0-59 months with MAM
Children 6-59 months
CHWs, HFs, Women/Mother groups,
Mass campaigns, PD/H
20 / 30
23 / 30
4 / 30
7 / 301
30 / 30
30 / 30
30 / 30
30 / 30
Promote optimal
breastfeeding practices
Provide spec. nutritious
products for CF
Promote optimal compl.
feeding practices
Provide Fe+FA supplements
Provide deworming tablets
Provide diarrhoea treatment
(w/ ORS/zinc)
Provide MNP supplements
(Ongera)
Provide treatment
of SAM
Support and provide
treatment of MAM
MIYCN
Disease
prev./mgmt
Micronutrient
supplementation
MAM/SAM
Provide Vitamin A
supplements
CHWs, Health centers,
Mass campaigns
30 / 30
Conduct child growth
monitoring / screening
Promote/Provide
ANC visits (4+)
MCH
CHWs, Health centers, HospitalsPregnant women30 / 30
Pregnant & lactating women
HHs with children u5 (CBNP)
6-23 months in Ubudehe 1&2
PLW in Ubudehe 1&2
Children 12-59 months
Children 5-15 years
0-25%
26-50 51-75 76-100
1 / 30
30 / 30
30 / 30
1. MNP program (Ongera) is being scaled up, and is in the 2nd half of 2015 in 18 districts
30 / 30
As reported in SUNPMT tool
61. Rwanda
Stakeholder &
Action Mapping
2014-15 -
61
What % of the target group is covered nationally and how? (2/2)
Country relevant actions
# of districts
covered Key delivery mechanisms
FFLS, Agriculture village promotors,
Coops, RAB
FFLS, Agriculture village promotors,
CHWs, Coops, NGOs
CHWs, Agriculture village promotors,
FFLS, Mass campaigns, PD/H
Pre-schools, Primary schools,
Secondary schools
Districts, UN agencies, NGOs, CHCs,
Women/mother groups
CHWs, CHCs, FFLS, Community
meetings, PD/H, Mass campaigns
VUP, Social services, FFLS,
Community leaders
Primary schools
Target groups (TG)
% of TG
covered1
Smallholder farming households
Households in Ubudehe 1 & 2
Mothers / Caregivers
Schools
Households in Ubudehe 1 & 23
FFLS, Agriculture village promotors,
CHWs, Coops, PD/H, NGOs
30 / 30
27 / 30
28 / 30
29 / 30
30 / 30
30 / 30
15 / 30
Provide materials & techn. for
small-scale horticulture
Provide animals for
small-scale husbandry
Promote food preservation
and storage
Provide input for production &
cons. of biofortified crops
Provide/Support improved
water source
Provide/Support improved
sanitation
Carry out nutr. education
(e.g. cooking demos)
Promote hygiene / hand
washing
Provide conditional social
safety net actions (VUP)
Food&AgricultureWASH2Nutrition
education
Carry out nutr. education at
school (e.g. school gardens)
Districts, UN agencies, NGOs,
Community leaders
Provide school feeding
(One Cup of Milk)
Social
security
FFLS, Agriculture village promotors,
CHWs, Coops, NGOs
Household with children under 530 / 30
Household with children under 5
Households
Schools
Households
Schools
Pregnant & lactating women
Schools
Primary school children
Primary schools
+8%
+3%
+5%
+4%
+1%
0%
+1%
+1%
0-25%
26-50 51-75 76-100
9 / 30
21 / 30
28 / 30
5 / 30
1 / 30
4 / 30
1. Beneficiary coverage displayed as "+X%" represents the additional %-points of households reached over the last calendar year (2014).
2. Have received limited input from WASH stakeholders (who have separate technical working groups), and actual geographic and beneficiary coverage is probably higher
3. Not all Households in Ubudehe 1 & 2 are targets for the Vision Umurenge 2020 Program (aiming mostly for those without employment), so not necessarily aiming for 100% coverage here
As reported in SUNPMT tool
62. Rwanda
Stakeholder &
Action Mapping
2014-15 -
62
What % of the target group is covered per province? (1/2)
Country relevant actions
Target groups
(TG)
PLW
HHs w/ children u5
Children 6-23 months
Children 6-59 months
Children 0-59 mths
with severe diarrhoea
Children 0-59 months
with SAM
Children 0-59 months
with MAM
Children 6-59 months
Promote optimal
breastfeeding practices
Provide spec. nutritious
products for CF
Promote optimal compl.
feeding practices
Provide Fe+FA
supplements
Provide deworming
tablets
Provide diarrhoea
treatment (w/ ORS/zinc)
Provide MNP
supplements (Ongera)
Provide treatment
of SAM
Support and provide
treatment of MAM
MIYCN
Disease
prev./mgmt
Micronutrient
supplementation
MAM/SAM
Provide Vitamin A
supplements
Conduct child growth
monitoring / screening
Promote/Provide
ANC visits (4+)
MCH
Pregnant women
Pregnant women
PLW
HHs w/ children u5
6-23 months in U1&2
PLW in U1&2
Children 12-59 mths
Children 5-15 years
0-25%
26-50 51-75 76-100
As reported in SUNPMT tool
Rwanda
total Kigali City South West North East
1. MNP program (Ongera) is being scaled up, and is in the 2nd half of 2015 in 18 districts
3 actions are being
implemented at scale across all
provinces
63. Rwanda
Stakeholder &
Action Mapping
2014-15 -
63
What % of the target group is covered per province? (2/2)
Country relevant actions
Target groups
(TG)
Smallholder farming
households
Households in
Ubudehe 1 & 2
Mothers / Caregivers
Schools
Households in
Ubudehe 1 & 23
Provide materials & techn.
for small-scale horticulture
Provide animals for
small-scale husbandry
Promote food
preservation & storage
Provide input for prod. &
cons. of biofortified crops
Provide/Support
improved water source
Provide/Support
improved sanitation
Carry out nutr. educ.
(e.g. cooking demos)
Promote hygiene /
hand washing
Provide conditional social
safety net actions (VUP)3
Food&AgricultureWASH2Nutrition
education
Carry out nutr. educ. at
school (school gardens)
Provide school feeding
(One Cup of Milk)
Social
security
Household with
children under 5
Household with
children under 5
Households
Schools
Households
Schools
PLW
Schools
Pri. school children
Primary schools
1. Beneficiary coverage displayed as "+X%" represents the additional %-points of households reached over the last calendar year (2014).
2. Have received limited input from WASH stakeholders (who have separate technical working groups), and actual geographic and beneficiary coverage is probably higher
3. Not all Households in Ubudehe 1 & 2 are targets for the Vision Umurenge 2020 Program (aiming mostly for those without employment), so not necessarily aiming for 100% coverage here
As reported in SUNPMT tool
Rwanda
total Kigali City South West North East
0-25%
26-50 51-75 76-100
+8%1
+3%1
+5%1
+4%1
+1%1
+1%1
+2%1
+14%1
+7%1
+6%1
+7%1
+8%1
+5%1
+5%1
+2%1
+2%1
+1%1
+5%1
+7%1
+7%1
+1%1
+6%1
+2%1
+1%1
0%1
+1%1
+1%1
+1%1
+1%1
+3%1
+2%1
+1%1
+4%1
+1%1
0%1
+4%1
There is the strongest support
for food & agriculture actions in
the South compared to other
provinces
64. Rwanda
Stakeholder &
Action Mapping
2014-15 -
64
What % of the target group is covered per district?
0-25%
coverage
Additional %-points
reached
25-50%
coverage
50-75%
coverage
75-100%
coverage
100+%
coverage
Backup
As reported in SUNPMT tool
Source: Stakeholder & Action Mapping 2014/15
65. Rwanda
Stakeholder &
Action Mapping
2014-15 -
65
Leverage mapping findings on delivery mechanisms to identify
opportunities for both scale up and synergies of the CNAs
Scale up
Synergies
For the actions with few
delivery mechanisms, is there
potential to increase reach by
extending delivery to other
delivery mechanisms?
For delivery mechanisms
that are less commonly
used, is there potential to
strengthen scale up
through these delivery
mechanisms?
Could some delivery mechanisms be in danger of
becoming over utilized or exhausted? Is it possible
to increase capacity of such delivery mechanisms?
Major use of channel (75-100% of implementors)
Substantial use of channel (50-75% of implementors)
Some use of channel (25-50% of implementors)
Low use of channel (0-25% of implementors)
66. Rwanda
Stakeholder &
Action Mapping
2014-15 -
66
Agenda
Introduction, background and objectives of the Stakeholder & Action Mapping
Recap of the food and nutrition situation in Rwanda – highlights from the Nutrition Analysis
• What is the food and nutrition situation nationally?
• What is the food and nutrition situation per district?
Stakeholder & Action Mapping methodology and approach
Stakeholder & Action Mapping overview and analyses
• Who are the main stakeholders working in nutrition in Rwanda?
• What are the main programs?
• What core nutrition actions are the stakeholders working on?
• Where are they working?
• How many are they reaching?
Implications of the findings from the Stakeholder & Action Mapping
• Where and what are the gaps?
• Main recommendations and findings for scaling up
Appendix
67. Rwanda
Stakeholder &
Action Mapping
2014-15 -
67
Agenda
Introduction, background and objectives of the Stakeholder & Action Mapping
Recap of the food and nutrition situation in Rwanda – highlights from the Nutrition Analysis
• What is the food and nutrition situation nationally?
• What is the food and nutrition situation per district?
Stakeholder & Action Mapping methodology and approach
Stakeholder & Action Mapping overview and analyses
• Who are the main stakeholders working in nutrition in Rwanda?
• What are the main programs?
• What core nutrition actions are the stakeholders working on?
• Where are they working?
• How many are they reaching?
Implications of the findings from the Stakeholder & Action Mapping
• Where and what are the gaps?
• Main recommendations and findings for scaling up
Appendix
68. Rwanda
Stakeholder &
Action Mapping
2014-15 -
68
Key messages on gaps
Only a few Core Nutrition Actions (CNAs) have full coverage
• Most CNAs needs to be further scaled up
• There may need to be a discussion of priorities on what CNAs to scale up, and where
• E.g. on cost of scaling up versus effect and how accurately the main target group is addressed (e.g. school
feeding vs actions focusing more directly on children under 5 or under 2)
There is not necessarily a clear link between the districts with the highest stunting rates and the
corresponding action coverage per district
• There may need to be a discussion on what districts to prioritize first, e.g. by investing in more core nutrition
actions and higher coverage
Most districts have a stunting prevalence and a corresponding action coverage where further scale up is
needed
• Should discuss how to best ensure this, e.g. by securing that all districts have dedicated partners and proper
funding (may improve already with the CIFF and USAID INWA programs)
Continued focus on stunting reduction is needed
• Some key situation indicators are on a low level and showing slow progress, e.g. anemia, food consumption
score, minimum acceptable diet and WASH
69. Rwanda
Stakeholder &
Action Mapping
2014-15 -
69
Only a few of the core nutrition actions have full coverage
Iron and folic acid
supplements
Biofortified crops
Food storage &
preservation
MNP supplements
(Ongera)4
Small scale
horticulture
(kitchen gardens)
Small scale animal
husbandry
Improved
water source2
Diarrhoea treatment
Vitamin A supplements
Hygiene and
hand washing
Treatment of SAM
Child growth
monitoring / screening
Deworming tablets
Social safety net
actions (VUP)3
Optimal compl. feeding
Nutrition education
at schools
(school gardens)
Improved
sanitation2Treatment of MAM
ANC visits (4+)
Specialized nutritious
food for
complementary feeding
Schoold feeding
(One Cup of Milk)
Nutrition
education
Optimal breast
feeding
+1%-po
ints1
+1%-po
ints1
+3%-po
ints1
+4%-po
ints1
+8%-po
ints1
+5%-po
ints1
Source: Stakeholder & Action Mapping Rwanda 2014/15
0-25% 26-50% 51-75% 76-100%
1. Beneficiary coverage displayed as
"+X%-points" represents the additional
%-points of households reached over the
last calendar year (2014)
2. Have received limited input from WASH
stakeholders (who have separate technical
working groups), and actual coverage is
probably higher
3. Not all Households in Ubudehe 1 & 2 are
targets for the Vision Umurenge 2020
Program, so not necessarily aiming for
100% coverage here
4. MNP program (Ongera) is being scaled
up, and is in the 2nd half of 2015 in 18
districts
70. Rwanda
Stakeholder &
Action Mapping
2014-15 -
70
Prevalence of stunting varies across districts, and not all the
districts with high stunting have all core nutrition actions
Stunting strongly prevalent in most districts,
especially in the West & South-East
All districts with 15 or more CNAs,
but only one district with all 23 CNAs
1. NB! Confidence intervals are rather large on a district level
Source: Rwanda National Nutrition Screening 2014, Rwanda Stakeholder & Action Mapping 2014/15
10-14
15-19
23
20-22
# of Core Nutrition Actions
being conducted per district
Nyagatare
Gatsibo
Kayonza
Karongi
Bugesera
Rusizi
Nyamasheke
Kirehe
Ngoma
Rwamagana
Nyaruguru
Nyamagabe
Rulindo
Gicumbi
Huye
Nyanza
Musanze
Burera
Gakenke
Ngororero
Nyabihu
Ruhango
Muhanga
Kamonyi
Gisagara
Rubavu
City of Kigali
Rutsiro
Nyagatare
Gatsibo
Kayonza
Karongi
Bugesera
Rusizi
Nyamasheke
Kirehe
Ngoma
Rwamagana
Nyaruguru
Nyamagabe
Rulindo
Gicumbi
Huye
Nyanza
Musanze
Burera
Gakenke
Ngororero
Nyabihu
Ruhango
Muhanga
Kamonyi
Gisagara
Rubavu
City of Kigali
Rutsiro
20% - 29%
30% - 39%
>40%
Stunting prevalence among
children 0-59 months 1
<20%
71. Rwanda
Stakeholder &
Action Mapping
2014-15 -
71
Only one district have an action intensity where more than 75%
of core nutrition actions reach at least 30% of target population
Stunting strongly prevalent in most districts,
especially in the West & South-East
Only one district with more than 75% of actions
reaching over 30% of target population
0% - 25%
26% - 50%
76% - 100%
51% - 75%
% of actions with at least 30%2
of
target population covered
1. NB! Confidence intervals are rather large on a district level 2. 30% of target population covered or more than 1%-points additional beneficiaries covered (for Food & Agriculture and WASH infrastructure)
Source: Rwanda National Nutrition Screening 2014, Rwanda Stakeholder & Action Mapping 2014/15
Nyagatare
Gatsibo
Kayonza
Karongi
Bugesera
Rusizi
Nyamasheke
Kirehe
Ngoma
Rwamagana
Nyaruguru
Nyamagabe
Rulindo
Gicumbi
Huye
Nyanza
Musanze
Burera
Gakenke
Ngororero
Nyabihu
Ruhango
Muhanga
Kamonyi
Gisagara
Rubavu
City of Kigali
Rutsiro
Nyagatare
Gatsibo
Kayonza
Karongi
Bugesera
Rusizi
Nyamasheke
Kirehe
Ngoma
Rwamagana
Nyaruguru
Nyamagabe
Rulindo
Gicumbi
Huye
Nyanza
Musanze
Burera
Gakenke
Ngororero
Nyabihu
Ruhango
Muhanga
Kamonyi
Gisagara
Rubavu
City of Kigali
Rutsiro
Nyamagabe is also
the only district where
all 23 core nutrition
actions are being
implemented
20% - 29%
30% - 39%
>40%
Stunting prevalence among
children 0-59 months 1
<20%
72. Rwanda
Stakeholder &
Action Mapping
2014-15 -
72
What actions are not being conducted and where?
Backup
1. MNP program (Ongera) is being scaled up, and is already now (2nd half 2015 in 18 districts)
Source: Stakeholder & Action Mapping Rwanda 2014/15
73. Rwanda
Stakeholder &
Action Mapping
2014-15 -
73
Monitor Maintain
Scale up Investigate
Many districts are not adequately addressed, and scale-up
discussion in these districts may be necessary
60
%
70
%
40
%
0
%
30
%
50
%
30
%
80
%
40
%
0
%
50
%
60
%
Gatsibo
GicumbiNyagatare
Rwamagan
a Kayonza
Musanze
Ngororer
o
Nyamagab
e
Kirehe
Ruhang
o Nyarugur
u
Muhang
a
Rubavu
Rutsiro
Bugesera
Nyabih
u
Stunting prevalence1
% of actions with at least 30%2
of target population covered
Gakenke
Nyamashek
e
Ngoma Rulind
o Rusizi
Burera
Huye
Karongi
Kamonyi
Gisagara
NyanzaKicukiro
Gasabo
Nyarugeng
e
1. Among children 0-59 months old. NB! Confidence intervals are rather large on a district level
2. 30% of target population covered or more than 1%-points additional beneficiaries covered (for Food & Agriculture and WASH infrastructure)
Source: Stakeholder & Action Mapping Rwanda 2014/15, Rwanda National Nutrition screening 2014
Wes
tNort
h
Sout
h
Eas
t
Kigali
City
74. Rwanda
Stakeholder &
Action Mapping
2014-15 -
74
Agenda
Introduction, background and objectives of the Stakeholder & Action Mapping
Recap of the food and nutrition situation in Rwanda – highlights from the Nutrition Analysis
• What is the food and nutrition situation nationally?
• What is the food and nutrition situation per district?
Stakeholder & Action Mapping methodology and approach
Stakeholder & Action Mapping overview and analyses
• Who are the main stakeholders working in nutrition in Rwanda?
• What are the main programs?
• What core nutrition actions are the stakeholders working on?
• Where are they working?
• How many are they reaching?
Implications of the findings from the Stakeholder & Action Mapping
• Where and what are the gaps?
• Main recommendations and findings for scaling up
Appendix
75. Rwanda
Stakeholder &
Action Mapping
2014-15 -
75
Summary of initial recommendations on planning and scale-up
Increase
geographic
reach
Improve
action &
beneficiary
coverage
Focus on
stunting and
on improving
core indicators
Main issues
Some districts have limited support,
leaving gaps in geographic coverage
Some partners seem to be spread
thinly (e.g. covering some sectors
and villages here and there) instead
of focusing their efforts
Initial recommendations
Secure that all districts have dedicated
partners in fighting malnutrition
Encourage partners to focus efforts
more geographically (cover all villages
& sectors in an area) to simplify
coordination & increase efficiency
Several CNAs are not present in all
districts, and many are just done in
some sectors and villages
Beneficiary coverage is low for many
of the CNAs – large parts of the target
groups are not reached
Many core nutrition actions should
be scaled up to cover more districts,
sectors and villages
When core nutrition action is present
in districts, coverage of the target
groups needs to be improved
Stunting is still high, and rate of
reduction is slow
Main indicators are lagging behind,
like Minimum Acceptable Diet, Food
Consumption Scores and WASH
access
Continue focus on reducing chronic
malnutrition, but accelerate scale-up
Complementary feeding practices,
food diversity & availability, and
water source, sanitation and hygiene
needs to be further improved
A
B
C
✗ ✓
Source: Rwanda Stakeholder & Action Mapping 2014/15
76. Rwanda
Stakeholder &
Action Mapping
2014-15 -
76
Increase geographic reach, but don't spread resources too thin
A
Large differences in district support
Even with many partners,
some are only covering a few sectors
Secure that all districts have dedicated
partners in fighting malnutrition
Encourage partners to cover all villages
and sectors in a district to simplify
coordination and increase efficiency
# of districts
supported
Avg % of
sectors
Number of partners per
district
Average
partners
:
6
Districts
Each point represent an
implementing partner
Source: Rwanda Stakeholder & Action Mapping 2014/15
77. Rwanda
Stakeholder &
Action Mapping
2014-15 -
77
Improve action & beneficiary coverage
B
Some CNAs are only present
in a few districts
Beneficiary coverage for many of the
CNAs are too low
Scale up core nutrition actions to cover
more districts, sectors and villages
(e.g. by piggybacking on other programs)
Improve CNA coverage of the target
groups, while also focusing on the
quality of the action coverage
Provide specialized nutritious products for
CF
Provide micronutrient suppl.
(MNPs/Ongera)1
Provide/Support improved water
source
Provide school feeding (One Cup of
Milk)
Provide/Support improved
sanitation
Promote food preservation and
storage
Promote hygiene / hand
washing
Provide animals for small-scale animal
husbandry
Carry out nutrition education (e.g. cooking
demos)
50
%
0
%
100
%
Growth monitoring /
screening
Iron and folic
acid
Spec. products for CF (e.g.
CSB)
Nutr. education (e.g. cooking
demos)
School feeding (One Cup of
Milk)
MNPs
(Ongera)Diarrhoea treatment
(ORS/zinc)
Deworming
tabletsVitamin A
supplements
Social safety net actions
(VUP)
ANC visits (4+)Hygiene / hand
washing
Nutr. educ. school (School
gardens)
Small-scale horticulture (Kitchen
gardens)
Improved
sanitation
Food preservation &
storage
Biofortified crops (beans, sweet
potato)
Small-scale animal
husbandry
Improved water
source
Treatment of
SAM
Optimal BF
practicesOptimal CF
practices
Treatment of
MAM
# of districts per
CNA:
Beneficiary
coverage per CNA:
>75%
50-75
%
25-50
%
<25%
+%-pt
s
30 districts
<30 districts
Source: Rwanda Stakeholder & Action Mapping 2014/15
78. Rwanda
Stakeholder &
Action Mapping
2014-15 -
78
Focus on stunting and main lagging indicators
C
Stunting progress is still too slow Main indicators showing limited progress
Continue focus on stunting reduction and
the 1st 1000 days windows of opportunity,
but significant acceleration is needed
Complementary feeding practices,
food diversity & availability,
and WASH should be further improved
Stunting prevalence1
among children under 5
years
-2
0
-7
-6
2018 target2
2005 2010 2014/15
Min. Acc. Diet1 +1.
0
75.2%5
Anemia 6-59 mths1
Improved
water
+0.
4
Acceptable FCS3
74.5%4
-1.
6
+0.
7
201
02014/1
5
(2009)
(2012)
(2010/
11)
Source: 1. Rwanda DHS 2010 & DHS 2014/15 2. HSSP-3 3. CFSVA/NS 2009 & 2012 4. EICV3 2010/11 5. WATSAN 2014
79. Rwanda
Stakeholder &
Action Mapping
2014-15 -
79
Progress from 2010 to 2014/15 is far from sufficient to reach
2018 target
40
%
60
%
20
%
30
%
0
%
50
%
Rwanda stunting prevalence
18.0%
2018
target
51.0%
37.9%
24.5%
Yea
r
18.0%
-15.0
%
2014-15
33.0%
44.2%
2005
44.2%
2010
HSSP III target
trajectory
2014/15-18 target
trajectory
2005-10
actual
2005-10-14/15-18
trajectory
2010-14/15
actual
Immediate scale-up of nutrition interventions is needed
to accelerate stunting reduction
Current trajectory leads
to estimated 33% stunting
prevalence in 2018,
a 15%-point gap from
the HSSP III target
Source: Rwanda DHS 2010 & DHS 2014/15, HSSP-3
80. Rwanda
Stakeholder &
Action Mapping
2014-15 -
80
Rwanda is still far behind some of the best practice countries
in stunting reduction
Rwand
a
Brazil
Gambi
aVietna
m
Per
uMauritani
aMaharashtr
a
Countrie
s
Average Annual Rate of Reduction1
in stunting (in
%2
)
Average:
4%
AARR
Africa
average
1. Average Annual Rate of Reduction (AARR) is calculated from the 4-6 best consecutive years of reduction for each country from 1995 – 2015. 2. In %, not %-points
Note: Rwanda calculated from DHS 2010 to DHS 2014/15
Source: WHO/UNICEF/World Bank database
Backup
Other countries' success show that there is potential to
further accelerate stunting reduction in Rwanda
81. Rwanda
Stakeholder &
Action Mapping
2014-15 -
81
Agenda
Introduction, background and objectives of the Stakeholder & Action Mapping
Recap of the food and nutrition situation in Rwanda – highlights from the Nutrition Analysis
• What is the food and nutrition situation nationally?
• What is the food and nutrition situation per district?
Stakeholder & Action Mapping methodology and approach
Stakeholder & Action Mapping overview and analyses
• Who are the main stakeholders working in nutrition in Rwanda?
• What are the main programs?
• What core nutrition actions are the stakeholders working on?
• Where are they working?
• How many are they reaching?
Implications of the findings from the Stakeholder & Action Mapping
• Where and what are the gaps?
• Main recommendations and findings for scaling up
Appendix