Download as PDF, PPTX
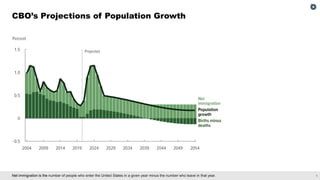

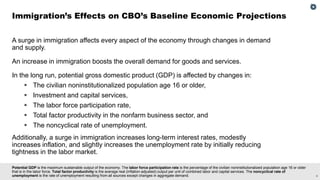
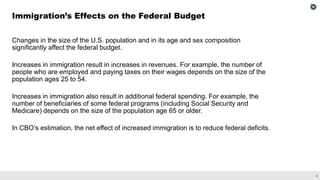
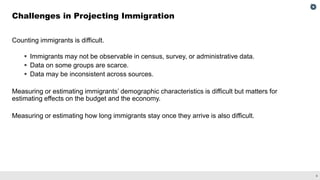
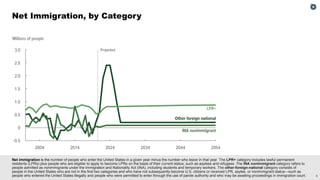
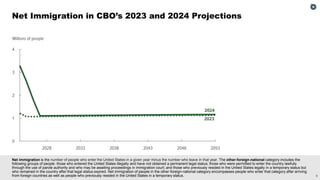
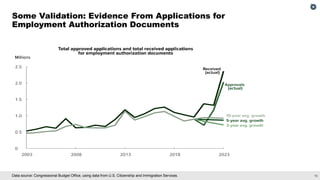


The presentation discusses the Congressional Budget Office's (CBO) immigration projections and their implications for the U.S. economy and federal budget. It highlights the significant effects of net immigration on GDP, labor force participation, and federal revenues and spending, noting that increased immigration generally reduces federal deficits. The document addresses the challenges in accurately measuring and projecting immigration data and future trends.