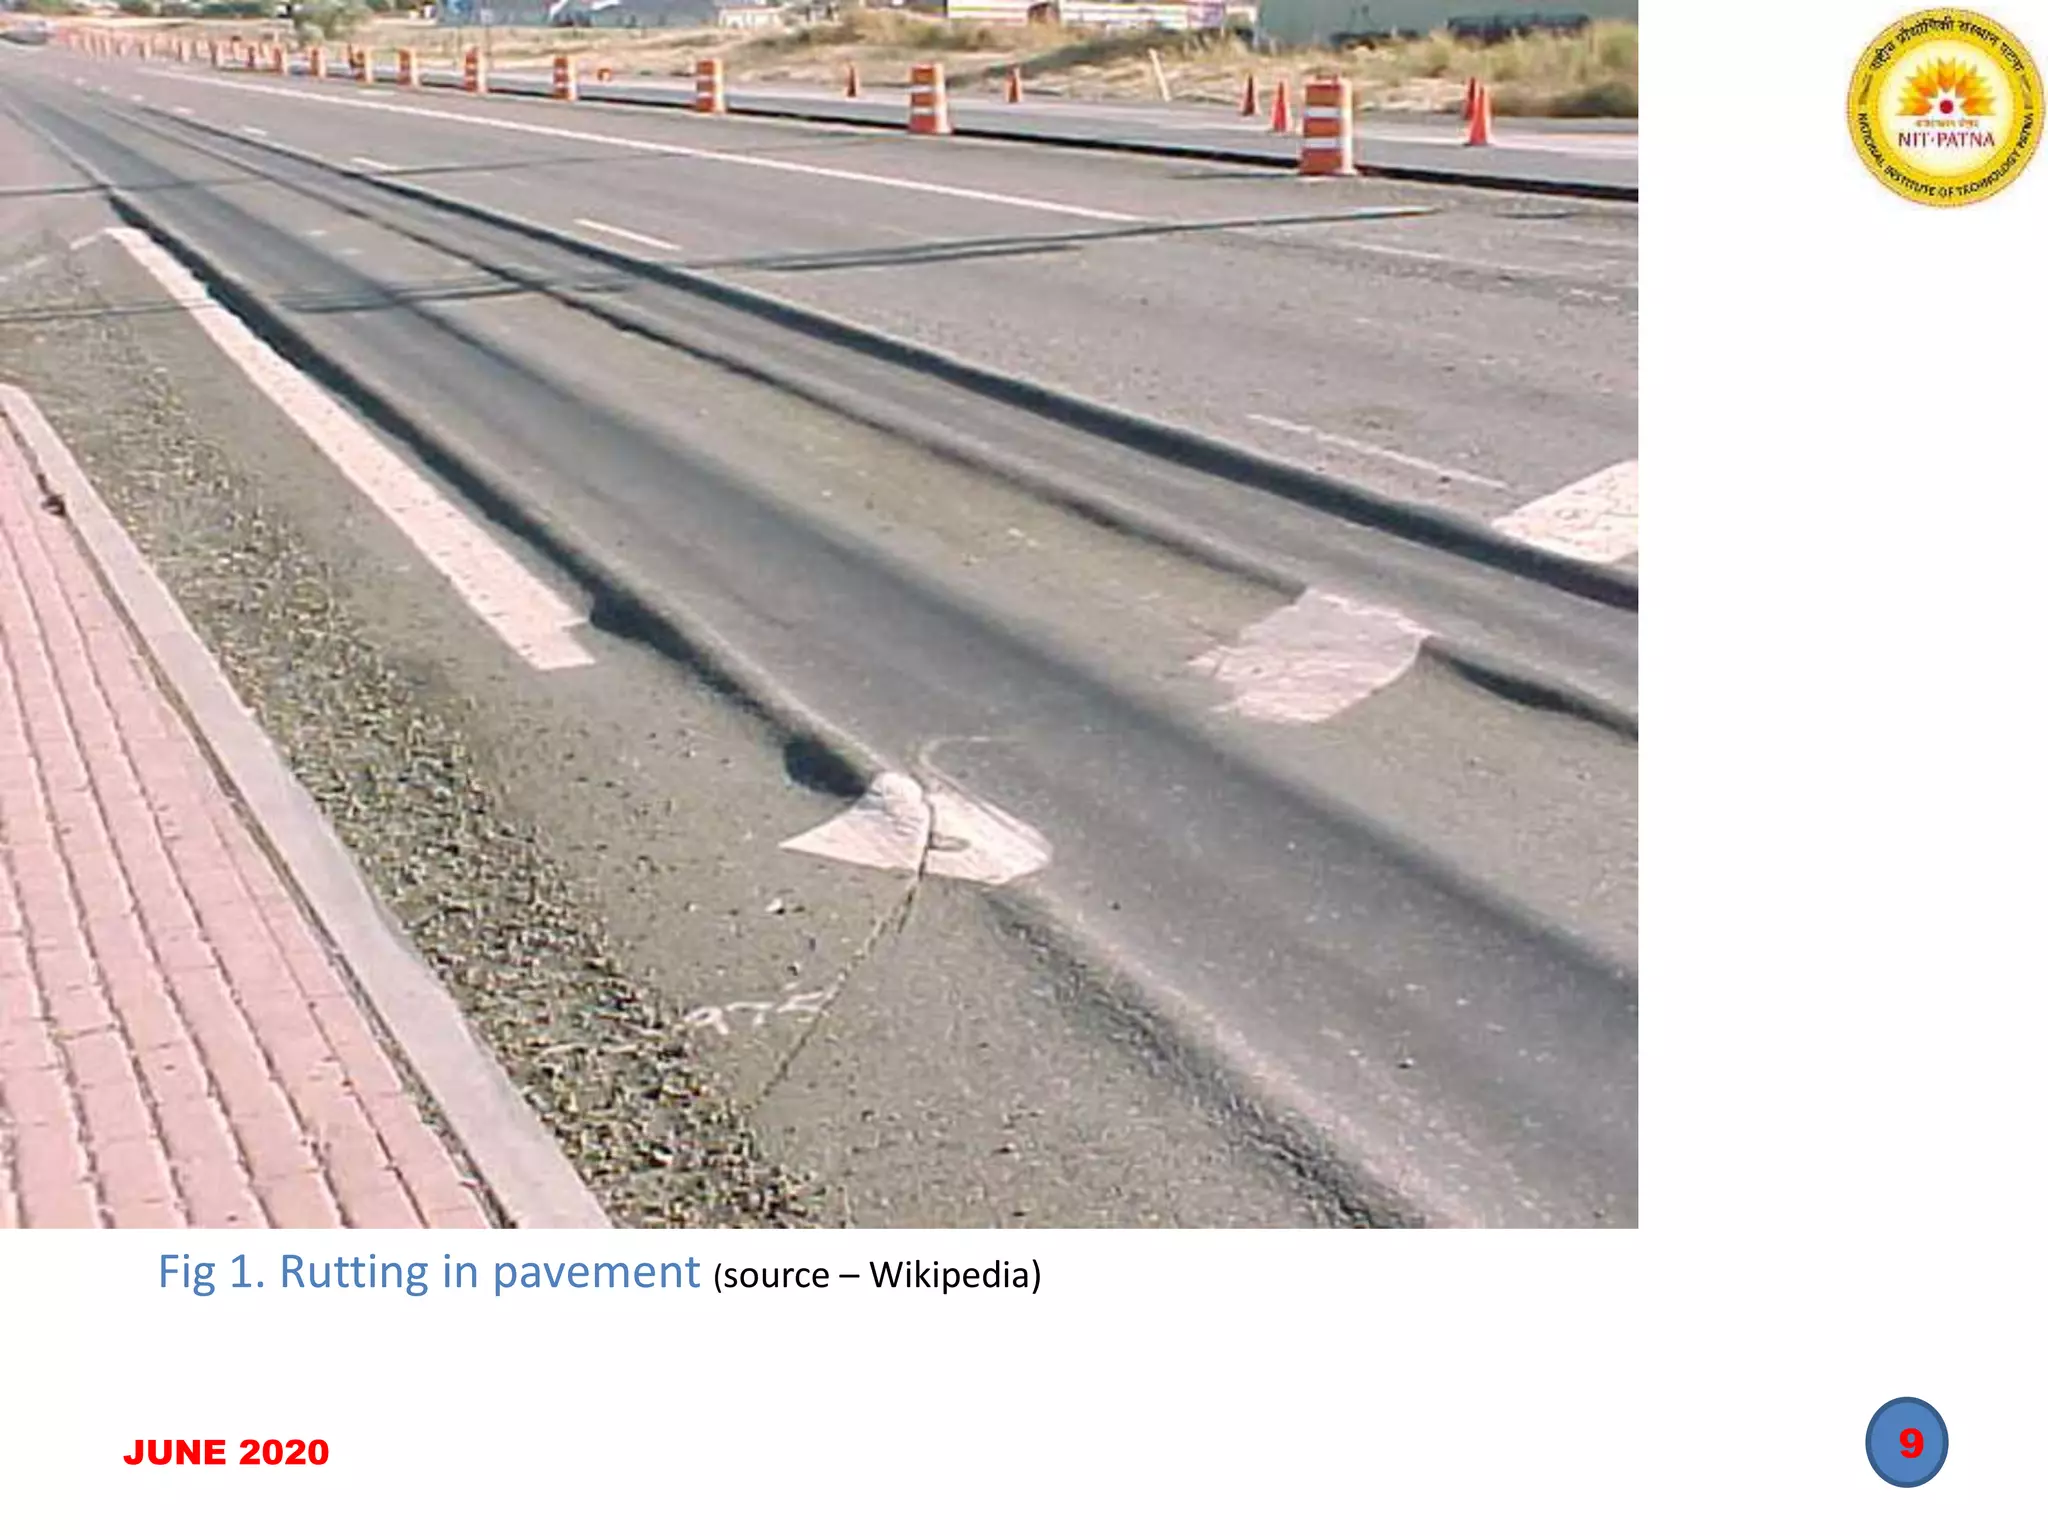
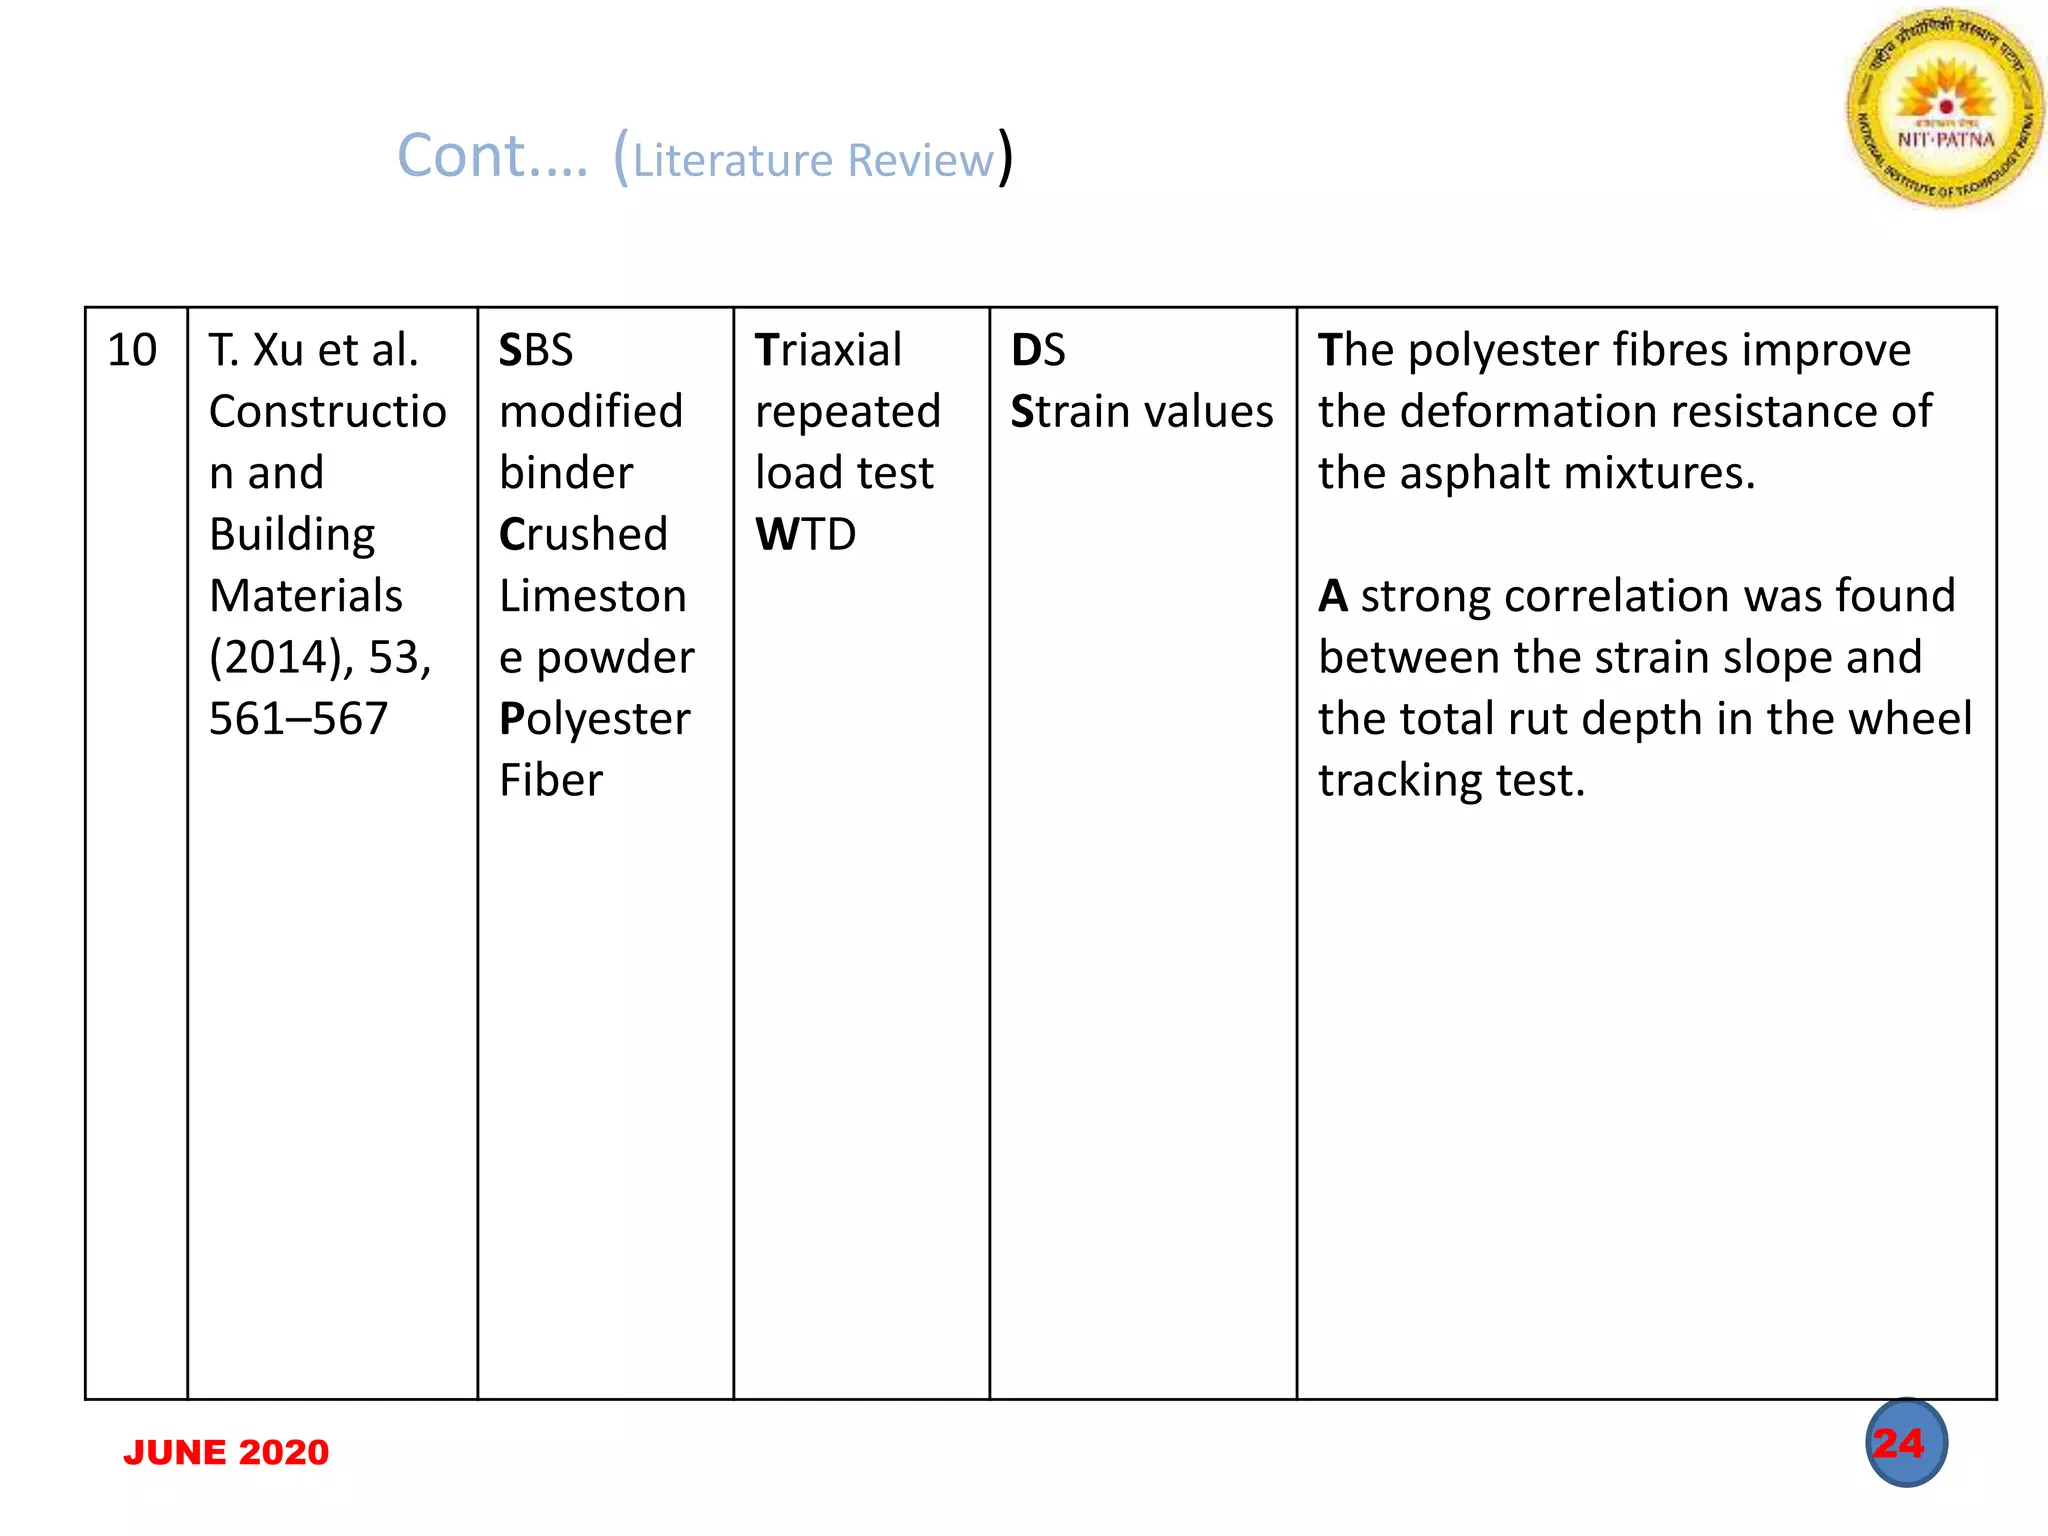
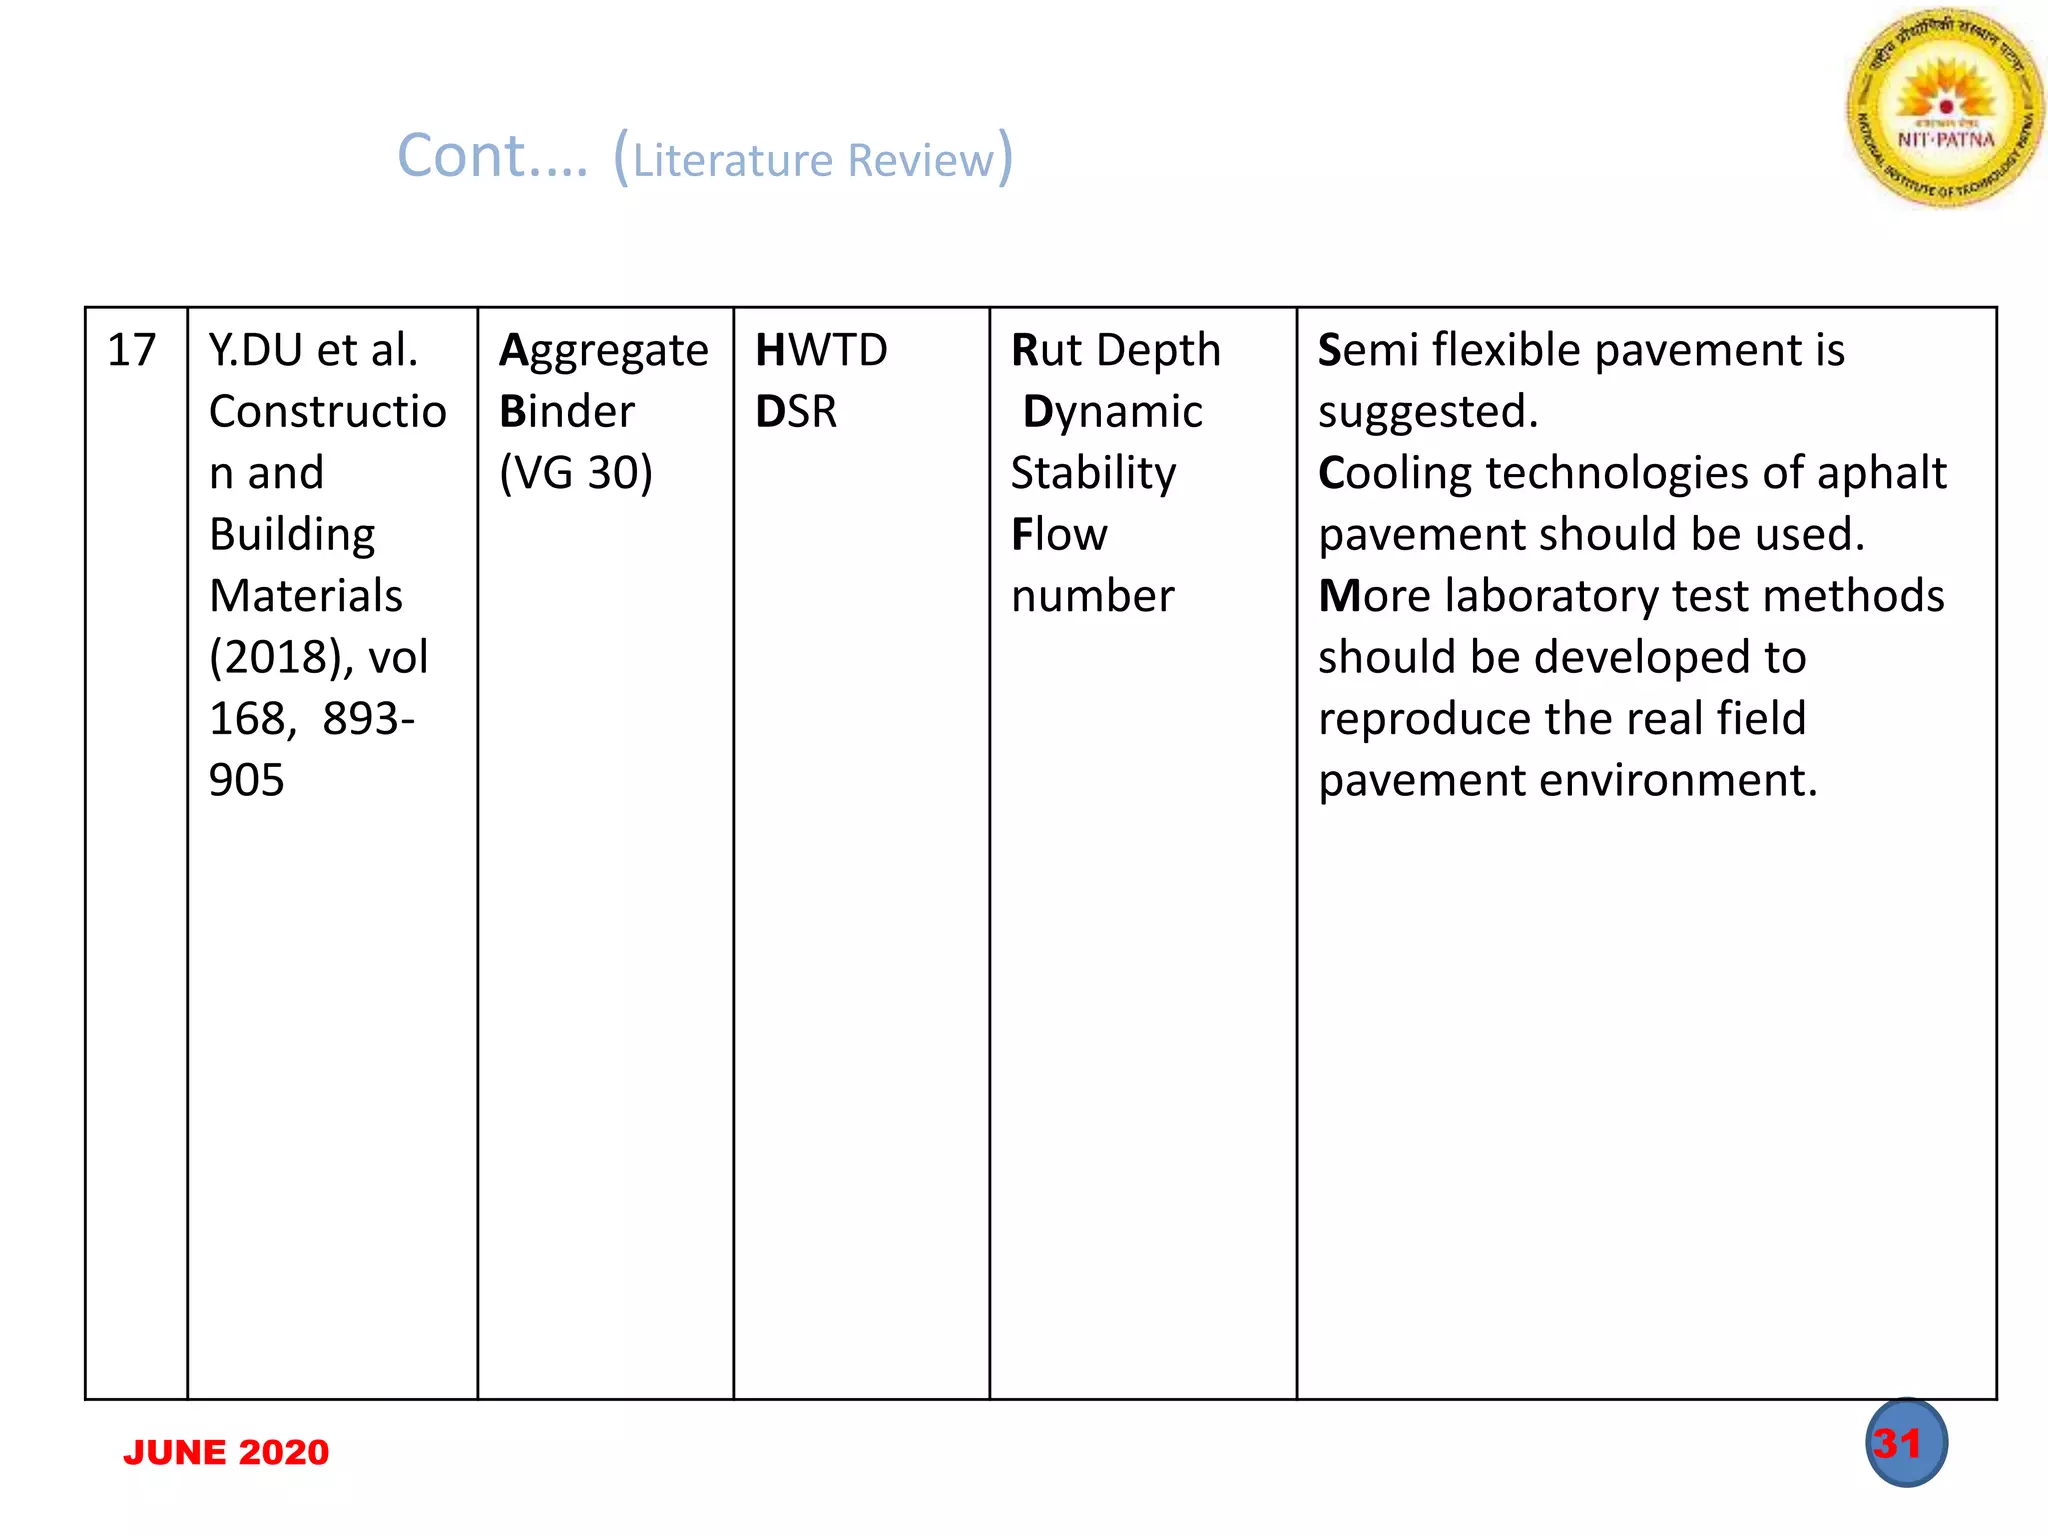
1JUNE 2020
STUDY ON RUTTING POTENTIAL OF
BITUMINOUS MIXES USING
WHEEL TRACKER DEVICE
Presented by:
AMIT KUMAR
Roll No. 1824007
TRANSPORTATION ENGG.
Under the guidance of
Dr. S.K. SUMAN
Assistant professor
NIT Patna
2JUNE 2020
CONTENTS
1 List of Acronyms
2 Introduction
3 Literature Review
4 Methods and Materials
5 Laboratory Investigation
6 Results and Discussions
7 Conclusions
8 References
3JUNE 2020
LIST OF ACRONYMS
BC
WTD
LDPE
PP
AADT
PG
RAP
AC
NMAS
CA
BC Bituminous Concrete
WTD Wheel tracker deice
LDPE Low density polyethylene
PP Polypropylene
AADT Annual average daily traffic
HMA Hot mix asphalt
RAP Reclaimed asphalt pavement
AC Asphalt concrete
NMAS Nominal maximum aggregate size
CA Course Aggregate
4JUNE 2020
Cont.… (LIST OF ACRONYMS)
SD
VFB
VMA
OBC
RD
PRD
WTS
WTR
CSI
HMA
SD Stone dust
VFB Voids filled with Bitumen
VMA Voids in mineral aggregate
OBC Optimum bitumen content
RD Rut depth
PRD Proportional Rut depth
WTS Wheel tracking slope
WTR Wheel tracking rate
CSI Complex stability index
PG Performance grade
JUNE 2020 5
INTRODUCTION
6JUNE 2020
Background
Majority of roads in India are flexible, for which bulk of
distress is either rutting or fatigue.
Rutting is a major form of distress in pavements.
It is also known as permanent settlement of pavement.
Mainly attributed to shear deformation in the upper
HMA layers.
Visible as longitudinal grooves along the wheel path.
7JUNE 2020
Heavy channelized traffic
Inadequate compaction
Improper mix design
High temperature
Poor subgrade
Rutting
Cont.… (INTRODUCTION)
8JUNE 2020
Rutting
Reduction in pavement life
Servicibility problem (hydroplaning)
Safety concerns
Uneconomical scenarios
Hindrance to Road network
Cont.… (INTRODUCTION)
9JUNE 2020
Fig 1. Rutting in pavement (source – Wikipedia)
10JUNE 2020
Fig 2. Rutting in pavement ( source – Wikipedia )
11JUNE 2020
Problem Statement
Premature failure - early and costly rehabilitation
Functional constraints
Safety concerns for road users
Economic burden on taxpayers
Hence, this subject needs to be properly addressed
through evaluation and mitigation measures so that the
occurrence and resulting impacts can be minimized.
Cont.… (INTRODUCTION)
12JUNE 2020
Scope
Cont.… (INTRODUCTION)
Studying pavement failure mode for BC mix
Minimizing failures so as to get good serviceability from
huge road assets
Systematic assessment of pavement with known design
and influencing factors
Use of waste plastic as an additive – Green roads
13JUNE 2020
Cont.… (INTRODUCTION)
Objectives
To investigate the rutting potential of BC mix (II) with and
without using waste plastic.
To compare the effectiveness of LDPE and PP waste
plastic against rutting.
To propose suitable recommendations for use of LDPE
and PP as an additive in BC mix.
JUNE 2020 14
LITERATURE REVIEW
15JUNE 2020
S.
N
AUTHOR(S)/
JOURNAL
MATERIAL EQUIPMENT PROPERTIES
/PARAMETE
R
RESULTS
1 Shahbaz
Khan et al./
Procedia
Social and
Behavioral
Sciences 104
(2013) 149-
157
Granular
material
Bitumen
LHVS
Laser
Profilometer
Falling weight
deflectometer
Mercury
thermometer
Rut depth
Modulus of
each layer
Air void
Initial average rutting
found after 5000 passes
is about 2mm.
Change(decrease) in air
voids were 0.4% for BC
and 1.626% for DBM for
rutted section.
16JUNE 2020
2 Nikhil Saboo
Praveen Kumar
J.Mater.Civil
Eng.,2016,28(7):04
016024
VG 10
binder
VG 30
binder
PMB
Aggregate
DSR
Wheel
tracking
device
Rut depth
Moisture
susceptibilit
y
Temperature
susceptibility of
elastomeric modified
bitumen is lower
compared to plastomeric
modified.
VG 10 not suitable for
extremely heavy loading
even at 50°C
VG 30 not suitable for
extremely heavy loadings
at temp greater
than/equal to 60°C.
Mixes with PMB showed
lower rut depth
compared to VG mixes.
Cont.… (Literature Review)
17JUNE 2020
3 Niya Dong et al./
Construction and
Building Materials
216(2019) 588-
598
PG 64-22
PG 70-22
Aggregate
HWTT
Thermoco
uple probe
Strain rate
Creep
stiffness
modulus
Dynamic
modulus
Rut depth
Creep rate
PG 70-22 mixes are less
temperature sensitive
and more rut resistant
than PG 64-22.
Mixes with stiffer
asphalt binder can
effectively reduce
permanent deformation
at high temperature.
For evaluation of
permanent
deformation, the
validity of the HWTT is
higher than IDT test.
Cont.… (Literature Review)
18JUNE 2020
4 Sungum Kim et al./
J.Mater.Civ.Eng.,20
18.30(2):04017280
RAP
Aggregate
HWTD No. of
laoding
passes at
failure.
Rut depth
Effect of
NMAS
RAP with larger NMAS
performed better than
those with small NMAS
in both rut and anti
stripping resistance.
As NMAS decreases rut
depth increases
regardless of source
As NMAS increased the
SIP increased for all
aggregate source.
The test temperature of
50°C was not enough to
distinguish size effects of
aggregate, 64°C and 70°C
were.
Cont.… (Literature Review)
19JUNE 2020
5 Ibrahim Sel et al./
J.Mater.Civ.Eng.,201
4,26(8):04014037
Hydrated
lime
Liquid
antistrip-
ping
additive
Binder
(PG 64-
22, PG
70-22,
PG 76-
22)
Aggregat
e
HWTD Average
deformation
Temperature
dependence
As the test temperature
increases the average
deformation increases
accordingly.
The mixes with higher PG
binder accumulates less
deformation than those with
lower grade binder
Lime performed better than
liquid and liquid performed
better than binder without
additive.
Cont.… (Literature Review)
20JUNE 2020
6 Vishnu
Radhakarishn
an et al.
Road
Materials
and
Pavement
Design, 2019
Vol. 20, No.
1, 90–109
VG30
VG40
CRMB
WTD Rut depth
Air void
For same initial air void, field
and laboratory rut depth
correlated.
Mixes with higher compaction
rutted less
Mixes with softer binder rutted
more both in filed and in
laboratory.
Higher initial air void content
produced higher rut depth.
Suitability of WTD for testing
rutting susceptibility was
demonstrated.
Cont.… (Literature Review)
21JUNE 2020
7 B. Javilla et
al.
Construction
and Building
Materials
(2017), vol
153 157–164
AC-20
Limeston
e
AC-13
Basalt
Asphalt
Mixture
SBS
Modified
Asphalt
Binder
WTD Stress
Temperature
Moisture
Limestone mixture was more
rut resistance than Basalt
mixture.
Temperature was a more
significant factor than stress.
Rutting resistance showed a
strong correlation with the
moisture content.
Primary rutting contributed a
significant percentage of the
final rutting.
Cont.… (Literature Review)
22JUNE 2020
8 B. Javilla et
al.
Construction
and Building
Materials
(2017), vol.
155, 1215–
1223
AC-13
Basalt
asphalt
mixture
AC-20
Limeston
e mixture
WTD Temperature
dependence
CSI
DS
AC-13 and AC-20 mixtures
were both temperature and
stress dependent.
Secondary rutting parameters
had higher correlation than
primary indicators.
Cont.… (Literature Review)
23JUNE 2020
9 H.A.A. Gibreil
et al.
Construction
and Building
Materials
(2017), vol
142, 101–
108
HDPE
CRP
(crumb
rubber
powder)
WTD
IDT
Marshall
test
Stability
Flow
DS
Resistance to deformation in
moderate and high
temperatures increased with
the addition of the modifiers.
Ductility reduced with
modifiers.
Temperature susceptibility
decreased with addition of
modifiers.
Modifiers improved the
stability values.
DS improved with addition of
both HDPE and CRP.
Cont.… (Literature Review)
24JUNE 2020
10 T. Xu et al.
Constructio
n and
Building
Materials
(2014), 53,
561–567
SBS
modified
binder
Crushed
Limeston
e powder
Polyester
Fiber
Triaxial
repeated
load test
WTD
DS
Strain values
The polyester fibres improve
the deformation resistance of
the asphalt mixtures.
A strong correlation was found
between the strain slope and
the total rut depth in the wheel
tracking test.
Cont.… (Literature Review)
25JUNE 2020
11 H. Ziari et
al.
Petroleum
science and
technology
2016, vol
34(9), 819-
823
PET
(Polyethyl
ene
terephtha
late)
WTD
DSR
Rut depth
Flow
number
Reduction in permanent
deformation when PET is used.
With increase in dynamic load,
the produced stresses were
absorbed with PET particles
and it led to delay in rutting
phenomenon.
Cont.… (Literature Review)
26JUNE 2020
12 G.Sarang et
al. Road
Materials
and
Pavement
Design,
2016
Vol. 17, No.
4, 933–945
VG 30
PMB 40
Lime
Waste
plastic
(polyethyl
ene and
polypropy
lene)
Marshall
test
ITS
WTD
Deformation
Stability
ITS
No stabilizing additive is
required in SMA with PMB.
PMB mix showed better
performance than SWP in
Marshall stability and tensile
strength parameters.
PMB mixes showed better
performance than SWP in both
rutting and fatigue tests .
Cont.… (Literature Review)
27JUNE 2020
13 P.
Chaturabong
Et al.
Construction
and Building
Materials
(2017), vol
146, 175–
182
VG 30
Granular
material
HWTD
AMPT
Rut depth
Total
proximity
length
Failure mechanism in the HWT
and FN test is similar.
The validity of dry HWTD in
measuring rutting resistance of
the asphalt mixture was
established.
Cont.… (Literature Review)
28JUNE 2020
14 W. Zhang et
al.
J.Mater.Civ.
Eng.,2017,2
9(9):04017
098
PG binder
Aggregate
HWTD
Binder
extractor
Falling
weight
deflectom
eter
(FWD)
Rutting
resistance
index(RRI)
Field rut depth in general
decreased with increased RRI.
HWT test results alone do not
have strong relationship with
the field rut depth. Other
factors, such as climate and
pavement structure have to be
considered.
RRI, Pavement age, AADT,
pavement structure are critical
influence factors.
Cont.… (Literature Review)
29JUNE 2020
15 H. Wang et
al.
J.Mater.Civ.
Eng.,2009,
21(4):181-
185
Aggregate
Binder
(VG 30)
HWTD Rut depth
Dynamic
stability
The asphalt intermediate
course has the greatest effect
on rut development followed
by asphalt base course.
Longitudinal grades also effects
the rutting depth.
Cont.… (Literature Review)
30JUNE 2020
16 B.Javilla et
al.
Constructio
n and
Building
Materials
153 (2017)
157-164
AC-20
limestone
AC-13
basalt
asphalt
mix
AC-25
Recycled
hot mix
asphalt
HWTD Rut depth
Dynamic
Stability
AC-13 mix were more rutting
resistance as compared to Ac-
20 mix.
Rutting rate increased
exponentially after 50°C and
greater than 1000 cycles.
Cont.… (Literature Review)
31JUNE 2020
17 Y.DU et al.
Constructio
n and
Building
Materials
(2018), vol
168, 893-
905
Aggregate
Binder
(VG 30)
HWTD
DSR
Rut Depth
Dynamic
Stability
Flow
number
Semi flexible pavement is
suggested.
Cooling technologies of aphalt
pavement should be used.
More laboratory test methods
should be developed to
reproduce the real field
pavement environment.
Cont.… (Literature Review)
32JUNE 2020
18 Quing Lu
John
T.Harvey
Transporta
tion
Research
Record
1970
Aggregate
Binder
Hydrated
lime
Anti-
stripping
agent
HWTD
LVDT
Rut depth Mixes treated with hydrated
lime showed lower rut depth
than mixes with liquid anti
stripping agents which showed
lower rut depth than untreated
mixes.
Compaction profile variability
existed which gave inconsistent
results across the sample itself.
Binders using no acid
performed well.
Cont.… (Literature Review)
JUNE 2020 33
Literature Gap
Waste plastic as an additive against rutting has been less researched.
Majorly only HDPE plastic has been investigated.
For dry WTD, fewer parameters have been examined.
JUNE 2020 34
METHODS AND MATERIALS
35JUNE 2020
Methods
Blending of aggregates as per MoRTH, 2013 for BC (II).
Trial and error method was adopted.
Characterization test for aggregates – Impact value,
Crushing value, Abrasion value, Shape test and specific
gravity.
Characterization test for binders – specific gravity,
penetration value and softening point.
Marshall Mix design – OBC
WTD – evaluation of rutting potential of conventional
and modified bituminous mixes.
36JUNE 2020
Materials
Material Source
CA (20 mm) Gaya
CA (10 mm) Gaya
Stone dust Gaya
Bitumen (VG 30) Gaya
Cement – OPC 53
Table 1: Material and their source
Cont.… (Methods and Materials)
37JUNE 2020
Plastic material Thickness (µ) Softening point (°C)
Biscuit cover 40 160-170
Milk pouch 60 100-120
Table 2: Waste plastics and their parameters.
Cont.… (Methods and Materials)
38JUNE 2020
Test Test method Result Code
specification
Specific
gravity test
IS: 1202-1978 1.0 0.98-1.01
Penetration
value test
25°C, 100 g, 5
s, (d mm)
IS: 1203-1978 68 60-70
Softening
point test (°C)
IS: 334-1982 52 50-55
Table 3: Characterization of binder.
Cont.… (Methods and Materials)
39JUNE 2020
Test Test method Result Code
specification
Aggregate
Impact value
(%)
IS: 2386 (Part
Ⅳ) 1963
8-11 <30
Aggregate
crushing value
test (%)
IS: 2386 (Part
Ⅳ)
1963
18.30 <45
Aggregate
abrasion
value test(%)
IS: 2386 (Part
Ⅳ)
1963
23.47 <30
Shape test (%) IS: 2386 (Part
Ⅰ) 1963
FE: 13
EE: 11
FE+EE < 30
Specific
gravity test
IS: 2386 (Part
Ⅳ)
1963
20mm: 2.67
10mm: 2.67
Stone dust:
2.64
2.5 - 3
Table 4: Characterization of aggregates.
Cont.… (Methods and Materials)
JUNE 2020 40
Fig. 3: Shredded milk pouch plastic (LDPE)
JUNE 2020 41
Fig. 4: Shredded biscuit cover(PP)
JUNE 2020 42
LABORATORY INVESTIGATION
43JUNE 2020
Collection of
aggregate
Collection of
bitumen
Collection of
waste plastic
Characterization tests
Blending of aggregate
OBC determination
Preparation of
conventional samples
Preparation of
modified samples
Evaluation of samples
by WTD
Comparison of
different samples
Conclusion and
recommendations
Methodology chart
44JUNE 2020
Cont.… (Laboratory Investigation)
Blending of Aggregates
Intermixing of two or more fine or coarse aggregate to
produce a combination of aggregates with improved
gradation and other properties
Materials blended were CA 20 mm, CA 10 mm, stone
dust and cement
Trial and Error method was adopted, Proportion was
varied until the required aggregate gradation was
achieved.
45JUNE 2020
Formula: P = Aa + Bb + Cc + Dd
Where,
P = % of material passing a given sieve for the blended
aggregate A (CA 20mm), B (CA 10mm), C (SD) and D
(cement).
A, B, C and D = % of material passing a given sieve for
each constituent of mix A, B, C and D.
a, b, c and d = proportion (decimal fractions) of
constituent A, B, C and D to be used in blend.
(a + b + c + d = 100)
Cont.… (Laboratory Investigation)
46JUNE 2020
Marshall Mix design
To determine OBC
Samples were prepared at 4.5%, 5%, 5.5%, 6% and 6.5%
Cont.… (Laboratory Investigation)
47JUNE 2020
Mixture components CA I, CAII, Stone
dust,Cement,Binder
Weight 1200 gms
Height 60-63 mm
Diameter 100mm
Mixing temperature 160°C
Compaction temperature 150°C
Testing temperature 60°C
Table 5: Marshall mix design
Cont.… (Laboratory Investigation)
48JUNE 2020
Optimum bitumen content (OBC) was found by taking
average value of the following three bitumen contents .
1. Bitumen content at maximum stability value.
2. Bitumen content at maximum bulk density.
3. Bitumen content at 4% air voids.
The flow value, volume of bitumen, VFB and VMA were
checked for MoRTH, 2013 specification.
Cont.… (Laboratory Investigation)
JUNE 2020 49
Fig. 5: Marshall Samples
50JUNE 2020
Wheel tracker testing
It is a laboratory arrangement to simulate the movement
of wheel on the pavement
Two types of samples were prepared – conventional and
modified with plastic waste.
Dry process was used to prepare waste plastic mix.
Test was done by two procedures – procedure A (1000
load cycles / 15 mm) and procedure B (10000 load cycles
/ 20 mm).
Cont.… (Laboratory Investigation)
JUNE 2020 51
Mixture components CA I, CA II, Stone dust, cement,
Binder
Weight 11 kgs
L X B 305mm X305mm
Height 50mm
Mixing temperature 160°C
Compaction temperature 150°C
Testing temperature 60°C
Table 6: Wheel tracker design
52JUNE 2020
Procedure A parameters
Rut depth (RD).
Proportional rut depth( PRD)
PRD = (RD/50) X 100
It is the rut depth at the end of the test
Cont.… (Laboratory Investigation)
53JUNE 2020
Wheel tracking rate ( WTR)
WTR = 3 rn + rn-1 – rn-2 – 3 rn-3 (as per EN 12697–
22:2003(E) )
Where,
n is the total number of readings taken at 100 load
cycles interval up to 1000 load cycles, excluding the
initial reading
ri is the change in vertical displacement from the initial
value, r0, to the i relevant reading, in millimeters (mm )
Cont.… (Laboratory Investigation)
54JUNE 2020
Rut resistance index (RRI)
RRI = N X (1-RD)
Where,
N = no. of cycles at the completion of test
RD = rut depth in inches at completion of test, assuming
the max allowable rut depth is below 1 inch.
Cont.… (Laboratory Investigation)
55JUNE 2020
Procedure B parameters
Rut depth (RD).
It is the rut depth at the end of the test
Proportional rut depth( PRD)
PRD = (RD/50) X 100
Cont.… (Laboratory Investigation)
56JUNE 2020
Wheel tracking slope (WTSAIR)
WTSAIR = (d10000 – d5000)
5
Where,
d5000, d10000 is the rut depth after 5000 load cycles and
10000 load cycles, in mm
Cont.… (Laboratory Investigation)
57JUNE 2020
Rut resistance index (RRI)
RRI = N X (1-RD)
Where,
N = no. of cycles at the completion of test
RD = rut depth in inches at completion of test, assuming
the max allowable rut depth is below 1 inch.
Cont.… (Laboratory Investigation)
58JUNE 2020
Dynamic stability (DS)
DS = N (t2 – t1)
(d2 – d1)
Where,
t2 = 60 minute
t1 = 45 minute
d2 = deformation at 60th minute
d1 = deformation at 45th minute
N = speed of test wheel rolling (26.8 times/minute)
Cont.… (Laboratory Investigation)
59JUNE 2020
Complex stability index (CSI)
CSI = N (t2 – t1)
d1 (d2 – d1)
Where,
t2 = 60 minute
t1 = 45 minute
d2 = deformation at 60th minute
d1 = deformation at 45th minute
N = speed of test wheel rolling (26.8 times/minute)
Cont.… (Laboratory Investigation)
60JUNE 2020
Fig. 6: Aggregates before coating
61JUNE 2020
Fig. 7: Aggregates after coating
62JUNE 2020
Fig. 8: WTD sample before testing
63JUNE 2020
Fig. 9: WTD sample after testing
64JUNE 2020
Fig. 10: WTD sample after testing at different
plastic contents.
JUNE 2020 65
Fig. 11: wheel tracker device
JUNE 2020 66
Fig. 12: Roller compactor
67JUNE 2020
Fig. 13: Wheel tracker device set-up.
JUNE 2020 68
RESULTS AND DISCUSSIONS
69JUNE 2020
Blending of Aggregates
Material % composition
20mm 17
10mm 25
SD 55
Cement 3
Table 7: Constituents and their composition
Cont.… (Results and Discussions)
70JUNE 2020
Sieve,mm lower limit,% upper limit,% Observed,%
19.00 100 100 98.97
13.20 90 100 90.64
9.50 70 88 77.31
4.75 53 71 58.31
2.36 42 58 50.55
1.18 34 48 36.06
0.60 26 38 30.94
0.30 18 28 18.38
0.15 12 20 13.89
0.075 4 10 4.78
Table 8: MoRTH , 2013 specification and observed values
Cont.… (Results and Discussions)
71JUNE 2020
0
20
40
60
80
100
120
19 13.2 9.5 4.75 2.36 1.18 0.6 0.3 0.15 0.075
%Passing
Sieve size,mm
lower limit
upper limit
observed values
Fig. 14: Gradation envelope obtained
Cont.… (Results and Discussions)
72JUNE 2020
Marshall Mix design
S.NO Properties
Bitumen content % MoRTH
specifica
tions.4.5 5.0 5.5 6.0 6.5
1 Marshall stability value, KN 9.79 11.77 12.88 10.72 10.44 Min 9
2 Flow value, mm 2.25 2.31 2.45 3.35 4.26 2-4
3 Theoretical maximum
density, gm/cc
2.43 2.41 2.39 2.37 2.35 -
4 Bulk density, gm/cc 2.28 2.29 2.30 2.28 2.27 -
5 Volume of air voids, % 5.97 5.03 4.06 3.82 3.24 3-5
6 Volume of bitumen, % 10.28 11.45 12.63 13.71 14.82 -
7 Voids in mineral aggregate, % 11.38 11.54 11.68 12.26 12.65 >15
8 Voids filled with bitumen, % 63.25 69.48 75.68 78.23 82.06 65-75
9 Optimum bitumen content 5.5 Min 5.4
Table 9: Properties of bituminous mix
JUNE 2020 73
Graphs obtained for Marshall mix design
4.00
6.00
8.00
10.00
12.00
14.00
4 4.5 5 5.5 6 6.5 7
Stability,kN
Bitumen content,%
Stability vs Bitumen content
Fig. 15: Stability vs bitumen content graph
2.00
2.50
3.00
3.50
4.00
4.50
4 4.5 5 5.5 6 6.5 7
Flow,mm
Bitumen content %
Flow vs Bitumen content
Fig. 16: Flow value vs bitumen content graph
2.275
2.280
2.285
2.290
2.295
2.300
4 4.5 5 5.5 6 6.5 7
Bulkdensity,gm/cc
Bitumen content,%
Bulk density vs Bitumen content
Fig. 17: Bulk density vs bitumen content graph
0.00
1.00
2.00
3.00
4.00
5.00
6.00
7.00
4 4.5 5 5.5 6 6.5 7VA%
Bitumen content %
VA,% vs Bitumen content
Fig. 18: air void vs bitumen content graph
JUNE 2020 74
35.00
45.00
55.00
65.00
75.00
85.00
4 4.5 5 5.5 6 6.5 7
VFB,%
Bitumen content,%
VFB,% vs Bitumen content,%
Fig. 19: VFB vs bitumen content graph
10.00
11.00
12.00
13.00
14.00
15.00
4 4.5 5 5.5 6 6.5 7
VMA%
Bitumen content,%
VMA,% vs Bitumen Content,%
Fig. 20: VMA vs bitumen content graph
JUNE 2020 75
Wheel Tracker testing
Sample
No.
RD (mm) PRD (%)
WTR(µm/
cycle)
RRI (NA)
1 4.45 8.89 2.15 824.80
2 4.14 8.28 2.08 837.00
3 4.04 8.09 1.90 840.94
4 4.19 8.38 2.04 835.04
5 4.21 8.43 2.01 834.25
6 4.37 8.74 2.15 827.95
Avg. 4.23 8.46 2.05 833.33
Table 10: Results of conventional mixes (Procedure A)
JUNE 2020 76
Sample
No.
RD (mm) PRD (%) WTSAIR
(mm/103 load
cycles)
RRI (NA) DS (load
cycles/
mm)
CSI
(load
cycles/
mm2)
1 10.43 20.87 0.506 5893.70 705.26 161.38
2 10.49 20.99 0.496 5870.07 717.85 158.81
3 10.62 21.24 0.484 5818.89 705.26 151.34
Avg. 10.51 21.03 0.495 5860.88 709.45 157.17
Table 11: Results of conventional mixes (Procedure B)
Cont.… (Results and Discussions)
JUNE 2020 77
Rutting
Parameters
Mixture Type
4% LDPE
Mix
6% LDPE
Mix
8% LDPE
Mix
10% LDPE
Mix
12% LDPE
Mix
RD (mm) 3.66 3.51 2.86 2.53 2.26
PRD (%) 7.38 7.02 5.73 5.07 4.52
WTR (µm/cycle) 1.64 1.61 1.28 1.12 1.09
RRI (NA) 854.72 861.67 887.33 900.12 911.02
Table 12: Results of LDPE modified mixes (Procedure A)
Cont.… (Results and Discussions)
JUNE 2020 78
Rutting
Parameters
Mixture Type
4% LDPE
Mix
6% LDPE
Mix
8% LDPE
Mix
10% LDPE
Mix
12% LDPE
Mix
RD (mm) 8.17 7.30 6.41 5.64 5.02
PRD (%) 16.35 14.6 12.83 11.28 10.04
WTSAIR,(mm/103
load cycles)
0.368 0.337 0.295 0.259 0.230
RRI (NA) 6780.83 7126.08 7437.74 7779.52 8023.62
DS (load
cycles/mm)
928.13 1068.43 1257.06 1405.02 1608.00
CSI (load
cycles/mm2)
248.59 320.92 424.64 542.56 696.24
Table 13: Results of LDPE modified mixes (Procedure B)
Cont.… (Results and Discussions)
JUNE 2020 79
Table 14: Results of PP modified mixes (Procedure A)
Rutting
Parameters
Mixture Type
4% PP
Mix
6% PP
Mix
8% PP
Mix
10% PP
Mix
12% PP
Mix
RD (mm) 3.85 3.74 3.44 2.94 2.54
PRD (%) 7.71 7.48 6.88 5.88 5.09
WTR (µm/cycle) 1.83 1.85 1.64 1.31 1.19
RRI (NA) 848.15 852.75 864.56 884.24 899.73
Cont.… (Results and Discussions)
JUNE 2020 80
Table 15: Results of PP modified mixes (Procedure B)
Rutting
Parameters
Mixture Type
4% PP
Mix
6% PP
Mix
8% PP
Mix
10% PP
Mix
12% PP
Mix
RD (mm) 9.15 8.41 8.07 7.59 6.18
PRD (%) 18.31 16.83 16.15 15.18 12.37
WTSAIR,(mm/103
load cycles)
0.426 0.394 0.376 0.355 0.288
RRI (NA) 6395.01 6686.40 6820.20 7010.40 7624.67
DS (load
cycles/mm)
764.10 874.01 880.38 973.09 1118.97
CSI (load
cycles/mm2)
190.25 235.15 247.05 290.90 412.21
Cont.… (Results and Discussions)
JUNE 2020 81
Rutting
Parameters
Mixture Type
Conv.
Mix
4% LDPE
Mix
6% LDPE
Mix
8% LDPE
Mix
10%
LDPE
Mix
12%
LDPE
Mix
RD (mm) 4.23 3.66 3.51 2.86 2.53 2.26
PRD (%) 8.46 7.38 7.02 5.73 5.07 4.52
WTR
(µm/cycle)
2.05 1.64 1.61 1.28 1.12 1.09
RRI (NA) 833.3 854.72 861.67 887.33 900.12 911.02
Table 16: Comparison between Conv. and LDPE modified mixes(Procedure A)
Cont.… (Results and Discussions)
JUNE 2020 82
4.23
3.66 3.51
2.86
2.53 2.26
0.00
1.00
2.00
3.00
4.00
5.00
CONV MIX 4% LDPE 6% LDPE 8% LDPE 10% LDPE 12% LDPE
Rutdepth(mm)
Type of mix
Rut depth at 1000 load cycles
Fig. 21: Rut depth at 1000 load cycles for conv. and LDPE modified mixes
2.05
1.64 1.61
1.28
1.12 1.09
0.00
0.50
1.00
1.50
2.00
2.50
CONV MIX 4% LDPE 6% LDPE 8% LDPE 10% LDPE 12% LDPE
WTR(µm/loadcycle)
Type of Mix
Wheel Tracking Rate
Fig. 22: Wheel Tracking rate for conv. and LDPE modified mixes
JUNE 2020 83
833.33
854.72 861.67
887.13
900.12
911.02
780
800
820
840
860
880
900
920
940
CONV MIX 4% LDPE 6% LDPE 8% LDPE 10% LDPE 12% LDPE
RRI
Type of mix
Rut Resistance Index
Fig. 23: Rut resistance index for conv. and LDPE modified mixes
Rut depth reduction nearly 40%
Wheel tracking rate reduction by nearly 39%
RRI surged by 10%
JUNE 2020 84
Rutting
Parameters
Mixture Type
Conv.
Mix
4% LDPE
Mix
6% LDPE
Mix
8% LDPE
Mix
10% LDPE
Mix
12% LDPE
Mix
RD (mm) 10.51 8.17 7.30 6.41 5.64 5.02
PRD (%) 21.03 16.35 14.6 12.83 11.28 10.04
WTSAIR,(mm/
103 load
cycles)
0.495 0.368 0.337 0.295 0.259 0.230
RRI (NA) 5860.88 6780.83 7126.08 7437.74 7779.52 8023.62
DS (load
cycles/mm)
709.45 928.13 1068.43 1257.06 1405.02 1608.00
CSI (load
cycles/mm2)
157.17 248.59 320.92 424.64 542.56 696.24
Table 17: Comparison between Conv. and LDPE modified mixes(Procedure B)
Cont.… (Results and Discussions)
JUNE 2020 85
10.51
8.17
7.3
6.41
5.64 5.02
0
2
4
6
8
10
12
CONV MIX 4% LDPE 6% LDPE 8% LDPE 10% LDPE 12% LDPE
Rutdepth(mm)
Type of mix
Rut depth at 10000 load cycles
Fig. 24: Rut depth at 10000 load cycles for conv. and LDPE modified mixes
0.495
0.368 0.337
0.295
0.259 0.23
0
0.1
0.2
0.3
0.4
0.5
0.6
CONV MIX 4% LDPE 6% LDPE 8% LDPE 10% LDPE 12% LDPE
WTSair(mm/10^3load
cycles)
Type of mix
Wheel Tracking slope
Fig. 25: Wheel tracking slope for conv. and LDPE modified mixes
JUNE 2020 86
5860.88
6780.83 7126.08 7473.74 7779.52 8023.62
0
2000
4000
6000
8000
10000
CONV MIX 4% LDPE 6% LDPE 8% LDPE 10% LDPE 12% LDPE
RRI
Type of mix
Rut resistance index
Fig. 26: Rut resistance index for conv. and LDPE modified mixes
709.45
928.13
1068.43
1257.06
1405.02
1608
0
500
1000
1500
2000
CONV MIX 4% LDPE 6% LDPE 8% LDPE 10% LDPE 12% LDPE
DS(loadcycle/mm)
Type of mix
Dynamic stability
Fig. 27: Dynamic stability for conv. and LDPE modified mixes
JUNE 2020 87
157.17
248.59
320.92
424.64
542.56
696.24
0
200
400
600
800
CONV MIX 4% LDPE 6% LDPE 8% LDPE 10% LDPE 12% LDPE
CSI(loadcycles/mm^2)
Type of mix
Complex stability index
Fig. 28: Complex stability Index for conv. and LDPE modified mixes
Rut depth and slope reduction of almost 50%
DS and CSI displayed considerable improvement
RRI improved by nearly 30%
JUNE 2020 88
Table 18: Comparison between Conv. and PP modified mixes(Procedure A)
Rutting
Parameters
Mixture Type
Conv.
Mix
4% PP
Mix
6% PP
Mix
8% PP
Mix
10% PP
Mix
12% PP
Mix
RD (mm) 4.23 3.85 3.74 3.44 2.94 2.54
PRD (%) 8.46 7.71 7.48 6.88 5.88 5.09
WTR
(µm/cycle)
2.05 1.83 1.85 1.64 1.31 1.19
RRI (NA) 833.33 848.15 852.75 864.56 884.24 899.73
Cont.… (Results and Discussions)
JUNE 2020 89
Fig. 29: Rut depth at 1000 load cycles for conv. and PP modified mixes
4.23
3.85 3.74
3.44
2.94
2.54
0.00
1.00
2.00
3.00
4.00
5.00
CONV MIX 4% PP 6% PP 8% PP 10% PP 12% PP
Rutdepth(mm)
Type of mix
Rut depth at 1000 load cycles
2.05
1.83 1.85
1.64
1.31 1.19
0.00
0.50
1.00
1.50
2.00
2.50
CONV MIX 4% PP 6% PP 8% PP 10% PP 12% PP
WTR(µm/cycle)
Type of mix
Wheel tracking rate
Fig. 30: Wheel tracking rate for conv. and PP modified mixes
JUNE 2020 90
833.33
848.15 852.75
864.56
884.24
899.73
780
800
820
840
860
880
900
920
CONV MIX 4% PP 6% PP 8% PP 10% PP 12% PP
RRI
Type of Mix
Rut resistance index
Fig. 31: Rut resistance index for conv. and PP modified mixes
Rut depth reduction of nearly 35%
WTR dropped around 38%
RRI value increased up to 8%
JUNE 2020 91
Rutting
Parameters
Mixture Type
Conv.
Mix
4% PP
Mix
6% PP
Mix
8% PP
Mix
10% PP
Mix
12% PP
Mix
RD (mm) 10.51 9.15 8.41 8.07 7.59 6.18
PRD (%) 21.03 18.31 16.83 16.15 15.18 12.37
WTSAIR,(mm/
103 load
cycles)
0.495 0.426 0.394 0.376 0.355 0.288
RRI (NA) 5860.88 6395.01 6686.40 6820.20 7010.40 7624.67
DS (load
cycles/mm)
709.45 764.10 874.01 880.38 973.09 1118.97
CSI (load
cycles/mm2)
157.17 190.25 235.15 247.05 290.90 412.21
Table 19: Comparison between Conv. and PP modified mixes(Procedure B)
Cont.… (Results and Discussions)
JUNE 2020 92
10.51
9.15
8.41 8.07 7.59
6.18
0
2
4
6
8
10
12
CONV MIX 4% PP 6% PP 8% PP 10% PP 12% PP
Rutdepth(mm)
Type of mix
Rut depth at 10000 load cycle
Fig. 32: Rut depth at 1000 load cycles for conv. and PP modified mixes
0.495
0.426 0.394 0.376 0.355
0.288
0
0.1
0.2
0.3
0.4
0.5
0.6
CONV MIX 4% PP 6% PP 8% PP 10% PP 12% PP
WTSair(mm/10^3load
cycles)
Type of mix
Wheel tracking slope
Fig. 33: Wheel tracking slope for conv. and PP modified mixes
JUNE 2020 93
5860.88 6395.01 6686.4 6820.2 7010.49
7624.67
0
2000
4000
6000
8000
10000
CONV MIX 4% PP 6% PP 8% PP 10% PP 12% PP
RRI
Type of mix
Rut resistance index
Fig. 34: Rut resistance index for conv. and PP modified mixes
709.45 764.1
874.01 880.38
973.09
1118.97
0
200
400
600
800
1000
1200
CONV MIX 4% PP 6% PP 8% PP 10% PP 12% PP
DS(loadcycle/mm)
Type of mix
Dynamic stability
Fig. 35: Dynamic stability for conv. and PP modified mixes
JUNE 2020 94
157.17
190.25
235.15 247.05
290.9
412.21
0
100
200
300
400
500
CONV MIX 4% PP 6% PP 8% PP 10% PP 12% PP
CSI(loadcyckle/mm^2)
Type of mix
Complex stability index
Fig. 36: Complex stability index for conv. and PP modified mixes
Rut depth and slope value went down by almost 40%
RRI showed 25% improvement.
Considerable improvement in DS and CSI values
JUNE 2020 95
Rutting
Parameters
Mixture Type
4% 6% 8% 10% 12%
LDPE PP LDPE PP LDPE PP LDPE PP LDPE PP
Rut depth (mm) 3.66 3.85 3.51 3.74 2.86 3.44 2.53 2.94 2.26 2.54
PRD (%) 7.38 7.71 7.02 7.48 5.73 6.88 5.07 5.88 4.52 5.09
WTR (µm/cycle) 1.64 1.83 1.61 1.85 1.28 1.64 1.12 1.31 1.09 1.19
RRI (NA) 854.
72
848.
15
861.
67
852.
75
887.
13
864.
56
900.
12
884.
24
911.
02
899.
73
Table 20: Comparison between LDPE and PP modified mixes(Procedure A)
Cont.… (Results and Discussions)
JUNE 2020 96
3.66 3.51
2.86
2.53
2.26
3.85 3.74
3.44
2.94
2.54
0.00
1.00
2.00
3.00
4.00
5.00
4% MIX 6% MIX 8% MIX 10% MIX 12% MIX
RD(mm)
Type of mix
Rut depth
LDPE
PP
Fig. 37: Rut depth at 1000 load cycles for LDPE and PP modified mixes
1.64 1.61
1.28
1.12 1.09
1.83 1.85
1.64
1.31
1.19
0.00
0.50
1.00
1.50
2.00
4% MIX 6% MIX 8% MIX 10% MIX 12% MIX
WTR(µm/cycle)
Type of mix
Wheel tracking rate
LDPE
PP
Fig. 38: Wheel tracking rate for LDPE and PP modified mixes
JUNE 2020 97
854.72
861.67
887.13
900.12
911.02
848.15 852.75
864.56
884.24
899.73
800.00
820.00
840.00
860.00
880.00
900.00
920.00
4% MIX 6% MIX 8% MIX 10% MIX 12% MIX
RRI
Type of mix
Rut resistance index
LDPE
PP
Fig. 39: Rut resistance index for LDPE and PP modified mixes
On an average, LDPE samples demonstrated 10% lower rut depth.
LDPE sample had 15% lower WTR values.
RRI values obtained for both the samples were almost similar.
JUNE 2020 98
Rutting
parameters
Mixture Type
4% 6% 8% 10% 12%
LDPE PP LDPE PP LDPE PP LDPE PP LDPE PP
RD (mm) 8.17 9.15 7.30 8.41 6.41 8.07 5.64 7.59 5.02 6.18
PRD (%) 16.35 18.31 14.6 16.83 12.83 16.15 11.28 15.18 10.04 12.37
WTSAIR
(mm/103 load
cycles)
0.368 0.426 0.337 0.394 0.295 0.376 0.259 0.355 0.230 0.288
RRI (NA) 6780.83 6395.01 7126.08 6686.40 7473.74 6820.20 7779.52 7010.49 8023.62 7624.67
DS (load
cycles/mm)
928.13 764.10 1068.43 874.01 1257.06 880.38 1405.02 973.04 1608.00 1118.97
CSI (load
cycles/mm2)
248.59 190.25 320.92 235.15 424.64 247.05 542.56 290.90 696.24 412.21
Table 21: Comparison between LDPE and PP modified mixes(Procedure B)
Cont.… (Results and Discussions)
JUNE 2020 99
Fig. 40: Rut depth at 10000 load cycles for LDPE and PP modified mixes
8.17
7.30
6.41
5.64
5.02
9.15
8.41 8.07
7.59
6.18
0.00
2.00
4.00
6.00
8.00
10.00
4% MIX 6% MIX 8% MIX 10% MIX 12% MIX
RD(mm)
Type of mix
Rut depth
LDPE
PP
0.368
0.337
0.295
0.259
0.230
0.426
0.394 0.376 0.355
0.288
0.000
0.100
0.200
0.300
0.400
0.500
4% MIX 6% MIX 8% MIX 10% MIX 12% MIX
WTSair(mm/10^3loadcycle)
Type of mix
Wheel tracking slope
LDPE
PP
Fig. 41: Wheel tracking slope for LDPE and PP modified mixes
JUNE 2020 100
6780.83
7126.08
7473.74
7779.52
8023.62
6395.01
6686.40
6820.20
7010.49
7642.67
0.00
2000.00
4000.00
6000.00
8000.00
10000.00
4% MIX 6% MIX 8% MIX 10% MIX 12% MIX
RRI
Type of mix
Rut resistance index
LDPE
PP
Fig. 42: Rut resistance index for LDPE and PP modified mixes
928.13
1068.43
1257.06
1405.02
1608.00
764.10
847.01
880.38
973.09
1118.97
0.00
500.00
1000.00
1500.00
2000.00
4% MIX 6% MIX 8% MIX 10% MIX 12% MIX
DS(loadcycles/mm)
Type of mix
Dynamic stability
LDPE
PP
Fig. 43: Dynamic stability for LDPE and PP modified mixes
JUNE 2020 101
248.59
320.92
424.64
542.56
696.24
190.25
235.15
247.05
290.90
412.21
0.00
200.00
400.00
600.00
800.00
4% MIX 6% MIX 8% MIX 10% MIX 12% MIX
CSI(loadcycles/mm^2)
Type of mix
Complex stability index
LDPE
PP
Fig. 44: Complex stability index index for LDPE and PP modified mixes
LDPE samples produced around 15% lower rut depth.
Slope value of LDPE was nearly 18% lower than PP mix.
RRI values differed by around 7%
DS and CSI value for LDPE were around 30% higher than PP mixes.
JUNE 2020 102
CONCLUSIONS
JUNE 2020 103
Rutting depth decreased on adding plastic as an additive.
Rut depth varied inversely with plastic content.
Parameters such as WTR, WTS, RRI, DS and CSI showed improved
performance on mixing plastic.
LDPE plastic demonstrated better performance than PP plastic.
Suitability of wheel tracker device to assess rutting potential has been
established in this research.
Cont.… (Conclusions)
JUNE 2020 104
Cont.… (Conclusions)
Recommendations
Maximum improvement was observed for 8-10% plastic content. Therefore,
the optimum percentage of plastic content is 8-10% by weight of bitumen.
LDPE mix demonstrated around 15% better performance than PP mix.
Therefore, it is a better additive.
JUNE 2020 105
Future scope of work
Other plastics such as PET, PVC, PS etc. should also investigated for their
efficacy as an additive.
Similar research for DBM mix.
Cont.… (Conclusions)
Air void ratio of samples should be examined for better correlation
JUNE 2020 106
REFERENCES
JUNE 2020 107
Banerjee, A., Smit, A.F. and Prozzi, J.A. (2012). "Influence of operational tolerances on HMA performance." Construction
and Building Materials , 27, 15-23.
Brovelli, C., Crispino, M., Pais, J. and Pereira, P. (2015). "Using polymers to improve the rutting resistance of asphalt
concrete." Construction and Building Materials , 77, 117-123
Chaturabong, P. and Bahia, H.U. (2017). "Mechanisms of asphalt mixture rutting in the dry Hamburg Wheel Tracking test
and the potential to be alternative test in measuring rutting resistance.“ Construction and Building Materials , 146, 175-182
Doh, Y.S., Yun, K.K., Amirkhanian, S.N. and Kim, K.W. (2007). "Framework for developing a static strength test for measuring
deformation resistance of asphalt concrete mixtures". Construction and Building Materials , 21, 2047-2058.
Dong, N., Fujian, Ni., Zhou, L. and Mab, X. (2016). "Comparison of the Hamburg, indirect tensile, and multi-sequenced
repeated load tests for evaluation of HMA rutting resistance.". Construction and Building Materials , 216, 588-598.
Fakhri, M. and Hosseini, S.A. (2017). "Laboratory evaluation of rutting and moisture damage resistance of glass fiber
modified warm mix asphalt incorporating high RAP proportion.". Construction and Building Materials , 134, 626-640.
Gibreil, H.A.A. and Fang, C.P. (2017). "Effects of high-density polyethylene and crumb rubber powder as modifiers on
properties of hot mix asphalt". Construction and Building Materials , 142, 101-108.
Grebenschikov, S. and Prozzi, J.A. (2011). "Enhancing Mechanistic Empirical Pavement Design Guide Rutting Performance
Predictions with Hamburg Wheel-Tracking Results.". Journal of the Transportation Research Board (pp. 111-118).
Washington D.C. Transportation Research Record
EN 12697 -22 (2003). Bituminous mixtures - Test methods for hot mix asphalt - Part 22: Wheel tracking.
EN 12697 -33 (2003). Bituminous mixtures - Test methods for hot mix asphalt - Part 33: Specimen prepared by roller
compactor
IRC: SP:98 (2013). Guidelines for the use of waste plastic in hot bituminous mixes (dry process) in wearing courses
Javilla, B., Fang, H., Mo, L., Shu, B. and Wu, S. (2017). "Test evaluation of rutting performance indicators of asphalt
mixtures". Construction and Building Materials , 155, 1215-1223
JUNE 2020 108
Khan, S., Nagabhusana, M.N., Tiwari, D. and Jain, P.K. (2013). "Rutting in Flexible Pavement: An approach of evaluation
with Accelerated Pavement Testing Facility.".Procedia - Social and Behavioral Sciences , 104, 149-157.
Lu, Q. and Harvey, J.T. (2006). "Evaluation of Hamburg Wheel-Tracking Device Test with Laboratory and Field Performance
Data.".Journal of the Transportation Research Board (pp. 25-44). Washington D.C: Transportation Research Record.
Lv, Q., Huang, W., Sadek, W., Xiao, F. and Yan, C. (2019). "Investigation of the rutting performance of various modified
asphalt mixtures using the Hamburg Wheel-Tracking Device test and Multiple Stress Creep Recovery test." Construction
and Building Materials , 206, 62-70.
Radhakrishnan, V., Chowdari, G.S., Reddy, K.S. and Chattaraj, R. (2019). "Evaluation of wheel tracking and field rutting
susceptibility of dense bituminous mixes". Road Materials and Pavement Design , 20 (1), 90-109.
Saboo, N. and Kumar, P. (2016). "Analysis of Different Test Methods for Quantifying Rutting Susceptibility of Asphalt
Binders.“ J. Mater. Civ. Eng. , 28 (7), (1-8).
Tsai, B., Coleri, E., Harvey, J.T. and Monismith, C.L. (2016). "Evaluation of AASHTO T 324 Hamburg-Wheel Track Device
test.". Construction and Building Materials , 114, 248-260.
Wang, H., Zhang, Q. and Tan, J. (2009). "Investigation of Layer Contributions to Asphalt Pavement Rutting." J. Mater. Civ.
Eng , 21 (4), 181-185.
Xu, T., Wang, H., Li, Z. and Zhao, Y. (2014). "Evaluation of permanent deformation of asphalt mixtures using different
laboratory performance tests". Construction and Building Materials , 53, 561-567.
Yinfei, D., Jiaqi, C., Zheng, H. and Weizheng, L. (2018). "A review on solutions for improving rutting resistance of asphalt
pavement and test methods." Construction and Building Materials , 168, 893-905.
Zhang, W., Shen, S., Wu, S. and Mohammad, L.N. (2017). "Prediction Model for Field Rut Depth of Asphalt Pavement Based
on Hamburg Wheel Tracking Test Properties." J. Mater. Civ. Eng , 29 (9), 1-10.
Ziari, H., Kaliji, A.G. and Babagoli, R. (2016). "Laboratory evaluation of the effect of waste plastic bottle (PET) on rutting
performance of hotmix asphalt mixtures". Petroleum science amd technology , 34, 819-823.
109JUNE 2020
THANK YOU 
PRESENTED BY:
AMIT KUMAR
ROLL NO. 1824007

Rutting in pavement + waste plastic

  • 1.
    1JUNE 2020 STUDY ONRUTTING POTENTIAL OF BITUMINOUS MIXES USING WHEEL TRACKER DEVICE Presented by: AMIT KUMAR Roll No. 1824007 TRANSPORTATION ENGG. Under the guidance of Dr. S.K. SUMAN Assistant professor NIT Patna
  • 2.
    2JUNE 2020 CONTENTS 1 Listof Acronyms 2 Introduction 3 Literature Review 4 Methods and Materials 5 Laboratory Investigation 6 Results and Discussions 7 Conclusions 8 References
  • 3.
    3JUNE 2020 LIST OFACRONYMS BC WTD LDPE PP AADT PG RAP AC NMAS CA BC Bituminous Concrete WTD Wheel tracker deice LDPE Low density polyethylene PP Polypropylene AADT Annual average daily traffic HMA Hot mix asphalt RAP Reclaimed asphalt pavement AC Asphalt concrete NMAS Nominal maximum aggregate size CA Course Aggregate
  • 4.
    4JUNE 2020 Cont.… (LISTOF ACRONYMS) SD VFB VMA OBC RD PRD WTS WTR CSI HMA SD Stone dust VFB Voids filled with Bitumen VMA Voids in mineral aggregate OBC Optimum bitumen content RD Rut depth PRD Proportional Rut depth WTS Wheel tracking slope WTR Wheel tracking rate CSI Complex stability index PG Performance grade
  • 5.
  • 6.
    6JUNE 2020 Background Majority ofroads in India are flexible, for which bulk of distress is either rutting or fatigue. Rutting is a major form of distress in pavements. It is also known as permanent settlement of pavement. Mainly attributed to shear deformation in the upper HMA layers. Visible as longitudinal grooves along the wheel path.
  • 7.
    7JUNE 2020 Heavy channelizedtraffic Inadequate compaction Improper mix design High temperature Poor subgrade Rutting Cont.… (INTRODUCTION)
  • 8.
    8JUNE 2020 Rutting Reduction inpavement life Servicibility problem (hydroplaning) Safety concerns Uneconomical scenarios Hindrance to Road network Cont.… (INTRODUCTION)
  • 9.
    9JUNE 2020 Fig 1.Rutting in pavement (source – Wikipedia)
  • 10.
    10JUNE 2020 Fig 2.Rutting in pavement ( source – Wikipedia )
  • 11.
    11JUNE 2020 Problem Statement Prematurefailure - early and costly rehabilitation Functional constraints Safety concerns for road users Economic burden on taxpayers Hence, this subject needs to be properly addressed through evaluation and mitigation measures so that the occurrence and resulting impacts can be minimized. Cont.… (INTRODUCTION)
  • 12.
    12JUNE 2020 Scope Cont.… (INTRODUCTION) Studyingpavement failure mode for BC mix Minimizing failures so as to get good serviceability from huge road assets Systematic assessment of pavement with known design and influencing factors Use of waste plastic as an additive – Green roads
  • 13.
    13JUNE 2020 Cont.… (INTRODUCTION) Objectives Toinvestigate the rutting potential of BC mix (II) with and without using waste plastic. To compare the effectiveness of LDPE and PP waste plastic against rutting. To propose suitable recommendations for use of LDPE and PP as an additive in BC mix.
  • 14.
  • 15.
    15JUNE 2020 S. N AUTHOR(S)/ JOURNAL MATERIAL EQUIPMENTPROPERTIES /PARAMETE R RESULTS 1 Shahbaz Khan et al./ Procedia Social and Behavioral Sciences 104 (2013) 149- 157 Granular material Bitumen LHVS Laser Profilometer Falling weight deflectometer Mercury thermometer Rut depth Modulus of each layer Air void Initial average rutting found after 5000 passes is about 2mm. Change(decrease) in air voids were 0.4% for BC and 1.626% for DBM for rutted section.
  • 16.
    16JUNE 2020 2 NikhilSaboo Praveen Kumar J.Mater.Civil Eng.,2016,28(7):04 016024 VG 10 binder VG 30 binder PMB Aggregate DSR Wheel tracking device Rut depth Moisture susceptibilit y Temperature susceptibility of elastomeric modified bitumen is lower compared to plastomeric modified. VG 10 not suitable for extremely heavy loading even at 50°C VG 30 not suitable for extremely heavy loadings at temp greater than/equal to 60°C. Mixes with PMB showed lower rut depth compared to VG mixes. Cont.… (Literature Review)
  • 17.
    17JUNE 2020 3 NiyaDong et al./ Construction and Building Materials 216(2019) 588- 598 PG 64-22 PG 70-22 Aggregate HWTT Thermoco uple probe Strain rate Creep stiffness modulus Dynamic modulus Rut depth Creep rate PG 70-22 mixes are less temperature sensitive and more rut resistant than PG 64-22. Mixes with stiffer asphalt binder can effectively reduce permanent deformation at high temperature. For evaluation of permanent deformation, the validity of the HWTT is higher than IDT test. Cont.… (Literature Review)
  • 18.
    18JUNE 2020 4 SungumKim et al./ J.Mater.Civ.Eng.,20 18.30(2):04017280 RAP Aggregate HWTD No. of laoding passes at failure. Rut depth Effect of NMAS RAP with larger NMAS performed better than those with small NMAS in both rut and anti stripping resistance. As NMAS decreases rut depth increases regardless of source As NMAS increased the SIP increased for all aggregate source. The test temperature of 50°C was not enough to distinguish size effects of aggregate, 64°C and 70°C were. Cont.… (Literature Review)
  • 19.
    19JUNE 2020 5 IbrahimSel et al./ J.Mater.Civ.Eng.,201 4,26(8):04014037 Hydrated lime Liquid antistrip- ping additive Binder (PG 64- 22, PG 70-22, PG 76- 22) Aggregat e HWTD Average deformation Temperature dependence As the test temperature increases the average deformation increases accordingly. The mixes with higher PG binder accumulates less deformation than those with lower grade binder Lime performed better than liquid and liquid performed better than binder without additive. Cont.… (Literature Review)
  • 20.
    20JUNE 2020 6 Vishnu Radhakarishn anet al. Road Materials and Pavement Design, 2019 Vol. 20, No. 1, 90–109 VG30 VG40 CRMB WTD Rut depth Air void For same initial air void, field and laboratory rut depth correlated. Mixes with higher compaction rutted less Mixes with softer binder rutted more both in filed and in laboratory. Higher initial air void content produced higher rut depth. Suitability of WTD for testing rutting susceptibility was demonstrated. Cont.… (Literature Review)
  • 21.
    21JUNE 2020 7 B.Javilla et al. Construction and Building Materials (2017), vol 153 157–164 AC-20 Limeston e AC-13 Basalt Asphalt Mixture SBS Modified Asphalt Binder WTD Stress Temperature Moisture Limestone mixture was more rut resistance than Basalt mixture. Temperature was a more significant factor than stress. Rutting resistance showed a strong correlation with the moisture content. Primary rutting contributed a significant percentage of the final rutting. Cont.… (Literature Review)
  • 22.
    22JUNE 2020 8 B.Javilla et al. Construction and Building Materials (2017), vol. 155, 1215– 1223 AC-13 Basalt asphalt mixture AC-20 Limeston e mixture WTD Temperature dependence CSI DS AC-13 and AC-20 mixtures were both temperature and stress dependent. Secondary rutting parameters had higher correlation than primary indicators. Cont.… (Literature Review)
  • 23.
    23JUNE 2020 9 H.A.A.Gibreil et al. Construction and Building Materials (2017), vol 142, 101– 108 HDPE CRP (crumb rubber powder) WTD IDT Marshall test Stability Flow DS Resistance to deformation in moderate and high temperatures increased with the addition of the modifiers. Ductility reduced with modifiers. Temperature susceptibility decreased with addition of modifiers. Modifiers improved the stability values. DS improved with addition of both HDPE and CRP. Cont.… (Literature Review)
  • 24.
    24JUNE 2020 10 T.Xu et al. Constructio n and Building Materials (2014), 53, 561–567 SBS modified binder Crushed Limeston e powder Polyester Fiber Triaxial repeated load test WTD DS Strain values The polyester fibres improve the deformation resistance of the asphalt mixtures. A strong correlation was found between the strain slope and the total rut depth in the wheel tracking test. Cont.… (Literature Review)
  • 25.
    25JUNE 2020 11 H.Ziari et al. Petroleum science and technology 2016, vol 34(9), 819- 823 PET (Polyethyl ene terephtha late) WTD DSR Rut depth Flow number Reduction in permanent deformation when PET is used. With increase in dynamic load, the produced stresses were absorbed with PET particles and it led to delay in rutting phenomenon. Cont.… (Literature Review)
  • 26.
    26JUNE 2020 12 G.Saranget al. Road Materials and Pavement Design, 2016 Vol. 17, No. 4, 933–945 VG 30 PMB 40 Lime Waste plastic (polyethyl ene and polypropy lene) Marshall test ITS WTD Deformation Stability ITS No stabilizing additive is required in SMA with PMB. PMB mix showed better performance than SWP in Marshall stability and tensile strength parameters. PMB mixes showed better performance than SWP in both rutting and fatigue tests . Cont.… (Literature Review)
  • 27.
    27JUNE 2020 13 P. Chaturabong Etal. Construction and Building Materials (2017), vol 146, 175– 182 VG 30 Granular material HWTD AMPT Rut depth Total proximity length Failure mechanism in the HWT and FN test is similar. The validity of dry HWTD in measuring rutting resistance of the asphalt mixture was established. Cont.… (Literature Review)
  • 28.
    28JUNE 2020 14 W.Zhang et al. J.Mater.Civ. Eng.,2017,2 9(9):04017 098 PG binder Aggregate HWTD Binder extractor Falling weight deflectom eter (FWD) Rutting resistance index(RRI) Field rut depth in general decreased with increased RRI. HWT test results alone do not have strong relationship with the field rut depth. Other factors, such as climate and pavement structure have to be considered. RRI, Pavement age, AADT, pavement structure are critical influence factors. Cont.… (Literature Review)
  • 29.
    29JUNE 2020 15 H.Wang et al. J.Mater.Civ. Eng.,2009, 21(4):181- 185 Aggregate Binder (VG 30) HWTD Rut depth Dynamic stability The asphalt intermediate course has the greatest effect on rut development followed by asphalt base course. Longitudinal grades also effects the rutting depth. Cont.… (Literature Review)
  • 30.
    30JUNE 2020 16 B.Javillaet al. Constructio n and Building Materials 153 (2017) 157-164 AC-20 limestone AC-13 basalt asphalt mix AC-25 Recycled hot mix asphalt HWTD Rut depth Dynamic Stability AC-13 mix were more rutting resistance as compared to Ac- 20 mix. Rutting rate increased exponentially after 50°C and greater than 1000 cycles. Cont.… (Literature Review)
  • 31.
    31JUNE 2020 17 Y.DUet al. Constructio n and Building Materials (2018), vol 168, 893- 905 Aggregate Binder (VG 30) HWTD DSR Rut Depth Dynamic Stability Flow number Semi flexible pavement is suggested. Cooling technologies of aphalt pavement should be used. More laboratory test methods should be developed to reproduce the real field pavement environment. Cont.… (Literature Review)
  • 32.
    32JUNE 2020 18 QuingLu John T.Harvey Transporta tion Research Record 1970 Aggregate Binder Hydrated lime Anti- stripping agent HWTD LVDT Rut depth Mixes treated with hydrated lime showed lower rut depth than mixes with liquid anti stripping agents which showed lower rut depth than untreated mixes. Compaction profile variability existed which gave inconsistent results across the sample itself. Binders using no acid performed well. Cont.… (Literature Review)
  • 33.
    JUNE 2020 33 LiteratureGap Waste plastic as an additive against rutting has been less researched. Majorly only HDPE plastic has been investigated. For dry WTD, fewer parameters have been examined.
  • 34.
    JUNE 2020 34 METHODSAND MATERIALS
  • 35.
    35JUNE 2020 Methods Blending ofaggregates as per MoRTH, 2013 for BC (II). Trial and error method was adopted. Characterization test for aggregates – Impact value, Crushing value, Abrasion value, Shape test and specific gravity. Characterization test for binders – specific gravity, penetration value and softening point. Marshall Mix design – OBC WTD – evaluation of rutting potential of conventional and modified bituminous mixes.
  • 36.
    36JUNE 2020 Materials Material Source CA(20 mm) Gaya CA (10 mm) Gaya Stone dust Gaya Bitumen (VG 30) Gaya Cement – OPC 53 Table 1: Material and their source Cont.… (Methods and Materials)
  • 37.
    37JUNE 2020 Plastic materialThickness (µ) Softening point (°C) Biscuit cover 40 160-170 Milk pouch 60 100-120 Table 2: Waste plastics and their parameters. Cont.… (Methods and Materials)
  • 38.
    38JUNE 2020 Test Testmethod Result Code specification Specific gravity test IS: 1202-1978 1.0 0.98-1.01 Penetration value test 25°C, 100 g, 5 s, (d mm) IS: 1203-1978 68 60-70 Softening point test (°C) IS: 334-1982 52 50-55 Table 3: Characterization of binder. Cont.… (Methods and Materials)
  • 39.
    39JUNE 2020 Test Testmethod Result Code specification Aggregate Impact value (%) IS: 2386 (Part Ⅳ) 1963 8-11 <30 Aggregate crushing value test (%) IS: 2386 (Part Ⅳ) 1963 18.30 <45 Aggregate abrasion value test(%) IS: 2386 (Part Ⅳ) 1963 23.47 <30 Shape test (%) IS: 2386 (Part Ⅰ) 1963 FE: 13 EE: 11 FE+EE < 30 Specific gravity test IS: 2386 (Part Ⅳ) 1963 20mm: 2.67 10mm: 2.67 Stone dust: 2.64 2.5 - 3 Table 4: Characterization of aggregates. Cont.… (Methods and Materials)
  • 40.
    JUNE 2020 40 Fig.3: Shredded milk pouch plastic (LDPE)
  • 41.
    JUNE 2020 41 Fig.4: Shredded biscuit cover(PP)
  • 42.
  • 43.
    43JUNE 2020 Collection of aggregate Collectionof bitumen Collection of waste plastic Characterization tests Blending of aggregate OBC determination Preparation of conventional samples Preparation of modified samples Evaluation of samples by WTD Comparison of different samples Conclusion and recommendations Methodology chart
  • 44.
    44JUNE 2020 Cont.… (LaboratoryInvestigation) Blending of Aggregates Intermixing of two or more fine or coarse aggregate to produce a combination of aggregates with improved gradation and other properties Materials blended were CA 20 mm, CA 10 mm, stone dust and cement Trial and Error method was adopted, Proportion was varied until the required aggregate gradation was achieved.
  • 45.
    45JUNE 2020 Formula: P= Aa + Bb + Cc + Dd Where, P = % of material passing a given sieve for the blended aggregate A (CA 20mm), B (CA 10mm), C (SD) and D (cement). A, B, C and D = % of material passing a given sieve for each constituent of mix A, B, C and D. a, b, c and d = proportion (decimal fractions) of constituent A, B, C and D to be used in blend. (a + b + c + d = 100) Cont.… (Laboratory Investigation)
  • 46.
    46JUNE 2020 Marshall Mixdesign To determine OBC Samples were prepared at 4.5%, 5%, 5.5%, 6% and 6.5% Cont.… (Laboratory Investigation)
  • 47.
    47JUNE 2020 Mixture componentsCA I, CAII, Stone dust,Cement,Binder Weight 1200 gms Height 60-63 mm Diameter 100mm Mixing temperature 160°C Compaction temperature 150°C Testing temperature 60°C Table 5: Marshall mix design Cont.… (Laboratory Investigation)
  • 48.
    48JUNE 2020 Optimum bitumencontent (OBC) was found by taking average value of the following three bitumen contents . 1. Bitumen content at maximum stability value. 2. Bitumen content at maximum bulk density. 3. Bitumen content at 4% air voids. The flow value, volume of bitumen, VFB and VMA were checked for MoRTH, 2013 specification. Cont.… (Laboratory Investigation)
  • 49.
    JUNE 2020 49 Fig.5: Marshall Samples
  • 50.
    50JUNE 2020 Wheel trackertesting It is a laboratory arrangement to simulate the movement of wheel on the pavement Two types of samples were prepared – conventional and modified with plastic waste. Dry process was used to prepare waste plastic mix. Test was done by two procedures – procedure A (1000 load cycles / 15 mm) and procedure B (10000 load cycles / 20 mm). Cont.… (Laboratory Investigation)
  • 51.
    JUNE 2020 51 Mixturecomponents CA I, CA II, Stone dust, cement, Binder Weight 11 kgs L X B 305mm X305mm Height 50mm Mixing temperature 160°C Compaction temperature 150°C Testing temperature 60°C Table 6: Wheel tracker design
  • 52.
    52JUNE 2020 Procedure Aparameters Rut depth (RD). Proportional rut depth( PRD) PRD = (RD/50) X 100 It is the rut depth at the end of the test Cont.… (Laboratory Investigation)
  • 53.
    53JUNE 2020 Wheel trackingrate ( WTR) WTR = 3 rn + rn-1 – rn-2 – 3 rn-3 (as per EN 12697– 22:2003(E) ) Where, n is the total number of readings taken at 100 load cycles interval up to 1000 load cycles, excluding the initial reading ri is the change in vertical displacement from the initial value, r0, to the i relevant reading, in millimeters (mm ) Cont.… (Laboratory Investigation)
  • 54.
    54JUNE 2020 Rut resistanceindex (RRI) RRI = N X (1-RD) Where, N = no. of cycles at the completion of test RD = rut depth in inches at completion of test, assuming the max allowable rut depth is below 1 inch. Cont.… (Laboratory Investigation)
  • 55.
    55JUNE 2020 Procedure Bparameters Rut depth (RD). It is the rut depth at the end of the test Proportional rut depth( PRD) PRD = (RD/50) X 100 Cont.… (Laboratory Investigation)
  • 56.
    56JUNE 2020 Wheel trackingslope (WTSAIR) WTSAIR = (d10000 – d5000) 5 Where, d5000, d10000 is the rut depth after 5000 load cycles and 10000 load cycles, in mm Cont.… (Laboratory Investigation)
  • 57.
    57JUNE 2020 Rut resistanceindex (RRI) RRI = N X (1-RD) Where, N = no. of cycles at the completion of test RD = rut depth in inches at completion of test, assuming the max allowable rut depth is below 1 inch. Cont.… (Laboratory Investigation)
  • 58.
    58JUNE 2020 Dynamic stability(DS) DS = N (t2 – t1) (d2 – d1) Where, t2 = 60 minute t1 = 45 minute d2 = deformation at 60th minute d1 = deformation at 45th minute N = speed of test wheel rolling (26.8 times/minute) Cont.… (Laboratory Investigation)
  • 59.
    59JUNE 2020 Complex stabilityindex (CSI) CSI = N (t2 – t1) d1 (d2 – d1) Where, t2 = 60 minute t1 = 45 minute d2 = deformation at 60th minute d1 = deformation at 45th minute N = speed of test wheel rolling (26.8 times/minute) Cont.… (Laboratory Investigation)
  • 60.
    60JUNE 2020 Fig. 6:Aggregates before coating
  • 61.
    61JUNE 2020 Fig. 7:Aggregates after coating
  • 62.
    62JUNE 2020 Fig. 8:WTD sample before testing
  • 63.
    63JUNE 2020 Fig. 9:WTD sample after testing Fig. 9: WTD sample after testing
  • 64.
    64JUNE 2020 Fig. 10:WTD sample after testing at different plastic contents.
  • 65.
    JUNE 2020 65 Fig.11: wheel tracker device
  • 66.
    JUNE 2020 66 Fig.12: Roller compactor
  • 67.
    67JUNE 2020 Fig. 13:Wheel tracker device set-up.
  • 68.
    JUNE 2020 68 RESULTSAND DISCUSSIONS
  • 69.
    69JUNE 2020 Blending ofAggregates Material % composition 20mm 17 10mm 25 SD 55 Cement 3 Table 7: Constituents and their composition Cont.… (Results and Discussions)
  • 70.
    70JUNE 2020 Sieve,mm lowerlimit,% upper limit,% Observed,% 19.00 100 100 98.97 13.20 90 100 90.64 9.50 70 88 77.31 4.75 53 71 58.31 2.36 42 58 50.55 1.18 34 48 36.06 0.60 26 38 30.94 0.30 18 28 18.38 0.15 12 20 13.89 0.075 4 10 4.78 Table 8: MoRTH , 2013 specification and observed values Cont.… (Results and Discussions)
  • 71.
    71JUNE 2020 0 20 40 60 80 100 120 19 13.29.5 4.75 2.36 1.18 0.6 0.3 0.15 0.075 %Passing Sieve size,mm lower limit upper limit observed values Fig. 14: Gradation envelope obtained Cont.… (Results and Discussions)
  • 72.
    72JUNE 2020 Marshall Mixdesign S.NO Properties Bitumen content % MoRTH specifica tions.4.5 5.0 5.5 6.0 6.5 1 Marshall stability value, KN 9.79 11.77 12.88 10.72 10.44 Min 9 2 Flow value, mm 2.25 2.31 2.45 3.35 4.26 2-4 3 Theoretical maximum density, gm/cc 2.43 2.41 2.39 2.37 2.35 - 4 Bulk density, gm/cc 2.28 2.29 2.30 2.28 2.27 - 5 Volume of air voids, % 5.97 5.03 4.06 3.82 3.24 3-5 6 Volume of bitumen, % 10.28 11.45 12.63 13.71 14.82 - 7 Voids in mineral aggregate, % 11.38 11.54 11.68 12.26 12.65 >15 8 Voids filled with bitumen, % 63.25 69.48 75.68 78.23 82.06 65-75 9 Optimum bitumen content 5.5 Min 5.4 Table 9: Properties of bituminous mix
  • 73.
    JUNE 2020 73 Graphsobtained for Marshall mix design 4.00 6.00 8.00 10.00 12.00 14.00 4 4.5 5 5.5 6 6.5 7 Stability,kN Bitumen content,% Stability vs Bitumen content Fig. 15: Stability vs bitumen content graph 2.00 2.50 3.00 3.50 4.00 4.50 4 4.5 5 5.5 6 6.5 7 Flow,mm Bitumen content % Flow vs Bitumen content Fig. 16: Flow value vs bitumen content graph 2.275 2.280 2.285 2.290 2.295 2.300 4 4.5 5 5.5 6 6.5 7 Bulkdensity,gm/cc Bitumen content,% Bulk density vs Bitumen content Fig. 17: Bulk density vs bitumen content graph 0.00 1.00 2.00 3.00 4.00 5.00 6.00 7.00 4 4.5 5 5.5 6 6.5 7VA% Bitumen content % VA,% vs Bitumen content Fig. 18: air void vs bitumen content graph
  • 74.
    JUNE 2020 74 35.00 45.00 55.00 65.00 75.00 85.00 44.5 5 5.5 6 6.5 7 VFB,% Bitumen content,% VFB,% vs Bitumen content,% Fig. 19: VFB vs bitumen content graph 10.00 11.00 12.00 13.00 14.00 15.00 4 4.5 5 5.5 6 6.5 7 VMA% Bitumen content,% VMA,% vs Bitumen Content,% Fig. 20: VMA vs bitumen content graph
  • 75.
    JUNE 2020 75 WheelTracker testing Sample No. RD (mm) PRD (%) WTR(µm/ cycle) RRI (NA) 1 4.45 8.89 2.15 824.80 2 4.14 8.28 2.08 837.00 3 4.04 8.09 1.90 840.94 4 4.19 8.38 2.04 835.04 5 4.21 8.43 2.01 834.25 6 4.37 8.74 2.15 827.95 Avg. 4.23 8.46 2.05 833.33 Table 10: Results of conventional mixes (Procedure A)
  • 76.
    JUNE 2020 76 Sample No. RD(mm) PRD (%) WTSAIR (mm/103 load cycles) RRI (NA) DS (load cycles/ mm) CSI (load cycles/ mm2) 1 10.43 20.87 0.506 5893.70 705.26 161.38 2 10.49 20.99 0.496 5870.07 717.85 158.81 3 10.62 21.24 0.484 5818.89 705.26 151.34 Avg. 10.51 21.03 0.495 5860.88 709.45 157.17 Table 11: Results of conventional mixes (Procedure B) Cont.… (Results and Discussions)
  • 77.
    JUNE 2020 77 Rutting Parameters MixtureType 4% LDPE Mix 6% LDPE Mix 8% LDPE Mix 10% LDPE Mix 12% LDPE Mix RD (mm) 3.66 3.51 2.86 2.53 2.26 PRD (%) 7.38 7.02 5.73 5.07 4.52 WTR (µm/cycle) 1.64 1.61 1.28 1.12 1.09 RRI (NA) 854.72 861.67 887.33 900.12 911.02 Table 12: Results of LDPE modified mixes (Procedure A) Cont.… (Results and Discussions)
  • 78.
    JUNE 2020 78 Rutting Parameters MixtureType 4% LDPE Mix 6% LDPE Mix 8% LDPE Mix 10% LDPE Mix 12% LDPE Mix RD (mm) 8.17 7.30 6.41 5.64 5.02 PRD (%) 16.35 14.6 12.83 11.28 10.04 WTSAIR,(mm/103 load cycles) 0.368 0.337 0.295 0.259 0.230 RRI (NA) 6780.83 7126.08 7437.74 7779.52 8023.62 DS (load cycles/mm) 928.13 1068.43 1257.06 1405.02 1608.00 CSI (load cycles/mm2) 248.59 320.92 424.64 542.56 696.24 Table 13: Results of LDPE modified mixes (Procedure B) Cont.… (Results and Discussions)
  • 79.
    JUNE 2020 79 Table14: Results of PP modified mixes (Procedure A) Rutting Parameters Mixture Type 4% PP Mix 6% PP Mix 8% PP Mix 10% PP Mix 12% PP Mix RD (mm) 3.85 3.74 3.44 2.94 2.54 PRD (%) 7.71 7.48 6.88 5.88 5.09 WTR (µm/cycle) 1.83 1.85 1.64 1.31 1.19 RRI (NA) 848.15 852.75 864.56 884.24 899.73 Cont.… (Results and Discussions)
  • 80.
    JUNE 2020 80 Table15: Results of PP modified mixes (Procedure B) Rutting Parameters Mixture Type 4% PP Mix 6% PP Mix 8% PP Mix 10% PP Mix 12% PP Mix RD (mm) 9.15 8.41 8.07 7.59 6.18 PRD (%) 18.31 16.83 16.15 15.18 12.37 WTSAIR,(mm/103 load cycles) 0.426 0.394 0.376 0.355 0.288 RRI (NA) 6395.01 6686.40 6820.20 7010.40 7624.67 DS (load cycles/mm) 764.10 874.01 880.38 973.09 1118.97 CSI (load cycles/mm2) 190.25 235.15 247.05 290.90 412.21 Cont.… (Results and Discussions)
  • 81.
    JUNE 2020 81 Rutting Parameters MixtureType Conv. Mix 4% LDPE Mix 6% LDPE Mix 8% LDPE Mix 10% LDPE Mix 12% LDPE Mix RD (mm) 4.23 3.66 3.51 2.86 2.53 2.26 PRD (%) 8.46 7.38 7.02 5.73 5.07 4.52 WTR (µm/cycle) 2.05 1.64 1.61 1.28 1.12 1.09 RRI (NA) 833.3 854.72 861.67 887.33 900.12 911.02 Table 16: Comparison between Conv. and LDPE modified mixes(Procedure A) Cont.… (Results and Discussions)
  • 82.
    JUNE 2020 82 4.23 3.663.51 2.86 2.53 2.26 0.00 1.00 2.00 3.00 4.00 5.00 CONV MIX 4% LDPE 6% LDPE 8% LDPE 10% LDPE 12% LDPE Rutdepth(mm) Type of mix Rut depth at 1000 load cycles Fig. 21: Rut depth at 1000 load cycles for conv. and LDPE modified mixes 2.05 1.64 1.61 1.28 1.12 1.09 0.00 0.50 1.00 1.50 2.00 2.50 CONV MIX 4% LDPE 6% LDPE 8% LDPE 10% LDPE 12% LDPE WTR(µm/loadcycle) Type of Mix Wheel Tracking Rate Fig. 22: Wheel Tracking rate for conv. and LDPE modified mixes
  • 83.
    JUNE 2020 83 833.33 854.72861.67 887.13 900.12 911.02 780 800 820 840 860 880 900 920 940 CONV MIX 4% LDPE 6% LDPE 8% LDPE 10% LDPE 12% LDPE RRI Type of mix Rut Resistance Index Fig. 23: Rut resistance index for conv. and LDPE modified mixes Rut depth reduction nearly 40% Wheel tracking rate reduction by nearly 39% RRI surged by 10%
  • 84.
    JUNE 2020 84 Rutting Parameters MixtureType Conv. Mix 4% LDPE Mix 6% LDPE Mix 8% LDPE Mix 10% LDPE Mix 12% LDPE Mix RD (mm) 10.51 8.17 7.30 6.41 5.64 5.02 PRD (%) 21.03 16.35 14.6 12.83 11.28 10.04 WTSAIR,(mm/ 103 load cycles) 0.495 0.368 0.337 0.295 0.259 0.230 RRI (NA) 5860.88 6780.83 7126.08 7437.74 7779.52 8023.62 DS (load cycles/mm) 709.45 928.13 1068.43 1257.06 1405.02 1608.00 CSI (load cycles/mm2) 157.17 248.59 320.92 424.64 542.56 696.24 Table 17: Comparison between Conv. and LDPE modified mixes(Procedure B) Cont.… (Results and Discussions)
  • 85.
    JUNE 2020 85 10.51 8.17 7.3 6.41 5.645.02 0 2 4 6 8 10 12 CONV MIX 4% LDPE 6% LDPE 8% LDPE 10% LDPE 12% LDPE Rutdepth(mm) Type of mix Rut depth at 10000 load cycles Fig. 24: Rut depth at 10000 load cycles for conv. and LDPE modified mixes 0.495 0.368 0.337 0.295 0.259 0.23 0 0.1 0.2 0.3 0.4 0.5 0.6 CONV MIX 4% LDPE 6% LDPE 8% LDPE 10% LDPE 12% LDPE WTSair(mm/10^3load cycles) Type of mix Wheel Tracking slope Fig. 25: Wheel tracking slope for conv. and LDPE modified mixes
  • 86.
    JUNE 2020 86 5860.88 6780.837126.08 7473.74 7779.52 8023.62 0 2000 4000 6000 8000 10000 CONV MIX 4% LDPE 6% LDPE 8% LDPE 10% LDPE 12% LDPE RRI Type of mix Rut resistance index Fig. 26: Rut resistance index for conv. and LDPE modified mixes 709.45 928.13 1068.43 1257.06 1405.02 1608 0 500 1000 1500 2000 CONV MIX 4% LDPE 6% LDPE 8% LDPE 10% LDPE 12% LDPE DS(loadcycle/mm) Type of mix Dynamic stability Fig. 27: Dynamic stability for conv. and LDPE modified mixes
  • 87.
    JUNE 2020 87 157.17 248.59 320.92 424.64 542.56 696.24 0 200 400 600 800 CONVMIX 4% LDPE 6% LDPE 8% LDPE 10% LDPE 12% LDPE CSI(loadcycles/mm^2) Type of mix Complex stability index Fig. 28: Complex stability Index for conv. and LDPE modified mixes Rut depth and slope reduction of almost 50% DS and CSI displayed considerable improvement RRI improved by nearly 30%
  • 88.
    JUNE 2020 88 Table18: Comparison between Conv. and PP modified mixes(Procedure A) Rutting Parameters Mixture Type Conv. Mix 4% PP Mix 6% PP Mix 8% PP Mix 10% PP Mix 12% PP Mix RD (mm) 4.23 3.85 3.74 3.44 2.94 2.54 PRD (%) 8.46 7.71 7.48 6.88 5.88 5.09 WTR (µm/cycle) 2.05 1.83 1.85 1.64 1.31 1.19 RRI (NA) 833.33 848.15 852.75 864.56 884.24 899.73 Cont.… (Results and Discussions)
  • 89.
    JUNE 2020 89 Fig.29: Rut depth at 1000 load cycles for conv. and PP modified mixes 4.23 3.85 3.74 3.44 2.94 2.54 0.00 1.00 2.00 3.00 4.00 5.00 CONV MIX 4% PP 6% PP 8% PP 10% PP 12% PP Rutdepth(mm) Type of mix Rut depth at 1000 load cycles 2.05 1.83 1.85 1.64 1.31 1.19 0.00 0.50 1.00 1.50 2.00 2.50 CONV MIX 4% PP 6% PP 8% PP 10% PP 12% PP WTR(µm/cycle) Type of mix Wheel tracking rate Fig. 30: Wheel tracking rate for conv. and PP modified mixes
  • 90.
    JUNE 2020 90 833.33 848.15852.75 864.56 884.24 899.73 780 800 820 840 860 880 900 920 CONV MIX 4% PP 6% PP 8% PP 10% PP 12% PP RRI Type of Mix Rut resistance index Fig. 31: Rut resistance index for conv. and PP modified mixes Rut depth reduction of nearly 35% WTR dropped around 38% RRI value increased up to 8%
  • 91.
    JUNE 2020 91 Rutting Parameters MixtureType Conv. Mix 4% PP Mix 6% PP Mix 8% PP Mix 10% PP Mix 12% PP Mix RD (mm) 10.51 9.15 8.41 8.07 7.59 6.18 PRD (%) 21.03 18.31 16.83 16.15 15.18 12.37 WTSAIR,(mm/ 103 load cycles) 0.495 0.426 0.394 0.376 0.355 0.288 RRI (NA) 5860.88 6395.01 6686.40 6820.20 7010.40 7624.67 DS (load cycles/mm) 709.45 764.10 874.01 880.38 973.09 1118.97 CSI (load cycles/mm2) 157.17 190.25 235.15 247.05 290.90 412.21 Table 19: Comparison between Conv. and PP modified mixes(Procedure B) Cont.… (Results and Discussions)
  • 92.
    JUNE 2020 92 10.51 9.15 8.418.07 7.59 6.18 0 2 4 6 8 10 12 CONV MIX 4% PP 6% PP 8% PP 10% PP 12% PP Rutdepth(mm) Type of mix Rut depth at 10000 load cycle Fig. 32: Rut depth at 1000 load cycles for conv. and PP modified mixes 0.495 0.426 0.394 0.376 0.355 0.288 0 0.1 0.2 0.3 0.4 0.5 0.6 CONV MIX 4% PP 6% PP 8% PP 10% PP 12% PP WTSair(mm/10^3load cycles) Type of mix Wheel tracking slope Fig. 33: Wheel tracking slope for conv. and PP modified mixes
  • 93.
    JUNE 2020 93 5860.886395.01 6686.4 6820.2 7010.49 7624.67 0 2000 4000 6000 8000 10000 CONV MIX 4% PP 6% PP 8% PP 10% PP 12% PP RRI Type of mix Rut resistance index Fig. 34: Rut resistance index for conv. and PP modified mixes 709.45 764.1 874.01 880.38 973.09 1118.97 0 200 400 600 800 1000 1200 CONV MIX 4% PP 6% PP 8% PP 10% PP 12% PP DS(loadcycle/mm) Type of mix Dynamic stability Fig. 35: Dynamic stability for conv. and PP modified mixes
  • 94.
    JUNE 2020 94 157.17 190.25 235.15247.05 290.9 412.21 0 100 200 300 400 500 CONV MIX 4% PP 6% PP 8% PP 10% PP 12% PP CSI(loadcyckle/mm^2) Type of mix Complex stability index Fig. 36: Complex stability index for conv. and PP modified mixes Rut depth and slope value went down by almost 40% RRI showed 25% improvement. Considerable improvement in DS and CSI values
  • 95.
    JUNE 2020 95 Rutting Parameters MixtureType 4% 6% 8% 10% 12% LDPE PP LDPE PP LDPE PP LDPE PP LDPE PP Rut depth (mm) 3.66 3.85 3.51 3.74 2.86 3.44 2.53 2.94 2.26 2.54 PRD (%) 7.38 7.71 7.02 7.48 5.73 6.88 5.07 5.88 4.52 5.09 WTR (µm/cycle) 1.64 1.83 1.61 1.85 1.28 1.64 1.12 1.31 1.09 1.19 RRI (NA) 854. 72 848. 15 861. 67 852. 75 887. 13 864. 56 900. 12 884. 24 911. 02 899. 73 Table 20: Comparison between LDPE and PP modified mixes(Procedure A) Cont.… (Results and Discussions)
  • 96.
    JUNE 2020 96 3.663.51 2.86 2.53 2.26 3.85 3.74 3.44 2.94 2.54 0.00 1.00 2.00 3.00 4.00 5.00 4% MIX 6% MIX 8% MIX 10% MIX 12% MIX RD(mm) Type of mix Rut depth LDPE PP Fig. 37: Rut depth at 1000 load cycles for LDPE and PP modified mixes 1.64 1.61 1.28 1.12 1.09 1.83 1.85 1.64 1.31 1.19 0.00 0.50 1.00 1.50 2.00 4% MIX 6% MIX 8% MIX 10% MIX 12% MIX WTR(µm/cycle) Type of mix Wheel tracking rate LDPE PP Fig. 38: Wheel tracking rate for LDPE and PP modified mixes
  • 97.
    JUNE 2020 97 854.72 861.67 887.13 900.12 911.02 848.15852.75 864.56 884.24 899.73 800.00 820.00 840.00 860.00 880.00 900.00 920.00 4% MIX 6% MIX 8% MIX 10% MIX 12% MIX RRI Type of mix Rut resistance index LDPE PP Fig. 39: Rut resistance index for LDPE and PP modified mixes On an average, LDPE samples demonstrated 10% lower rut depth. LDPE sample had 15% lower WTR values. RRI values obtained for both the samples were almost similar.
  • 98.
    JUNE 2020 98 Rutting parameters MixtureType 4% 6% 8% 10% 12% LDPE PP LDPE PP LDPE PP LDPE PP LDPE PP RD (mm) 8.17 9.15 7.30 8.41 6.41 8.07 5.64 7.59 5.02 6.18 PRD (%) 16.35 18.31 14.6 16.83 12.83 16.15 11.28 15.18 10.04 12.37 WTSAIR (mm/103 load cycles) 0.368 0.426 0.337 0.394 0.295 0.376 0.259 0.355 0.230 0.288 RRI (NA) 6780.83 6395.01 7126.08 6686.40 7473.74 6820.20 7779.52 7010.49 8023.62 7624.67 DS (load cycles/mm) 928.13 764.10 1068.43 874.01 1257.06 880.38 1405.02 973.04 1608.00 1118.97 CSI (load cycles/mm2) 248.59 190.25 320.92 235.15 424.64 247.05 542.56 290.90 696.24 412.21 Table 21: Comparison between LDPE and PP modified mixes(Procedure B) Cont.… (Results and Discussions)
  • 99.
    JUNE 2020 99 Fig.40: Rut depth at 10000 load cycles for LDPE and PP modified mixes 8.17 7.30 6.41 5.64 5.02 9.15 8.41 8.07 7.59 6.18 0.00 2.00 4.00 6.00 8.00 10.00 4% MIX 6% MIX 8% MIX 10% MIX 12% MIX RD(mm) Type of mix Rut depth LDPE PP 0.368 0.337 0.295 0.259 0.230 0.426 0.394 0.376 0.355 0.288 0.000 0.100 0.200 0.300 0.400 0.500 4% MIX 6% MIX 8% MIX 10% MIX 12% MIX WTSair(mm/10^3loadcycle) Type of mix Wheel tracking slope LDPE PP Fig. 41: Wheel tracking slope for LDPE and PP modified mixes
  • 100.
    JUNE 2020 100 6780.83 7126.08 7473.74 7779.52 8023.62 6395.01 6686.40 6820.20 7010.49 7642.67 0.00 2000.00 4000.00 6000.00 8000.00 10000.00 4%MIX 6% MIX 8% MIX 10% MIX 12% MIX RRI Type of mix Rut resistance index LDPE PP Fig. 42: Rut resistance index for LDPE and PP modified mixes 928.13 1068.43 1257.06 1405.02 1608.00 764.10 847.01 880.38 973.09 1118.97 0.00 500.00 1000.00 1500.00 2000.00 4% MIX 6% MIX 8% MIX 10% MIX 12% MIX DS(loadcycles/mm) Type of mix Dynamic stability LDPE PP Fig. 43: Dynamic stability for LDPE and PP modified mixes
  • 101.
    JUNE 2020 101 248.59 320.92 424.64 542.56 696.24 190.25 235.15 247.05 290.90 412.21 0.00 200.00 400.00 600.00 800.00 4%MIX 6% MIX 8% MIX 10% MIX 12% MIX CSI(loadcycles/mm^2) Type of mix Complex stability index LDPE PP Fig. 44: Complex stability index index for LDPE and PP modified mixes LDPE samples produced around 15% lower rut depth. Slope value of LDPE was nearly 18% lower than PP mix. RRI values differed by around 7% DS and CSI value for LDPE were around 30% higher than PP mixes.
  • 102.
  • 103.
    JUNE 2020 103 Ruttingdepth decreased on adding plastic as an additive. Rut depth varied inversely with plastic content. Parameters such as WTR, WTS, RRI, DS and CSI showed improved performance on mixing plastic. LDPE plastic demonstrated better performance than PP plastic. Suitability of wheel tracker device to assess rutting potential has been established in this research. Cont.… (Conclusions)
  • 104.
    JUNE 2020 104 Cont.…(Conclusions) Recommendations Maximum improvement was observed for 8-10% plastic content. Therefore, the optimum percentage of plastic content is 8-10% by weight of bitumen. LDPE mix demonstrated around 15% better performance than PP mix. Therefore, it is a better additive.
  • 105.
    JUNE 2020 105 Futurescope of work Other plastics such as PET, PVC, PS etc. should also investigated for their efficacy as an additive. Similar research for DBM mix. Cont.… (Conclusions) Air void ratio of samples should be examined for better correlation
  • 106.
  • 107.
    JUNE 2020 107 Banerjee,A., Smit, A.F. and Prozzi, J.A. (2012). "Influence of operational tolerances on HMA performance." Construction and Building Materials , 27, 15-23. Brovelli, C., Crispino, M., Pais, J. and Pereira, P. (2015). "Using polymers to improve the rutting resistance of asphalt concrete." Construction and Building Materials , 77, 117-123 Chaturabong, P. and Bahia, H.U. (2017). "Mechanisms of asphalt mixture rutting in the dry Hamburg Wheel Tracking test and the potential to be alternative test in measuring rutting resistance.“ Construction and Building Materials , 146, 175-182 Doh, Y.S., Yun, K.K., Amirkhanian, S.N. and Kim, K.W. (2007). "Framework for developing a static strength test for measuring deformation resistance of asphalt concrete mixtures". Construction and Building Materials , 21, 2047-2058. Dong, N., Fujian, Ni., Zhou, L. and Mab, X. (2016). "Comparison of the Hamburg, indirect tensile, and multi-sequenced repeated load tests for evaluation of HMA rutting resistance.". Construction and Building Materials , 216, 588-598. Fakhri, M. and Hosseini, S.A. (2017). "Laboratory evaluation of rutting and moisture damage resistance of glass fiber modified warm mix asphalt incorporating high RAP proportion.". Construction and Building Materials , 134, 626-640. Gibreil, H.A.A. and Fang, C.P. (2017). "Effects of high-density polyethylene and crumb rubber powder as modifiers on properties of hot mix asphalt". Construction and Building Materials , 142, 101-108. Grebenschikov, S. and Prozzi, J.A. (2011). "Enhancing Mechanistic Empirical Pavement Design Guide Rutting Performance Predictions with Hamburg Wheel-Tracking Results.". Journal of the Transportation Research Board (pp. 111-118). Washington D.C. Transportation Research Record EN 12697 -22 (2003). Bituminous mixtures - Test methods for hot mix asphalt - Part 22: Wheel tracking. EN 12697 -33 (2003). Bituminous mixtures - Test methods for hot mix asphalt - Part 33: Specimen prepared by roller compactor IRC: SP:98 (2013). Guidelines for the use of waste plastic in hot bituminous mixes (dry process) in wearing courses Javilla, B., Fang, H., Mo, L., Shu, B. and Wu, S. (2017). "Test evaluation of rutting performance indicators of asphalt mixtures". Construction and Building Materials , 155, 1215-1223
  • 108.
    JUNE 2020 108 Khan,S., Nagabhusana, M.N., Tiwari, D. and Jain, P.K. (2013). "Rutting in Flexible Pavement: An approach of evaluation with Accelerated Pavement Testing Facility.".Procedia - Social and Behavioral Sciences , 104, 149-157. Lu, Q. and Harvey, J.T. (2006). "Evaluation of Hamburg Wheel-Tracking Device Test with Laboratory and Field Performance Data.".Journal of the Transportation Research Board (pp. 25-44). Washington D.C: Transportation Research Record. Lv, Q., Huang, W., Sadek, W., Xiao, F. and Yan, C. (2019). "Investigation of the rutting performance of various modified asphalt mixtures using the Hamburg Wheel-Tracking Device test and Multiple Stress Creep Recovery test." Construction and Building Materials , 206, 62-70. Radhakrishnan, V., Chowdari, G.S., Reddy, K.S. and Chattaraj, R. (2019). "Evaluation of wheel tracking and field rutting susceptibility of dense bituminous mixes". Road Materials and Pavement Design , 20 (1), 90-109. Saboo, N. and Kumar, P. (2016). "Analysis of Different Test Methods for Quantifying Rutting Susceptibility of Asphalt Binders.“ J. Mater. Civ. Eng. , 28 (7), (1-8). Tsai, B., Coleri, E., Harvey, J.T. and Monismith, C.L. (2016). "Evaluation of AASHTO T 324 Hamburg-Wheel Track Device test.". Construction and Building Materials , 114, 248-260. Wang, H., Zhang, Q. and Tan, J. (2009). "Investigation of Layer Contributions to Asphalt Pavement Rutting." J. Mater. Civ. Eng , 21 (4), 181-185. Xu, T., Wang, H., Li, Z. and Zhao, Y. (2014). "Evaluation of permanent deformation of asphalt mixtures using different laboratory performance tests". Construction and Building Materials , 53, 561-567. Yinfei, D., Jiaqi, C., Zheng, H. and Weizheng, L. (2018). "A review on solutions for improving rutting resistance of asphalt pavement and test methods." Construction and Building Materials , 168, 893-905. Zhang, W., Shen, S., Wu, S. and Mohammad, L.N. (2017). "Prediction Model for Field Rut Depth of Asphalt Pavement Based on Hamburg Wheel Tracking Test Properties." J. Mater. Civ. Eng , 29 (9), 1-10. Ziari, H., Kaliji, A.G. and Babagoli, R. (2016). "Laboratory evaluation of the effect of waste plastic bottle (PET) on rutting performance of hotmix asphalt mixtures". Petroleum science amd technology , 34, 819-823.
  • 109.
    109JUNE 2020 THANK YOU PRESENTED BY: AMIT KUMAR ROLL NO. 1824007