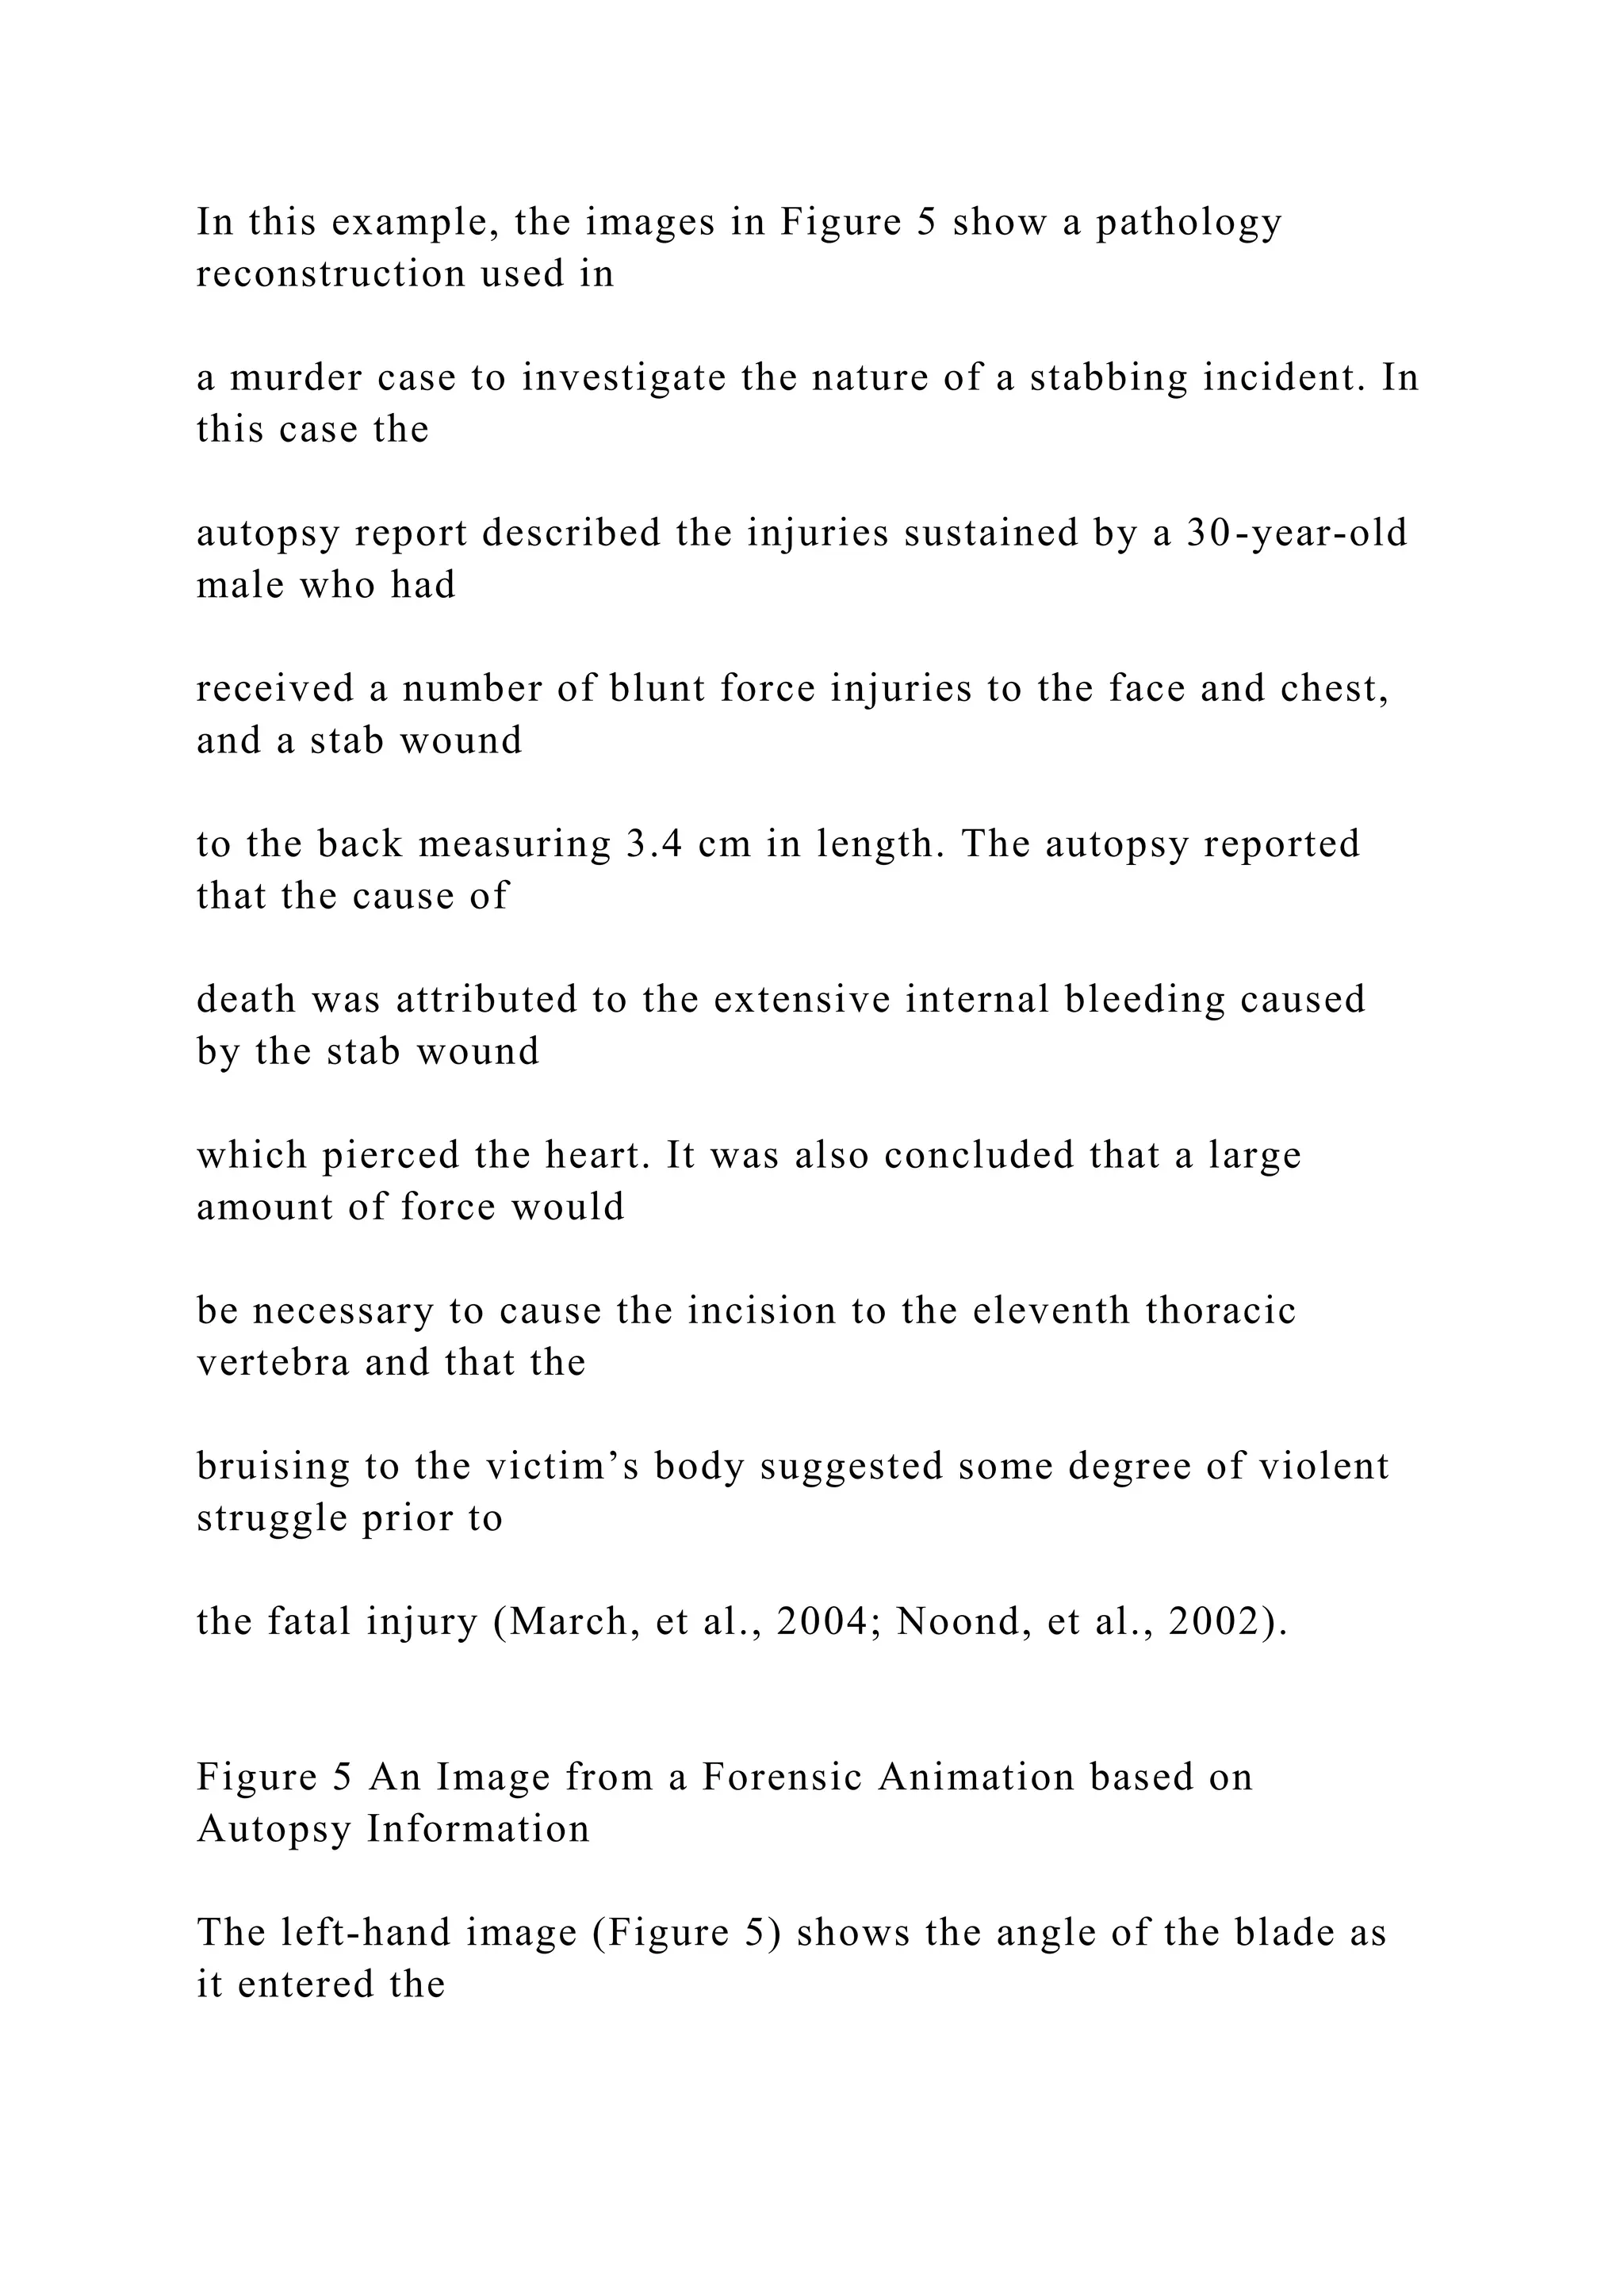
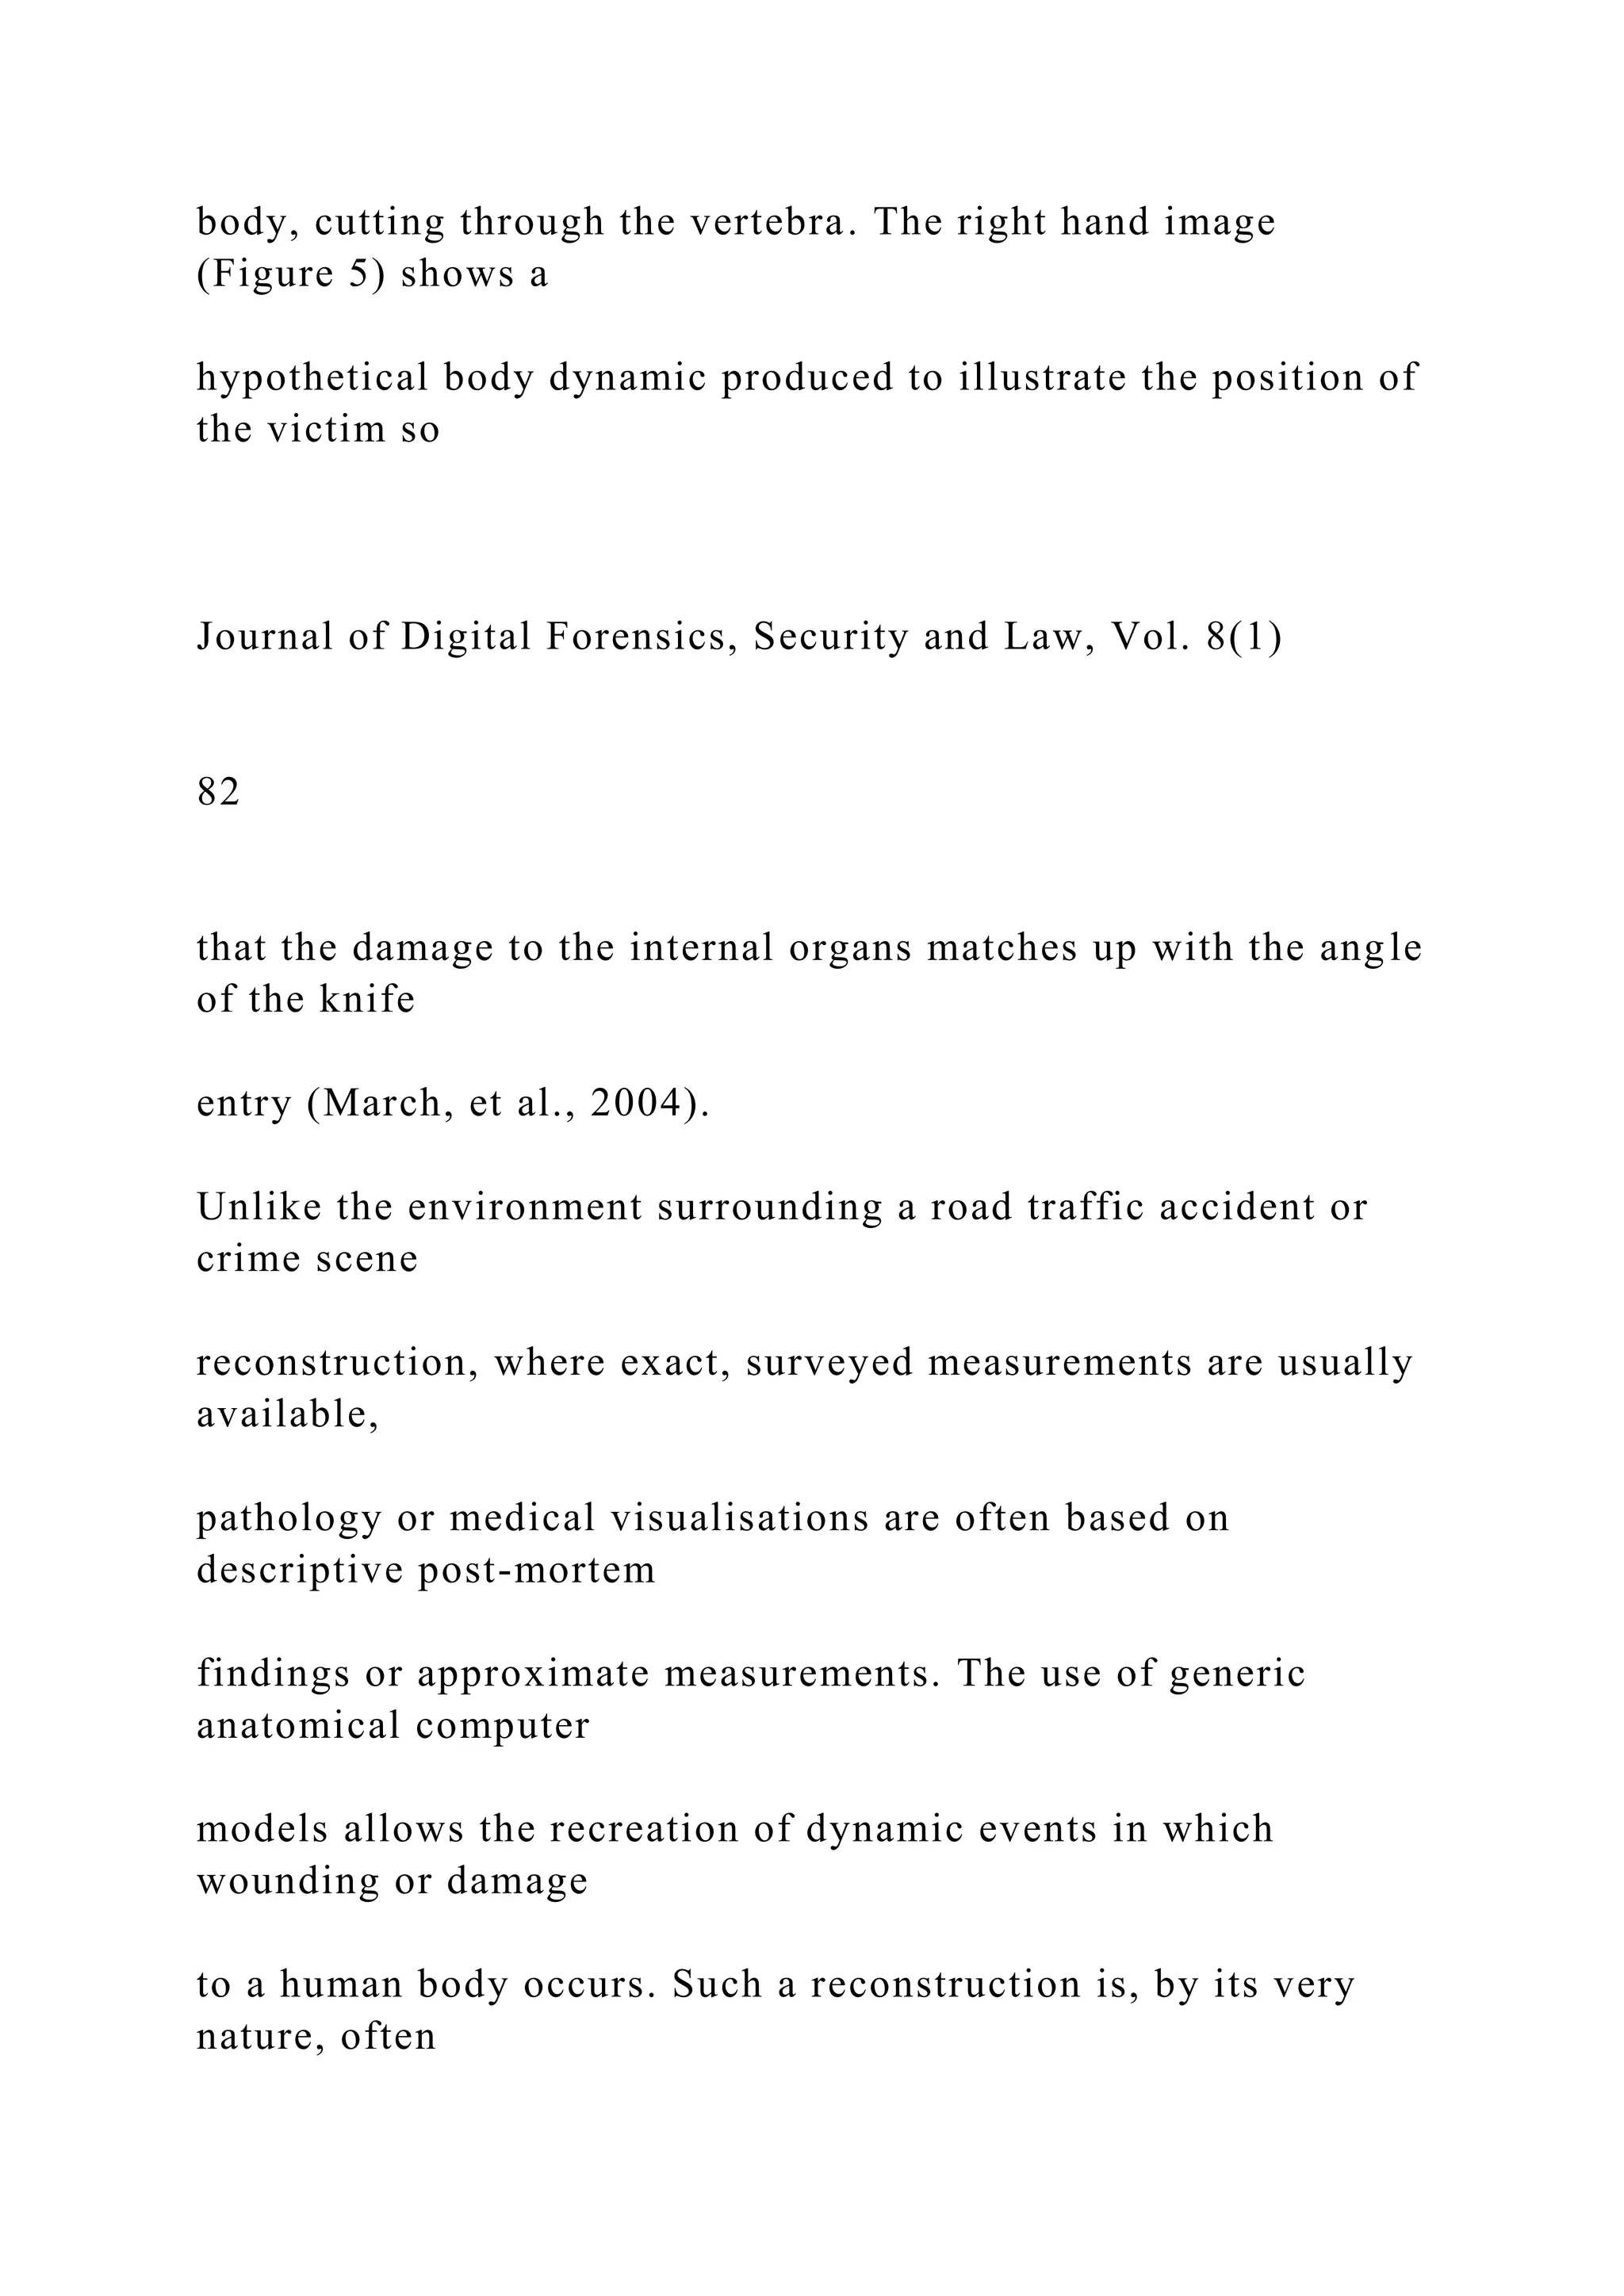
The document discusses the role of questions in addressing tire slashing crimes, outlining reasons behind such acts, methods to identify intentional damage, and steps victims can take post-incident. It emphasizes the psychological and social factors contributing to vandalism while detailing legal implications and preventative measures. The text indicates that visualization techniques in forensic analysis can enhance understanding of complex evidence in courtrooms.


![Journal of Digital Forensics, Security and Law, Vol. 8(1)
73
TECHNOLOGY CORNER
VISUALISING FORENSIC DATA: EVIDENCE
(PART 1)
Damian Schofield
State University of New York
Department of Computer Science
[email protected]
+1 (410) 504 3178
Ken Fowle
Edith Cowan University
School of Computer and Security Science
[email protected]
+61 (8) 9370 6013](https://image.slidesharecdn.com/runningheadtheroleofquestionsinsolvingcrimes1thero-221128144752-5369c225/75/Running-head-THE-ROLE-OF-QUESTIONS-IN-SOLVING-CRIMES-1The-Ro-docx-8-2048.jpg)

![Visualisation represents information that has been digitally
recorded (for
example: pictures, video and sound), hand written and/or spoken
data, to show
what may have, could have, did happen or is believed to have
happened. That is
why visualising data is an important development in the
analysis and
investigation realms, as visualisation explores the accuracies,
inconsistencies
and discrepancies of the collected data and information.
This paper introduces some of the various graphical techniques
and technology
used to display digital information in a courtroom. The
advantages and
disadvantages involved in the implementation of this technology
are also
mailto:[email protected]
mailto:[email protected]
Journal of Digital Forensics, Security and Law, Vol. 8(1)
74](https://image.slidesharecdn.com/runningheadtheroleofquestionsinsolvingcrimes1thero-221128144752-5369c225/75/Running-head-THE-ROLE-OF-QUESTIONS-IN-SOLVING-CRIMES-1The-Ro-docx-10-2048.jpg)


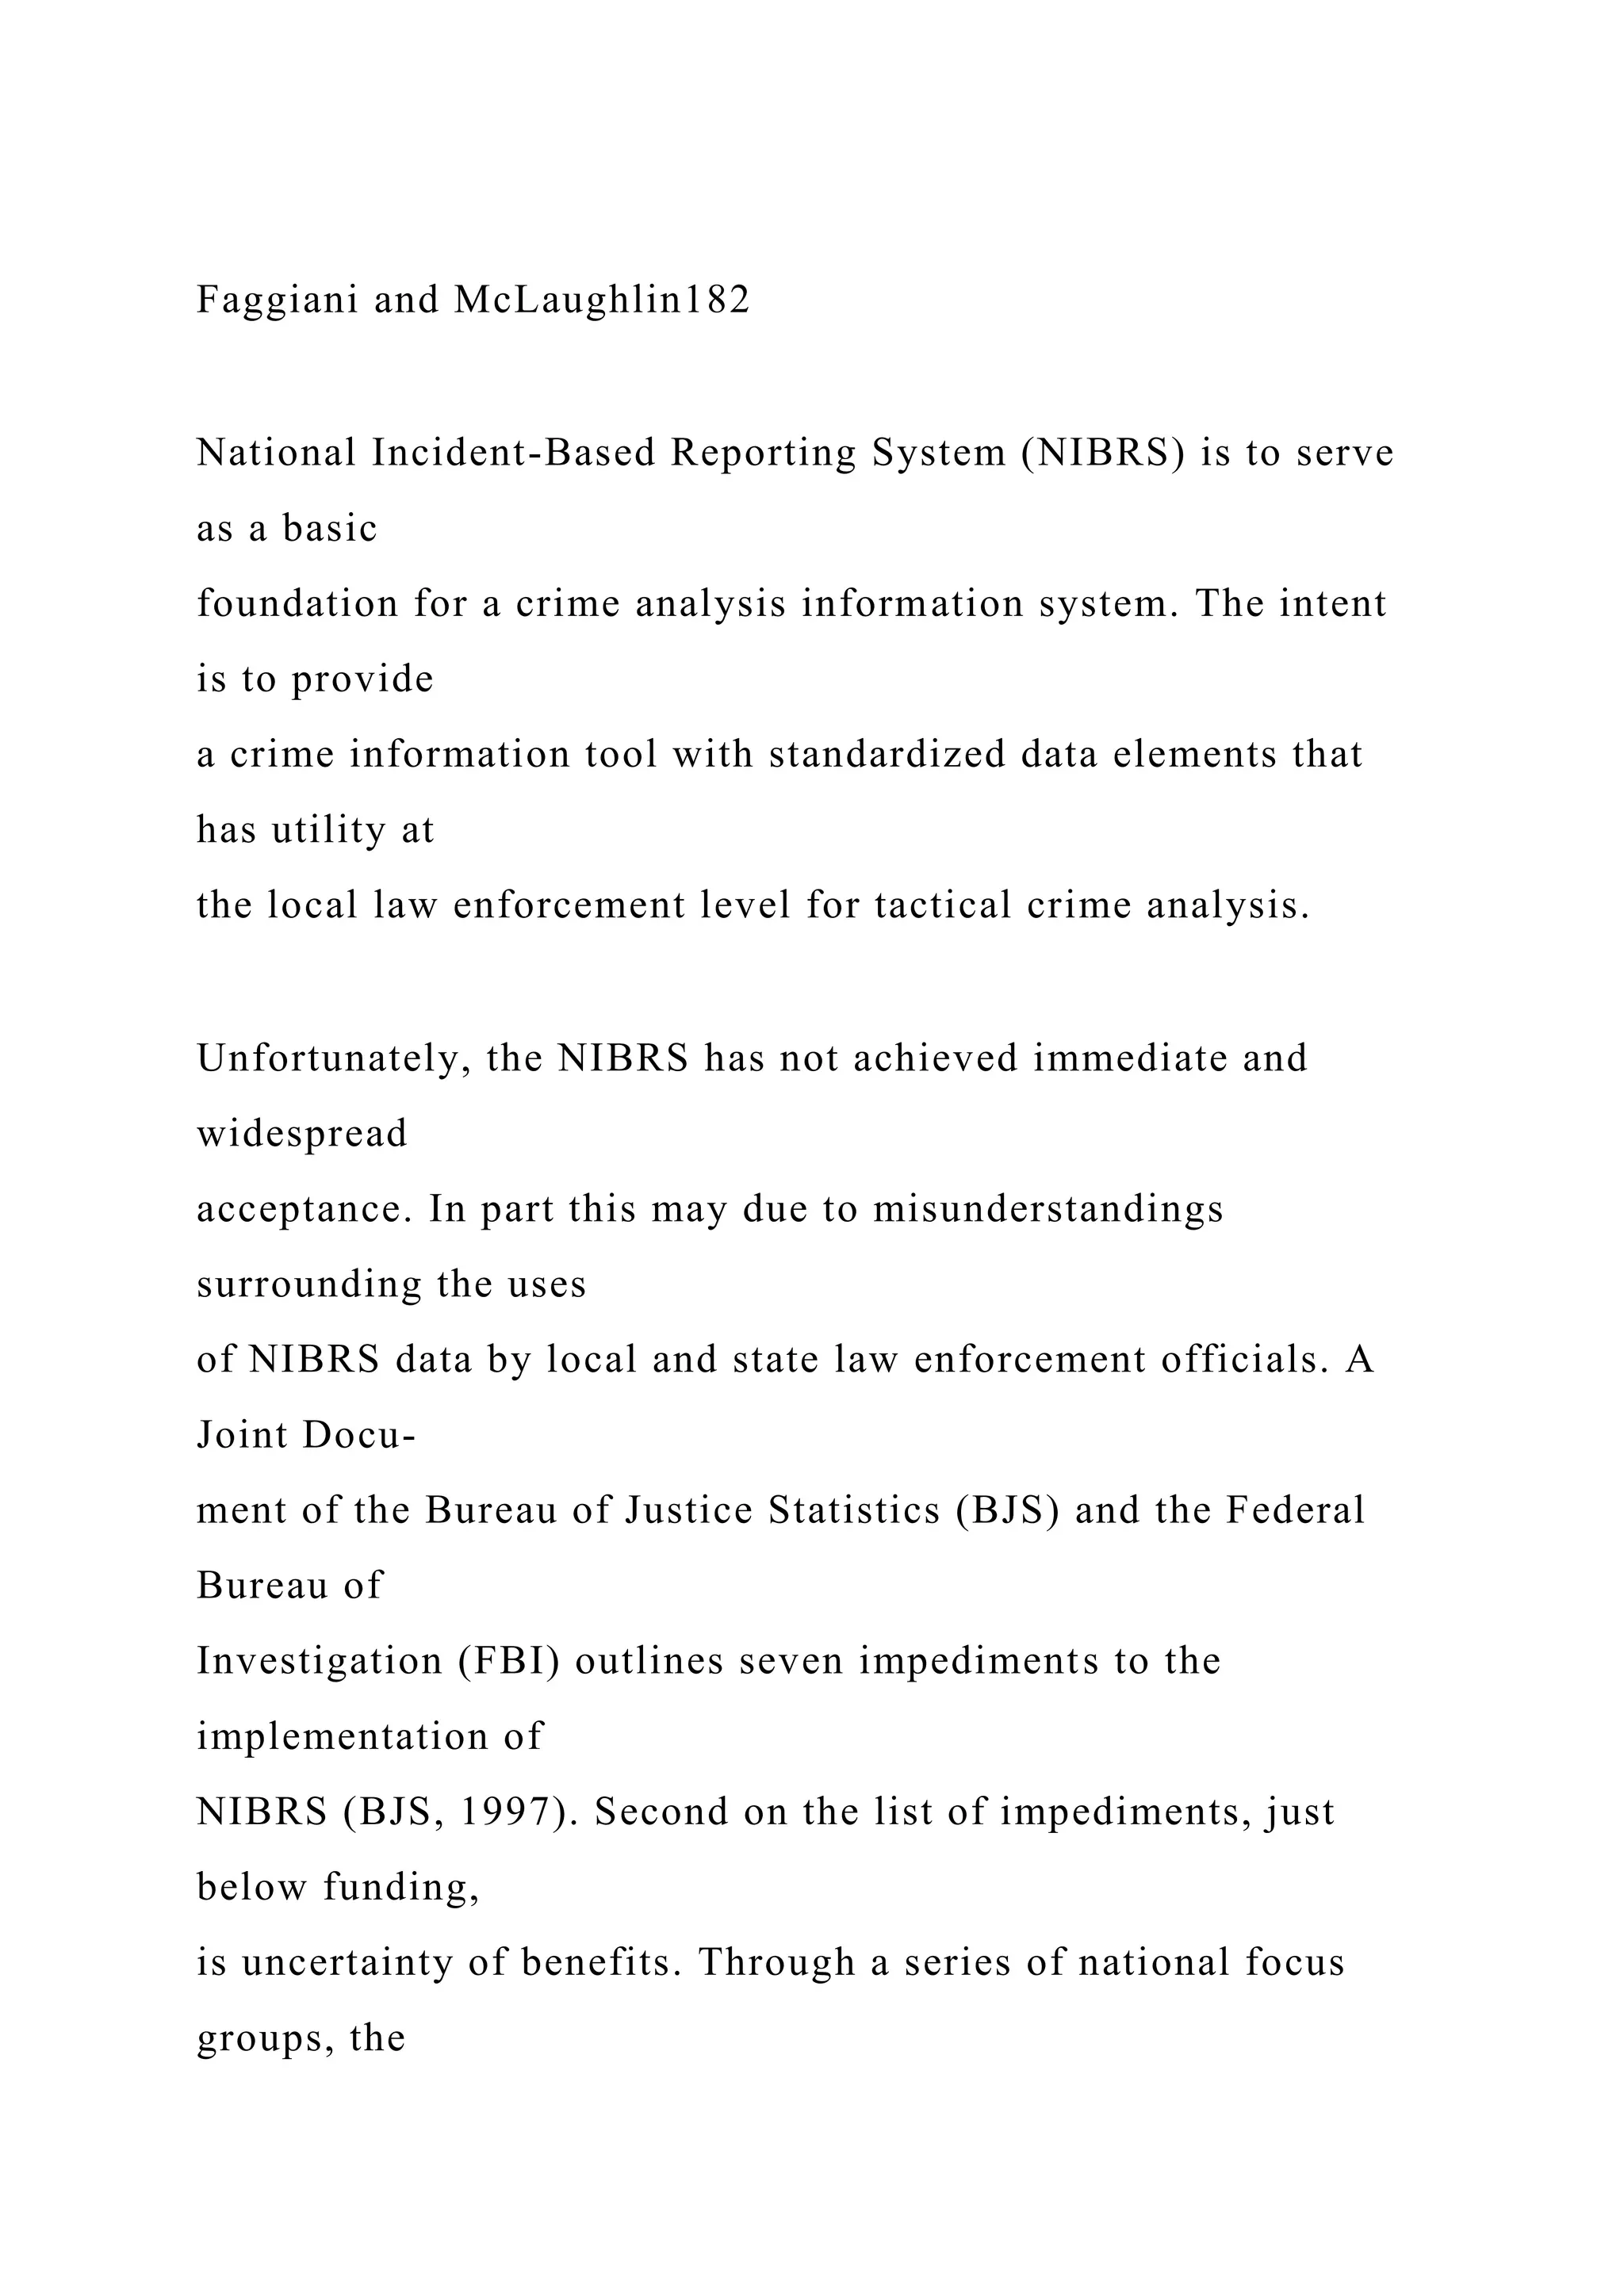
![information may
be the lifeblood of the police, a well-designed incident-based
data system
provides the infrastructure that maintains the information for
analyzing
emerging or ongoing crime problems. A primary objective of
the FBI’s
1Virginia Statistical Analysis Center, Department of Criminal
Justice Services, 805 East Broad
Street, Richmond, Virginia 23219.
2To whom correspondence should be addressed. e-mail:
[email protected]
3Departments of Surgery and Emergency Medicine, Medical
College of Virginia, Virginia
Commonwealth University, P.O. 980454, Richmond, Virginia
23298-0454.
181
0748-4518y99y0600-
Corporation](https://image.slidesharecdn.com/runningheadtheroleofquestionsinsolvingcrimes1thero-221128144752-5369c225/75/Running-head-THE-ROLE-OF-QUESTIONS-IN-SOLVING-CRIMES-1The-Ro-docx-62-2048.jpg)


![for product
•Elastic/inelastic
nature of demand
Organized crime
as enterprise
Goal: survive
and make profit
Figure 2
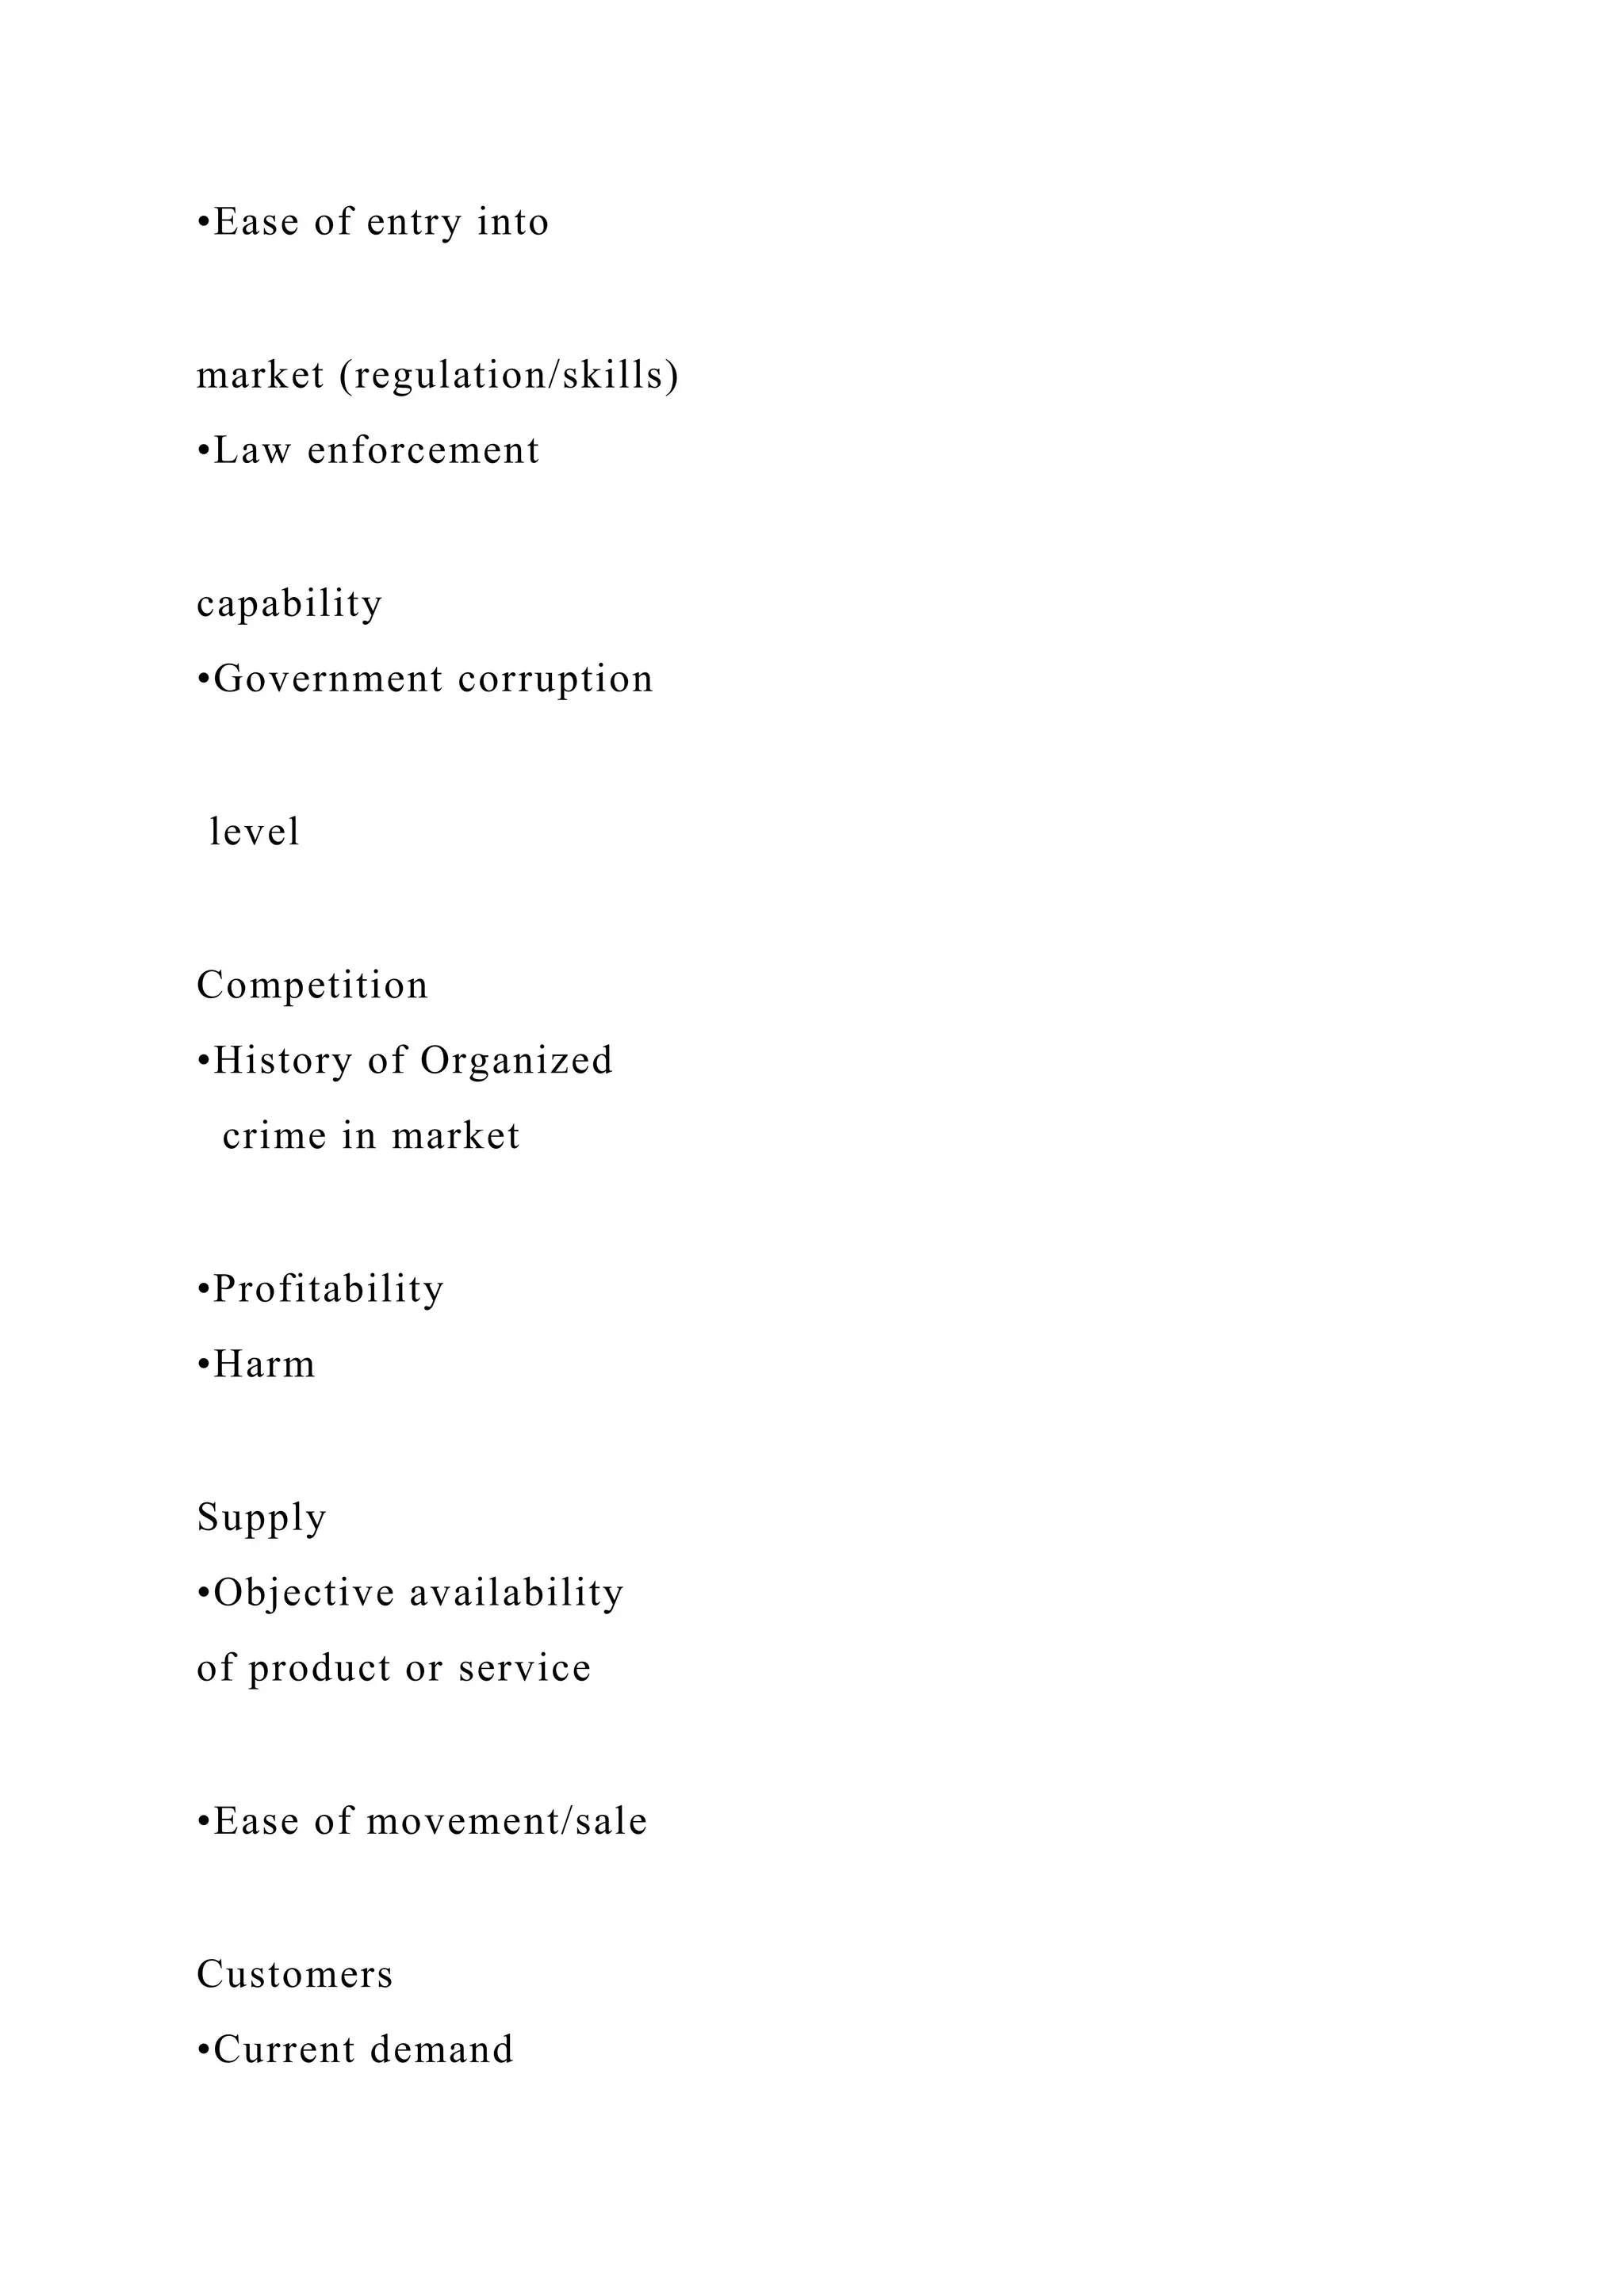
A Model of Organized Crime Operation in Illicit Markets
on its way up or down?), and periodic assessments are needed to
assess the impact
of efforts and initiatives against organized crime.
Summarized in another way, Figure 2 offers a 10-factor model
for risk assessment.
The types of variables include supply indicators ([a] objective
availability of product
or service, [b] ease of movement/sale), regulation indicators](https://image.slidesharecdn.com/runningheadtheroleofquestionsinsolvingcrimes1thero-221128144752-5369c225/75/Running-head-THE-ROLE-OF-QUESTIONS-IN-SOLVING-CRIMES-1The-Ro-docx-123-2048.jpg)
![([c] ease of entry into
market by its regulation and the skills needed, [d] law
enforcement capability and
competence, [e] level of local government corruption),
competition indicators
([f] history of organized crime in the market, [g] profitability,
[h] harm), demand indi-
cators ([i] current customer demand for product, [j] nature of
the demand—whether
elastic or inelastic). Using multiple indicators or measures for
each of the variables
(and for each product) would yield a reliable, comparative
assessment of risk.
The indicators in the risk assessment model can be combined
into an index for ease
of use in practice. The index would be based on the perceptions
and experiences of
those who might have knowledge of illicit products. Much in
the same way that the
Transparency International (2005) corruption surveys rely
heavily on perceptions of
business activities, analogous surveys at the local level could be
conducted to deter-
mine the circumstances surrounding the supply, demand,](https://image.slidesharecdn.com/runningheadtheroleofquestionsinsolvingcrimes1thero-221128144752-5369c225/75/Running-head-THE-ROLE-OF-QUESTIONS-IN-SOLVING-CRIMES-1The-Ro-docx-124-2048.jpg)


![/ZurichBT-BoldCondensedItalic
/ZurichBT-BoldExtended
/ZurichBT-BoldExtraCondensed
/ZurichBT-BoldItalic
/ZurichBT-ExtraBlack
/ZurichBT-ExtraCondensed
/ZurichBT-Italic
/ZurichBT-ItalicCondensed
/ZurichBT-Light
/ZurichBT-LightCondensed
/ZurichBT-LightCondensedItalic
/ZurichBT-LightExtraCondensed
/ZurichBT-LightItalic
/ZurichBT-Roman
/ZurichBT-RomanCondensed
/ZurichBT-RomanExtended
/ZurichBT-UltraBlackExtended
]
/NeverEmbed [ true
]
/AntiAliasColorImages false
/CropColorImages true
/ColorImageMinResolution 150
/ColorImageMinResolutionPolicy /OK
/DownsampleColorImages true](https://image.slidesharecdn.com/runningheadtheroleofquestionsinsolvingcrimes1thero-221128144752-5369c225/75/Running-head-THE-ROLE-OF-QUESTIONS-IN-SOLVING-CRIMES-1The-Ro-docx-198-2048.jpg)
![/ColorImageDownsampleType /Bicubic
/ColorImageResolution 300
/ColorImageDepth -1
/ColorImageMinDownsampleDepth 1
/ColorImageDownsampleThreshold 1.50000
/EncodeColorImages true
/ColorImageFilter /DCTEncode
/AutoFilterColorImages true
/ColorImageAutoFilterStrategy /JPEG
/ColorACSImageDict <<
/QFactor 0.15
/HSamples [1 1 1 1] /VSamples [1 1 1 1]
>>
/ColorImageDict <<
/QFactor 0.15
/HSamples [1 1 1 1] /VSamples [1 1 1 1]
>>
/JPEG2000ColorACSImageDict <<
/TileWidth 256
/TileHeight 256
/Quality 30
>>
/JPEG2000ColorImageDict <<
/TileWidth 256
/TileHeight 256](https://image.slidesharecdn.com/runningheadtheroleofquestionsinsolvingcrimes1thero-221128144752-5369c225/75/Running-head-THE-ROLE-OF-QUESTIONS-IN-SOLVING-CRIMES-1The-Ro-docx-199-2048.jpg)
![/Quality 30
>>
/AntiAliasGrayImages false
/CropGrayImages true
/GrayImageMinResolution 150
/GrayImageMinResolutionPolicy /OK
/DownsampleGrayImages true
/GrayImageDownsampleType /Bicubic
/GrayImageResolution 300
/GrayImageDepth -1
/GrayImageMinDownsampleDepth 2
/GrayImageDownsampleThreshold 1.50000
/EncodeGrayImages true
/GrayImageFilter /DCTEncode
/AutoFilterGrayImages true
/GrayImageAutoFilterStrategy /JPEG
/GrayACSImageDict <<
/QFactor 0.15
/HSamples [1 1 1 1] /VSamples [1 1 1 1]
>>
/GrayImageDict <<
/QFactor 0.15
/HSamples [1 1 1 1] /VSamples [1 1 1 1]
>>
/JPEG2000GrayACSImageDict <<](https://image.slidesharecdn.com/runningheadtheroleofquestionsinsolvingcrimes1thero-221128144752-5369c225/75/Running-head-THE-ROLE-OF-QUESTIONS-IN-SOLVING-CRIMES-1The-Ro-docx-200-2048.jpg)
![/None
]
/PDFX1aCheck false
/PDFX3Check false
/PDFXCompliantPDFOnly false
/PDFXNoTrimBoxError true
/PDFXTrimBoxToMediaBoxOffset [
0.00000
0.00000
0.00000
0.00000
]
/PDFXSetBleedBoxToMediaBox false
/PDFXBleedBoxToTrimBoxOffset [
0.00000
0.00000
0.00000
0.00000
]
/PDFXOutputIntentProfile (U.S. Web Coated 050SWOP051
v2)
/PDFXOutputConditionIdentifier ()
/PDFXOutputCondition ()
/PDFXRegistryName (http://www.color.org)
/PDFXTrapped /Unknown](https://image.slidesharecdn.com/runningheadtheroleofquestionsinsolvingcrimes1thero-221128144752-5369c225/75/Running-head-THE-ROLE-OF-QUESTIONS-IN-SOLVING-CRIMES-1The-Ro-docx-202-2048.jpg)


![60061006c0069007400650074002e0020005000440046002d0064
006f006b0075006d0065006e00740065006e0020006b0061006e0
02000f600700070006e006100730020006d006500640020004100
630072006f0062006100740020006f00630068002000520065006
100640065007200200035002e003000200065006c006c00650072
002000730065006e006100720065002e>
/ENU (Use these settings for creating PDF files for
submission to The Sheridan Press. These settings configured for
Acrobat v6.0 08/06/03.)
>>
>> setdistillerparams
<<
/HWResolution [2400 2400]
/PageSize [612.000 792.000]
>> setpagedevice](https://image.slidesharecdn.com/runningheadtheroleofquestionsinsolvingcrimes1thero-221128144752-5369c225/75/Running-head-THE-ROLE-OF-QUESTIONS-IN-SOLVING-CRIMES-1The-Ro-docx-210-2048.jpg)