Downloaded 10 times


![struct RString {
long len;
char *ptr;
};
Ruby String performance
struct RString {
long len;
char * ptr;
VALUE shared;
};
struct RString {
char ary[RSTRING_EMBED_LEN_MAX +1];
}
RSTRING_EMBED_LEN_MAX = 23](https://image.slidesharecdn.com/rubyperformance-130916051402-phpapp01/85/Ruby-14-320.jpg)


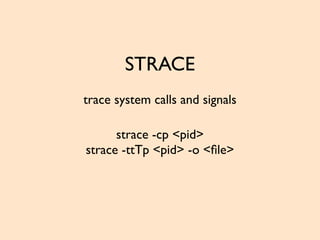


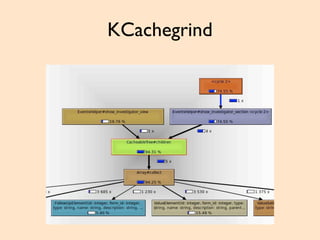
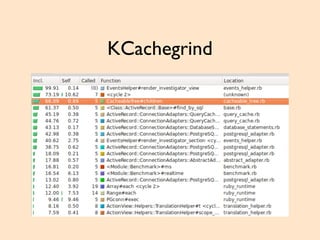


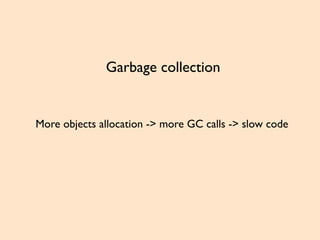
The document discusses Ruby performance profiling, highlighting issues such as slow code due to garbage collection and method calls. It covers tools for optimization, including the use of C extensions, memory profiling, and detailed system tracing methods. Recommendations include utilizing Ruby-prof, kcachegrind, and specific profiling commands for effective performance improvement.