Download to read offline


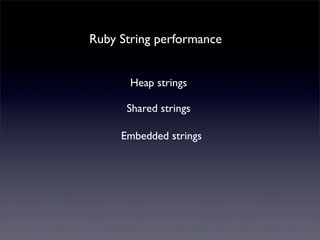
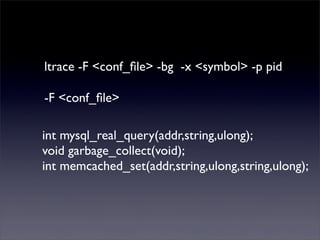
![struct RString {
long len;
char *ptr;
};
Ruby String performance
struct RString {
long len;
char *ptr;
VALUE shared;
};
struct RString {
char ary[RSTRING_EMBED_LEN_MAX +1];
}
RSTRING_EMBED_LEN_MAX = 23](https://image.slidesharecdn.com/rubyperformance-130522073952-phpapp01/85/Ruby-12-320.jpg)


The document details Ruby performance profiling techniques presented by Alexey Tulia, emphasizing the impact of garbage collection on Ruby applications and providing guidance on optimizing performance through various methods, including C extensions and profiling tools. It highlights the importance of understanding string performance and offers commands for tracing system calls. Additionally, it stresses the importance of not prematurely optimizing code and offers principles for effective profiling.