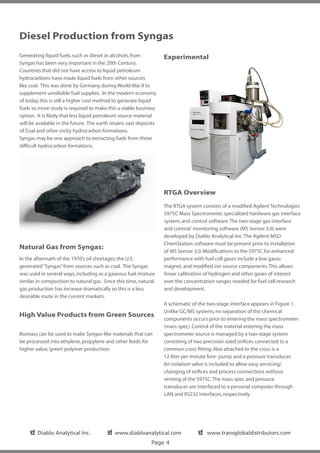
2012


       Fast Chemical Analysis for Fuels R&D:
       Application of the Diablo 5000A Real Time Gas Analyzer


       A Diablo Analytical White Paper

       The last few years have seen an accelerating pace of new fuel
       development. This has increasingly lead to the need for high
       performing diagnostic and monitoring tools that can help lower
       costs and improve efficiencies. Rapid quantitative chemical
       measurement can aid in the understanding and design of all aspects
       of fuel processing systems.
       The Diablo 5000A Real-Time Gas Analyzer (RTGA) based on the
       Agilent 5975 Mass Selective Detector has proven to be a powerful
       analytical tool for the study and optimization of fuel cell systems and
       ‘syngas’ production and use. This white paper will detail how the
       Diablo 5000A RTGA provides a stable, reliable and quantitative
       solution to continuous chemical monitoring in fuel processing
       systems that is not possible with residual gas analyzers.


                                         Dr. Terry Ramus and Dr. Scott Hein
                                                      Diablo Analytical Inc.
                                                              June 1, 2012
Fast Chemical Analysis for Fuels R&D
Application of the Diablo 5000A Real Time Gas Analyzer

Executive Summary

Today, fuels that power our modern economy can come from
many sources. Traditional hydrocarbon source materials
require more processing to make useful fuels.
Newer, potential alternative sources such as biomass can be
processed into alternative fuels. However, strategies for
process optimization and economic viability are still under
study. These traditional or new source materials can be
processed into intermediate gas mixtures such as “Syngas”
with a range of process conditions, catalysts and gas
compositions.

“Syngas” is a very flexible intermediate both in terms of
source materials, gas composition and use. For example,
either coal or biomass can generate Syngas mixtures.
Other materials such as water can alter the final gas
composition for different end uses. If the use is fuel cells,
then the Syngas should be rich in hydrogen gas and low in        In this kind of work, the processing system can change very
carbon monoxide. If the use is diesel manufacturing, then        quickly. Therefore, fast data rates are desirable for real-time
the Syngas could shift to be high in carbon monoxide.            process characterization.
Finally, the Syngas might be targeted to natural gas type uses   While gas chromatography can be a great compliment, the
with high methane levels. All of these uses as well as many      data rates are too slow for complete characterization on the
other possibilities require economically viable processes.       second time scale. Mass information from the mass spectro-
This requirement means that optimization and study are           meter in the 5000A RTGA is also very helpful for fundamental
essential.                                                       identification. This system, based on Agilent’s 5975C high
                                                                 performance quadrupole mass spectrometer, provides
The 5000A RTGA has proven to be a very powerful analytical       chemical quantitation and speciation, with wide dynamic
tool for the study and optimization of Syngas production and     range, in near real time. It provides a level of mass axis
use.                                                             stability, dynamic range, speed of response, and calibration
                                                                 ease that is not possible for lower cost residual gas
                                                                 analyzers. In addition, this same mass spectrometer system,
                                                                 with additional hardware, can be quickly modified for full
                                                                 GC-MS characterization of samples from a gas injection.
                                                                 This provides flexible options as the project adapts in new
                                                                 directions.


    ✔
    ❏ Diablo Analytical Inc.           ✔
                                       ❏ www.diabloanalytical.com               ✔
                                                                                ❏ www.transglobaldistributors.com
                                                            Page 2
Gas Generation for Fuel Cells
Fuel cells offer the promise                                        Fuel processors can consist of six basic operations that include:
of reliable power for a wide                                        1. 	Fuel vaporization,
range of applications with                                          2. 	Fuel pretreatment,
reduced emissions, better                                           3. 	Desulfurization,
efficiency, and less reliance                                       4. 	Hydrogen production,
on fossil fuels.                                                    5. 	Carbon monoxide reduction (partial oxidizers,
Applications include such                                           		 shift reactors), and
diverse areas as backup                                             6. 	Combustion of tail gases.
power generation,
distributed power,                                                  Chemical composition of fuel and oxidant can be used to
cogeneration, residential, automotive, public transportation,       predict performance and efficiency of fuel cell systems.
military, and consumer appliance. Fuel cells will play an           Thermal and partial oxidation reformer design and operation
important role as the worldwide demand for energy                   can also benefit from chemical measurements.
approximately doubles over the next 20 years.                       Various purification technologies are used in fuel cell
                                                                    systems. Chemical monitoring can assist in developing better
Until means are developed and infrastructure built for              systems. Some examples include: CaO adsorbent beds for
economic storage, transportation, and generation of                 CO2 removal, membranes (palladium/silver) for hydrogen
hydrogen, fuel processors will be a necessary component             purification, ZnO and other supported metal catalysts for
of most fuel cell systems. This includes both stationary and        desulfurization.
vehicular on-board systems.
                                                                    Reformers inherently dilute the hydrogen stream. Lower H2
Fuel processors are complex systems that must be optimized          concentrations can increase the risk of CO anode poisoning.
for efficient and trouble free operation of the overall fuel cell   High CO2 and N2 concentrations can lower performance
system.                                                             near the stack exit. Introduction of inert gases like N2, while
Most fuel cell developers agree that initial products for           not harmful, do alter the hydrogen concentration and can
portable and stationary fuel cells applications will rely on        affect performance. Monitoring of these gases may assist in
fossil fuels. The generation of hydrogen from these fuels is a      reformer optimization.
critical first step in fuel cell development.
                                                                    Fast chemical measurements can also assist in the develop-
The task of fuel processors or fuel                                 ment and understanding of fuel cell stacks, particularly
reformers is to produce a gas                                       Proton Exchange Membrane (PEM) systems that operate at
mixture with high hydrogen                                          low temperatures. Some areas where chemical measure-
content without harmful levels                                      ments are useful include model development and validation,
of impurities that will poison the                                  impurity tolerance studies, and water management. (3)
downstream fuel cell system.                                        In general, the lower the operating temperature of the stack,
Potential fuels include natural gas,                                the greater the demand for fuel purity.
gasoline, diesel, methanol, ethanol,
and biomass. In reality, the refor-                                 While methanol powered fuel cells are attractive, much
mate obtained from processors can                                   development work remains. Chemical measurements can
contain many compounds along                                        assist in understanding CO2 management. In direct methanol
with the desired hydrogen content. Also, electrochemical            fuel cells, CO2 is the primary reaction product of methanol
efficiencies depend on the amount and quality of hydrogen           oxidation at the anode. Large amounts of CO2 can
produced. These are a few of the reasons why chemical               accumulate in the stack and lower cell efficiency. Methanol
monitoring is essential to understanding and optimizing             crossover between anode and cathode can also be studied
a given fuel cell system.                                           through chemical monitoring. (3)


    ✔
    ❏ Diablo Analytical Inc.              ✔
                                          ❏ www.diabloanalytical.com                ✔
                                                                                    ❏ www.transglobaldistributors.com
                                                               Page 3
Diesel Production from Syngas
Generating liquid fuels, such as diesel or alcohols, from          Experimental
Syngas has been very important in the 20th Century.
Countries that did not have access to liquid petroleum
hydrocarbons have made liquid fuels from other sources
like coal. This was done by Germany during World War II to
supplement unreliable fuel supplies. In the modern economy
of today, this is still a higher cost method to generate liquid
fuels so more study is required to make this a viable business
option. It is likely that less liquid petroleum source material
will be available in the future. The earth retains vast deposits
of Coal and other rocky hydrocarbon formations.
Syngas may be one approach to extracting fuels from these
difficult hydrocarbon formations.


                                                                   RTGA Overview
                                                                   The RTGA system consists of a modified Agilent Technologies
                                                                   5975C Mass Spectrometer, specialized hardware gas interface
                                                                   system, and control software. The two-stage gas interface
                                                                   and control/ monitoring software (MS Sensor 3.0) were
                                                                   developed by Diablo Analytical, Inc. The Agilent MSD
                                                                   ChemStation software must be present prior to installation
Natural Gas from Syngas:
                                                                   of MS Sensor 3.0. Modifications to the 5975C for enhanced
In the aftermath of the 1970’s oil shortages, the U.S.             performance with fuel cell gases include a low gauss
generated “Syngas” from sources such as coal. The Syngas           magnet, and modified ion source components. This allows
was used in several ways, including as a gaseous fuel mixture      linear calibration of hydrogen and other gases of interest
similar in composition to natural gas. Since this time, natural    over the concentration ranges needed for fuel cell research
gas production has increase dramatically so this is a less         and development.
desirable route in the current markets.
                                                                   A schematic of the two-stage interface appears in Figure 1.
                                                                   Unlike GC/MS systems, no separation of the chemical
High Value Products from Green Sources
                                                                   components occurs prior to entering the mass spectrometer
                                                                   (mass spec). Control of the material entering the mass
Biomass can be used to make Syngas-like materials that can         spectrometer source is managed by a two-stage system
be processed into ethylene, propylene and other feeds for          consisting of two precision sized orifices connected to a
higher value, ‘green’ polymer production.                          common cross fitting. Also attached to the cross is a
                                                                   12-liter per minute fore- pump and a pressure transducer.
                                                                   An isolation valve is included to allow easy servicing/
                                                                   changing of orifices and process connections without
                                                                   venting of the 5975C. The mass spec and pressure
                                                                   transducer are interfaced to a personal computer through
                                                                   LAN and RS232 interfaces, respectively.


    ✔
    ❏ Diablo Analytical Inc.            ✔
                                        ❏ www.diabloanalytical.com               ✔
                                                                                 ❏ www.transglobaldistributors.com
                                                             Page 4
Figure 1:
                                                                                 Diagram of the two-stage gas interface system.

Calibration of the pressure transducer is performed only at       Table 1: RTGA Configuration and Conditions
initial setup by capping off the process gas and the interface
fore-line pump connections, followed by pumping down the          Real Time Gas Analyzer		
interface and transducer with the 5975C vacuum system.            Mass Spectrometer	         5975C
The zero is then set from the transducers controller/ display     Pump	                      Performance turbo
front panel as per supplied instructions.                         Ionization mode	           Electron impact
                                                                  Mass range 	               1.6 - 800 u (0.1 µ steps)
In operation, the process gas is pulled through the first stage   Resolution	                1 amu
orifice under sonic flow conditions using the 12-liter/min        Source temperature	        230 °C
pump. Using the 30-micron orifice, approximately 8 to             Quad temperature	          150 °C
15-mL/min flow is required to satisfy system demands.             Typical scan range	        1.6 to 50 amu
Pressure at this point in the cross, which is dependent on gas    Threshold	100
composition and process inlet pressure, can be monitored          Samples (2^)	              4 Typical
using the capacitance monometer. A small amount of                Tune (typical) 	           Low mass or hydrogen tunes
material, regulated by the size of the second stage orifice,      5975 ChemStation software	 G1701EA
enters the mass spectrometer source under molecular flow
conditions. This interface design as well as the design of the    Gas Inlet System	              Diablo Analytical 5000A
mass spectrometer allows quantitative work to be performed        First stage orifice 	          30 Micron
for a wide range of materials over wide dynamic ranges.           Second stage orifice 	         50 Micron
                                                                  Fore pump Pfeiffer/Edwards 	   10 to 12 l/m
Ions are selected, calibrated and monitored using custom          Inlet temperature 	            Ambient to 200 °C
control software that is installed over the parent mass spec      Pressure transducer 	          MKS Capacitance monometer
ChemStation software. Information is displayed in up to six       Heater assembly	               Ambient to 200 °C
display windows that support real time monitoring of the          Temperature controller	        Integrated Watlow
defined signals (usually an ion representative of a single or     Process stream in pressure 	   Atmospheric pressure to 	
group of compounds). Data is also sent to a CSV file for later    		                             hundreds of PSI (depends on 	
processing in Excel, for example.                                 		                             sampling orifice)
                                                                  Process stream in flow 	       30 mL/min minimum (or
Calibration of the system can be performed using a                		                             much more or much less)
dynamic blending system, or gas cylinder bland mixtures.          Gas mixtures	
Gas standards can be diluted in various matrices such as          Fuel cell mix	                 50% H2, 10 % CO2, 5% CH4
helium, nitrogen, and natural gas at the point of use and time    Natural gas	                   70% CH4, 9% C2, 6% C3, 3%
of use for the purpose of establishing calibration curves over    		                             iC4
the concentration range of interest.                              			                            3% nC4, 1% IC4, 1% nC4,
Instrumental hardware details, operating conditions, and          			                            1.5% CO2
software versions are given in Table 1.                           Other gases (as pure gases)	   H2, O2, N2, CO2, CO
                                                                  RTGA Software	
                                                                  Operating system	              Windows XP SP3,
                                                                  		                             Windows 7 x32
                                                                  RTGA Control 	                 Diablo MS Sensor 3.0

    ✔
    ❏ Diablo Analytical Inc.            ✔
                                        ❏ www.diabloanalytical.com              ✔
                                                                                ❏ www.transglobaldistributors.com
                                                             Page 5
Results and Discussion
Inlet Setup

The gas interface was installed with 30 and 50 micron orifices         For example, a simple pressure corrected hydrogen signal
for stage 1 and stage 2, respectively. This combination is             can be defined in the software as: (Sig1.Raw)/(Sig2.Raw)*
suitable for concentration ranges from about 0.1% to 100%              (P-nominal), where Sig1 is mass 2 for hydrogen, Sig2 is
for most fuel cell gases such as H2, O2, and CO2.                      pressure and P-nominal is about 0.1 torr (typical) in the
For trace analysis the stage orifice can be changed to 300             interface.
or 350 micron. Also, if a smaller total flow from the process
being monitored is desired, then the sampling orifice can be           The MS Sensor software allows user defined formulas to be
changed and or a direct, low volume, connection can be used            applied to any defined instrument signal in real time for
for sample introduction.                                               custom calculations, signal ratios, normalization, background
                                                                       corrections, etc. This gives the user a great deal of flexibility in
All material entering the mass spec interface must be in the           customizing the method for a particular task.
gas phase. In some cases, this may require the user to supply
and add additional sample conditioning hardware upstream
                                                                       Tuning the Mass Spectrometer
of the system (for example vaporizer). The pressure trans-
ducer’s response is independent of gas type. However, the              Several automated tuning procedures are available with
flow rate through the orifices and hence pressure in the cross         the RTGA system that make mass axis calibration and signal
is dependent on gas type due to differences in viscosity.              optimization easy and straightforward for the user. Three
This is illustrated in Figure 2 where cross pressure is plotted        tunes that are useful for fuel cell applications are listed
for He and N2 at a series of process inlet pressures.                  below. The Atune is a general-purpose tune and a good place
                                                                       to start when the system is initially setup or after hardware
                                                                       maintenance. For best performance and linearity over a wide
                                                                       concentration range for all common gases (hydrogen to
                                                                       carbon dioxide through common sulfur compounds up to
                                                                       tetrahydothiophene), the custom tune (Htune) is
                                                                       recommended. To cover a higher mass range up to 250 amu,
                                                                       without optimized hydrogen response, the “low mass” or
                                                                       Ltune is provided. Once tuned, the 5975C will not require
                                                                       re-tuning for many weeks or months depending on the
                                                                       particular set of operating conditions.

Figure 2: Effect of gas type and process pressure on cross pressure.   Custom tunes can also be developed by the user to meet
                                                                       specific needs of the application. These are easily constructed
Since response of the mass spec is dependent on source                 from within the 5975C software, by starting with parameters
pressure, the transducer’s pressure measurement can be                 from one of the standard tune files.
used to correct a given ion signal.
                                                                       Tune file	         Purpose
This may be useful if the inlet process pressure is subject to         Atune or Stune 	   General mass spec tune
fluctuation or when gas calibrations cover a very wide                 Ltune 	            Optimized for mass ranges to approx. 250,
viscosity range. The pressure reading is treated in the same           		                 not H2
way as defined chemical masses are in the software.                    Htune 	            Optimized for hydrogen and other fuel
A basic method consists of defined ions representative of              			                or combustion gases
unique masses for each compound to be monitored and the                Custom	            Optimized for application (user developed)
pressure reading if desired.


     ✔
     ❏ Diablo Analytical Inc.              ✔
                                           ❏ www.diabloanalytical.com                  ✔
                                                                                       ❏ www.transglobaldistributors.com
                                                                 Page 6
Ion Monitoring
Figure 3 is representative of the real time signal display that    Trace level gases may also require longer purge times to
is a core software feature. Here five signals were defined and     stabilize. The 5000A RTGA interface is electro- polished high
plotted in one window. Masses defined as separate signals          quality stainless steel to minimize any passivation issues.
were 2, 16, 27, 30, 43, and 44, for H2, CH4, C2 to C5’s, ethane,   The design of the 5000A RTGA interface allows very fast
C3 to C5’s, and CO2, respectively. Unique ions exist for           sample response time on the second time scale for typical
hydrogen, methane, ethane, and carbon dioxide, while for           applications.
C2—C5 a composite mass is required since a significant
unique mass for each hydrocarbon is not available. This figure
                                                                   Signal Calibration
is intended to illustrate a generic application with many of
the compounds that might be found in a fuel cell reformer          In nearly all cases linear calibrations can be constructed for
feed or reformer output. Also, note the step change that           the common fuel related gases over the concentration ran-
occurs when hydrogen production startup occurs. The system         ges that can be encountered during the R&D, prototype or
is able to capture and record very rapid changes in a process      pilot phases. The software is designed to make the calibra-
that may be missed by other measurement techniques.                tion process easy and straightforward. The user inputs for a
                                                                   given defined signal a series of responses and concentrations
The monitoring of hydrocarbons, in addition to the common          from calibration runs. The software then calculates the linear
fuel related gases, can be useful to check conversion percen-      equation to be used. An example is shown in Figure 5 for
tages and to monitor the potential for carbon deposition in        nitrogen in hydrogen calibration. Amounts and responses
process systems, for example.                                      were input for a three-point calibration into a popup window
                                                                   that is available under the edit signal menu. The linear
                                                                   equation is calculated and automatically applied to the N2
                                                                   signal in this example. This process is repeated for each ion.


                                                                                                  Figure 4:
                                                                                                  System calibration screen.
                                                                                                  Nitrogen in hydrogen used
                                                                                                  as example.


Figure 3: Graphical display of five signals: methane, C3-C5
hydrocarbons, C2-C5 hydrocarbons, carbon dioxide, ethane,
and hydrogen. Scan range: 12 - 46 amu.


Speed of Response
Three variables are primarily responsible for limits on system
response time: amount of time spent collecting signal at a
given mass; number of masses in the method; distance and
tubing size used to interface system to the process.
For example, in a typical fuel related method monitoring
five ions that are expected to be present in the percent level
range, response to a perturbation will be registered by the        Carbon Monoxide and Nitrogen
RTGA on the seconds time scale. For trace level analysis at        Both nitrogen and carbon monoxide have a mass of 28,
ppm and ppb levels, longer response times may require for          they cannot be differentiated using the RTGA under normal
data collection at longer dwell times.                             operational modes. Carbon dioxide may also generate a
                                                                   small fragment ion at 28 amu. In most practical situations
                                                                   N2 or CO2, at some level is likely to be present, but the
                                                                   concentration level may not interfere for many applications.


    ✔
    ❏ Diablo Analytical Inc.             ✔
                                         ❏ www.diabloanalytical.com               ✔
                                                                                  ❏ www.transglobaldistributors.com
                                                              Page 7
Performance and Calibration:
H2, CO2, O2, N2, CH4

The use and performance of any chemical measurement              Calibration plots for CO2 over concentration ranges of
system is enhanced if quantitative information is easy to        5% to 60% and 0.5% to 7% appear in Figures 7 and 8,
obtain. In the study of fuel related systems, quantitative       respectively. Finally, calibrations are shown respectively
chemical analysis is required in addition to qualitative         for oxygen, nitrogen and methane, in Figures 9, 10 and 11.
trending. Calibration plots are shown in Figures 5 and 6, for
H2 in nitrogen and helium, respectively. Both show good
linearity over a wide concentration range indicating that
simple two point calibrations could be performed as
described above in the Calibration section. Correlation
coefficients are better than 0.99. A more sensitive indication
of hydrogen response can be seen in Figure 7 where               Insert Graph Figure 7
response factors are plotted for dilution of a fuel cell mix
(50% H2, 10% CO2, 5% CH4) in helium. Variation in response
over the concentration range used is approximately ±10 %.


                                                                 Figure 7: Calibration of carbon dioxide (5 to 60%) in helium.


Figure 5: Calibration of hydrogen in nitrogen diluent.           Figure 8: Calibration of carbon dioxide (0.5 to 7%) in fuel cell mix.


Figure 6: Calibration of hydrogen in helium diluent.             Figure 9: Calibration of oxygen in helium. NITROGEN?


     ✔
     ❏ Diablo Analytical Inc.             ✔
                                          ❏ www.diabloanalytical.com              ✔
                                                                                  ❏ www.transglobaldistributors.com
                                                             Page 8
Figure 10: Calibration of nitrogen in hydrogen.                   Figure 12: Calibration of dimethyl disulfide at the ppb level.
                                                                  Ion 94 monitored.


                                                                  Figure 13: Monitoring stepwise changes in low-level sulfur gases.

Figure 11: Calibration of methane in fuel cell mix.

These calibrations all show reasonably good linearity over
the plotted concentration ranges, making it possible to
calibrate a gas with just two data points. These points should
be chosen so that the calibration range is representative of
the expected concentrations whenever possible.
All calibrations were performed with mass spec parameters
from an automated tune using a scan range from 1.6 to
46 amu.


Measurement of Low-level Impurities

Monitoring and quantitation of low-level impurities,              Figure 14: Monitoring stepwise changes in low-level sulfur
including sulfur containing compounds is a significant area       gases: Step 1: 1.0 ppm (mercaptans) to Step 5: 4.0ppm
of study in fuel gases and related catalyst development.          (mercaptans).
For example, odorants present in natural gas feed to some
fuel processors must be removed to levels well below 1ppm,
using activated carbon beds in many cases, prior to steam
reforming. Fig. 12 shows the calibration of dimethyl disulfide
to demonstrate typical performance capability in the ppb
range. Figures 13 & 14 show stepwise changes of low-level
sulfur gases, illustrating the inertness of the RTGA interface.

     ✔
     ❏ Diablo Analytical Inc.              ✔
                                           ❏ www.diabloanalytical.com             ✔
                                                                                  ❏ www.transglobaldistributors.com
                                                             Page 9
Conclusions
The main challenge to successful alternative fuel                 Acknowledgement & References
commercialization is cost reduction. There is increasing          1.	 Fuel Cell Handbook, Fifth Edition, Business/Technology
focus on fuel processor design and catalyst optimization.         	 Books, Orinda, CA.
With the level of development effort intensifying in all fuel     2.	 Fuel Cell Integration-A Study of the Impacts of Gas Quality
cell and fuel processor technologies, any tools that can assist   	 and Impurities, D.C. Dayton, M. Ratcliff, R. Bain, NREL,
with this challenge are being used. Detailed, real time, and      	 Golden, Colorado, 2001.
quantitative chemical analysis can be powerful tools when         3.	 Fuel Cell Systems Explained, J. Larminie, A. Dicks,
applied to alternative fuel development and optimization.         	 John Wiley & Sons, LTD, England, 2002.
This applies to the incoming fuels, processed fuels, reformer     4.	 R. Firor and B. Quimby, “Automated Dynamic Blending
output, partial oxidation system gases, and fuel cell stack       	 System for the Agilent 6890 Gas Chromatograph:
electrochemical reaction gases.                                   		 Low Level Sulfur Detection” Agilent Application Note,
                                                                                                    ,
                                                                  	 publication 5988-2465EN, April 2001.
The Diablo 5000A RTGA provides a stable, reliable, and            5.	 M. Feeney, P. Larson, B. Wilson, “Analysis of Fuel Cell
quantitative solution to continuous chemical monitoring           		 Reformer Gases in Seconds Using the Agilent 3000 Micro
in fuel processing systems that is not possible with residual     	 Gas Chromatograph” Agilent Application Note, publication
                                                                                             ,
gas analyzers. Good linearity is seen for hydrogen and other      	 5988-5296EN, February 2002.
gases that are encountered in fuel cell systems over a wide       6.	 R. Firor, M. Klee, “Chemical Analysis in Fuel Cell Systems”
                                                                                                                                ,
concentration range from ppb to percent levels, making            	 Agilent Application Note, publication, February 2002.
calibration of the system straightforward. With a response
time of 1 to 5 seconds, the system can monitor and capture
rapid transients that can be missed by other monitoring
equipment.


Please contact us at:


Diablo Analytical, Inc.                                           TransGlobal Distributors B.V.
5141 Lone Tree Way                                                Cairostraat 10
Antioch, CA 94531                                                 3047 BC Rotterdam
T:	 (925) 755-1005                                                The Netherlands
F:	 (925) 755-1007                                                T:	 +31-10-258 1870
E:	info@diabloanalytical.com                                      F:	 +31-10-258 1879
                                                                  E: 	info@transglobaldistributors.com
                                                                  I: 	 www.transglobaldistributors.com

Fast Chemical Analysis for Fuels R&D: The RTGA White Paper 2012

  • 1.
    2012 Fast Chemical Analysis for Fuels R&D: Application of the Diablo 5000A Real Time Gas Analyzer A Diablo Analytical White Paper The last few years have seen an accelerating pace of new fuel development. This has increasingly lead to the need for high performing diagnostic and monitoring tools that can help lower costs and improve efficiencies. Rapid quantitative chemical measurement can aid in the understanding and design of all aspects of fuel processing systems. The Diablo 5000A Real-Time Gas Analyzer (RTGA) based on the Agilent 5975 Mass Selective Detector has proven to be a powerful analytical tool for the study and optimization of fuel cell systems and ‘syngas’ production and use. This white paper will detail how the Diablo 5000A RTGA provides a stable, reliable and quantitative solution to continuous chemical monitoring in fuel processing systems that is not possible with residual gas analyzers. Dr. Terry Ramus and Dr. Scott Hein Diablo Analytical Inc. June 1, 2012
  • 2.
    Fast Chemical Analysisfor Fuels R&D Application of the Diablo 5000A Real Time Gas Analyzer Executive Summary Today, fuels that power our modern economy can come from many sources. Traditional hydrocarbon source materials require more processing to make useful fuels. Newer, potential alternative sources such as biomass can be processed into alternative fuels. However, strategies for process optimization and economic viability are still under study. These traditional or new source materials can be processed into intermediate gas mixtures such as “Syngas” with a range of process conditions, catalysts and gas compositions. “Syngas” is a very flexible intermediate both in terms of source materials, gas composition and use. For example, either coal or biomass can generate Syngas mixtures. Other materials such as water can alter the final gas composition for different end uses. If the use is fuel cells, then the Syngas should be rich in hydrogen gas and low in In this kind of work, the processing system can change very carbon monoxide. If the use is diesel manufacturing, then quickly. Therefore, fast data rates are desirable for real-time the Syngas could shift to be high in carbon monoxide. process characterization. Finally, the Syngas might be targeted to natural gas type uses While gas chromatography can be a great compliment, the with high methane levels. All of these uses as well as many data rates are too slow for complete characterization on the other possibilities require economically viable processes. second time scale. Mass information from the mass spectro- This requirement means that optimization and study are meter in the 5000A RTGA is also very helpful for fundamental essential. identification. This system, based on Agilent’s 5975C high performance quadrupole mass spectrometer, provides The 5000A RTGA has proven to be a very powerful analytical chemical quantitation and speciation, with wide dynamic tool for the study and optimization of Syngas production and range, in near real time. It provides a level of mass axis use. stability, dynamic range, speed of response, and calibration ease that is not possible for lower cost residual gas analyzers. In addition, this same mass spectrometer system, with additional hardware, can be quickly modified for full GC-MS characterization of samples from a gas injection. This provides flexible options as the project adapts in new directions. ✔ ❏ Diablo Analytical Inc. ✔ ❏ www.diabloanalytical.com ✔ ❏ www.transglobaldistributors.com Page 2
  • 3.
    Gas Generation forFuel Cells Fuel cells offer the promise Fuel processors can consist of six basic operations that include: of reliable power for a wide 1. Fuel vaporization, range of applications with 2. Fuel pretreatment, reduced emissions, better 3. Desulfurization, efficiency, and less reliance 4. Hydrogen production, on fossil fuels. 5. Carbon monoxide reduction (partial oxidizers, Applications include such shift reactors), and diverse areas as backup 6. Combustion of tail gases. power generation, distributed power, Chemical composition of fuel and oxidant can be used to cogeneration, residential, automotive, public transportation, predict performance and efficiency of fuel cell systems. military, and consumer appliance. Fuel cells will play an Thermal and partial oxidation reformer design and operation important role as the worldwide demand for energy can also benefit from chemical measurements. approximately doubles over the next 20 years. Various purification technologies are used in fuel cell systems. Chemical monitoring can assist in developing better Until means are developed and infrastructure built for systems. Some examples include: CaO adsorbent beds for economic storage, transportation, and generation of CO2 removal, membranes (palladium/silver) for hydrogen hydrogen, fuel processors will be a necessary component purification, ZnO and other supported metal catalysts for of most fuel cell systems. This includes both stationary and desulfurization. vehicular on-board systems. Reformers inherently dilute the hydrogen stream. Lower H2 Fuel processors are complex systems that must be optimized concentrations can increase the risk of CO anode poisoning. for efficient and trouble free operation of the overall fuel cell High CO2 and N2 concentrations can lower performance system. near the stack exit. Introduction of inert gases like N2, while Most fuel cell developers agree that initial products for not harmful, do alter the hydrogen concentration and can portable and stationary fuel cells applications will rely on affect performance. Monitoring of these gases may assist in fossil fuels. The generation of hydrogen from these fuels is a reformer optimization. critical first step in fuel cell development. Fast chemical measurements can also assist in the develop- The task of fuel processors or fuel ment and understanding of fuel cell stacks, particularly reformers is to produce a gas Proton Exchange Membrane (PEM) systems that operate at mixture with high hydrogen low temperatures. Some areas where chemical measure- content without harmful levels ments are useful include model development and validation, of impurities that will poison the impurity tolerance studies, and water management. (3) downstream fuel cell system. In general, the lower the operating temperature of the stack, Potential fuels include natural gas, the greater the demand for fuel purity. gasoline, diesel, methanol, ethanol, and biomass. In reality, the refor- While methanol powered fuel cells are attractive, much mate obtained from processors can development work remains. Chemical measurements can contain many compounds along assist in understanding CO2 management. In direct methanol with the desired hydrogen content. Also, electrochemical fuel cells, CO2 is the primary reaction product of methanol efficiencies depend on the amount and quality of hydrogen oxidation at the anode. Large amounts of CO2 can produced. These are a few of the reasons why chemical accumulate in the stack and lower cell efficiency. Methanol monitoring is essential to understanding and optimizing crossover between anode and cathode can also be studied a given fuel cell system. through chemical monitoring. (3) ✔ ❏ Diablo Analytical Inc. ✔ ❏ www.diabloanalytical.com ✔ ❏ www.transglobaldistributors.com Page 3
  • 4.
    Diesel Production fromSyngas Generating liquid fuels, such as diesel or alcohols, from Experimental Syngas has been very important in the 20th Century. Countries that did not have access to liquid petroleum hydrocarbons have made liquid fuels from other sources like coal. This was done by Germany during World War II to supplement unreliable fuel supplies. In the modern economy of today, this is still a higher cost method to generate liquid fuels so more study is required to make this a viable business option. It is likely that less liquid petroleum source material will be available in the future. The earth retains vast deposits of Coal and other rocky hydrocarbon formations. Syngas may be one approach to extracting fuels from these difficult hydrocarbon formations. RTGA Overview The RTGA system consists of a modified Agilent Technologies 5975C Mass Spectrometer, specialized hardware gas interface system, and control software. The two-stage gas interface and control/ monitoring software (MS Sensor 3.0) were developed by Diablo Analytical, Inc. The Agilent MSD ChemStation software must be present prior to installation Natural Gas from Syngas: of MS Sensor 3.0. Modifications to the 5975C for enhanced In the aftermath of the 1970’s oil shortages, the U.S. performance with fuel cell gases include a low gauss generated “Syngas” from sources such as coal. The Syngas magnet, and modified ion source components. This allows was used in several ways, including as a gaseous fuel mixture linear calibration of hydrogen and other gases of interest similar in composition to natural gas. Since this time, natural over the concentration ranges needed for fuel cell research gas production has increase dramatically so this is a less and development. desirable route in the current markets. A schematic of the two-stage interface appears in Figure 1. Unlike GC/MS systems, no separation of the chemical High Value Products from Green Sources components occurs prior to entering the mass spectrometer (mass spec). Control of the material entering the mass Biomass can be used to make Syngas-like materials that can spectrometer source is managed by a two-stage system be processed into ethylene, propylene and other feeds for consisting of two precision sized orifices connected to a higher value, ‘green’ polymer production. common cross fitting. Also attached to the cross is a 12-liter per minute fore- pump and a pressure transducer. An isolation valve is included to allow easy servicing/ changing of orifices and process connections without venting of the 5975C. The mass spec and pressure transducer are interfaced to a personal computer through LAN and RS232 interfaces, respectively. ✔ ❏ Diablo Analytical Inc. ✔ ❏ www.diabloanalytical.com ✔ ❏ www.transglobaldistributors.com Page 4
  • 5.
    Figure 1: Diagram of the two-stage gas interface system. Calibration of the pressure transducer is performed only at Table 1: RTGA Configuration and Conditions initial setup by capping off the process gas and the interface fore-line pump connections, followed by pumping down the Real Time Gas Analyzer interface and transducer with the 5975C vacuum system. Mass Spectrometer 5975C The zero is then set from the transducers controller/ display Pump Performance turbo front panel as per supplied instructions. Ionization mode Electron impact Mass range 1.6 - 800 u (0.1 µ steps) In operation, the process gas is pulled through the first stage Resolution 1 amu orifice under sonic flow conditions using the 12-liter/min Source temperature 230 °C pump. Using the 30-micron orifice, approximately 8 to Quad temperature 150 °C 15-mL/min flow is required to satisfy system demands. Typical scan range 1.6 to 50 amu Pressure at this point in the cross, which is dependent on gas Threshold 100 composition and process inlet pressure, can be monitored Samples (2^) 4 Typical using the capacitance monometer. A small amount of Tune (typical) Low mass or hydrogen tunes material, regulated by the size of the second stage orifice, 5975 ChemStation software G1701EA enters the mass spectrometer source under molecular flow conditions. This interface design as well as the design of the Gas Inlet System Diablo Analytical 5000A mass spectrometer allows quantitative work to be performed First stage orifice 30 Micron for a wide range of materials over wide dynamic ranges. Second stage orifice 50 Micron Fore pump Pfeiffer/Edwards 10 to 12 l/m Ions are selected, calibrated and monitored using custom Inlet temperature Ambient to 200 °C control software that is installed over the parent mass spec Pressure transducer MKS Capacitance monometer ChemStation software. Information is displayed in up to six Heater assembly Ambient to 200 °C display windows that support real time monitoring of the Temperature controller Integrated Watlow defined signals (usually an ion representative of a single or Process stream in pressure Atmospheric pressure to group of compounds). Data is also sent to a CSV file for later hundreds of PSI (depends on processing in Excel, for example. sampling orifice) Process stream in flow 30 mL/min minimum (or Calibration of the system can be performed using a much more or much less) dynamic blending system, or gas cylinder bland mixtures. Gas mixtures Gas standards can be diluted in various matrices such as Fuel cell mix 50% H2, 10 % CO2, 5% CH4 helium, nitrogen, and natural gas at the point of use and time Natural gas 70% CH4, 9% C2, 6% C3, 3% of use for the purpose of establishing calibration curves over iC4 the concentration range of interest. 3% nC4, 1% IC4, 1% nC4, Instrumental hardware details, operating conditions, and 1.5% CO2 software versions are given in Table 1. Other gases (as pure gases) H2, O2, N2, CO2, CO RTGA Software Operating system Windows XP SP3, Windows 7 x32 RTGA Control Diablo MS Sensor 3.0 ✔ ❏ Diablo Analytical Inc. ✔ ❏ www.diabloanalytical.com ✔ ❏ www.transglobaldistributors.com Page 5
  • 6.
    Results and Discussion InletSetup The gas interface was installed with 30 and 50 micron orifices For example, a simple pressure corrected hydrogen signal for stage 1 and stage 2, respectively. This combination is can be defined in the software as: (Sig1.Raw)/(Sig2.Raw)* suitable for concentration ranges from about 0.1% to 100% (P-nominal), where Sig1 is mass 2 for hydrogen, Sig2 is for most fuel cell gases such as H2, O2, and CO2. pressure and P-nominal is about 0.1 torr (typical) in the For trace analysis the stage orifice can be changed to 300 interface. or 350 micron. Also, if a smaller total flow from the process being monitored is desired, then the sampling orifice can be The MS Sensor software allows user defined formulas to be changed and or a direct, low volume, connection can be used applied to any defined instrument signal in real time for for sample introduction. custom calculations, signal ratios, normalization, background corrections, etc. This gives the user a great deal of flexibility in All material entering the mass spec interface must be in the customizing the method for a particular task. gas phase. In some cases, this may require the user to supply and add additional sample conditioning hardware upstream Tuning the Mass Spectrometer of the system (for example vaporizer). The pressure trans- ducer’s response is independent of gas type. However, the Several automated tuning procedures are available with flow rate through the orifices and hence pressure in the cross the RTGA system that make mass axis calibration and signal is dependent on gas type due to differences in viscosity. optimization easy and straightforward for the user. Three This is illustrated in Figure 2 where cross pressure is plotted tunes that are useful for fuel cell applications are listed for He and N2 at a series of process inlet pressures. below. The Atune is a general-purpose tune and a good place to start when the system is initially setup or after hardware maintenance. For best performance and linearity over a wide concentration range for all common gases (hydrogen to carbon dioxide through common sulfur compounds up to tetrahydothiophene), the custom tune (Htune) is recommended. To cover a higher mass range up to 250 amu, without optimized hydrogen response, the “low mass” or Ltune is provided. Once tuned, the 5975C will not require re-tuning for many weeks or months depending on the particular set of operating conditions. Figure 2: Effect of gas type and process pressure on cross pressure. Custom tunes can also be developed by the user to meet specific needs of the application. These are easily constructed Since response of the mass spec is dependent on source from within the 5975C software, by starting with parameters pressure, the transducer’s pressure measurement can be from one of the standard tune files. used to correct a given ion signal. Tune file Purpose This may be useful if the inlet process pressure is subject to Atune or Stune General mass spec tune fluctuation or when gas calibrations cover a very wide Ltune Optimized for mass ranges to approx. 250, viscosity range. The pressure reading is treated in the same not H2 way as defined chemical masses are in the software. Htune Optimized for hydrogen and other fuel A basic method consists of defined ions representative of or combustion gases unique masses for each compound to be monitored and the Custom Optimized for application (user developed) pressure reading if desired. ✔ ❏ Diablo Analytical Inc. ✔ ❏ www.diabloanalytical.com ✔ ❏ www.transglobaldistributors.com Page 6
  • 7.
    Ion Monitoring Figure 3is representative of the real time signal display that Trace level gases may also require longer purge times to is a core software feature. Here five signals were defined and stabilize. The 5000A RTGA interface is electro- polished high plotted in one window. Masses defined as separate signals quality stainless steel to minimize any passivation issues. were 2, 16, 27, 30, 43, and 44, for H2, CH4, C2 to C5’s, ethane, The design of the 5000A RTGA interface allows very fast C3 to C5’s, and CO2, respectively. Unique ions exist for sample response time on the second time scale for typical hydrogen, methane, ethane, and carbon dioxide, while for applications. C2—C5 a composite mass is required since a significant unique mass for each hydrocarbon is not available. This figure Signal Calibration is intended to illustrate a generic application with many of the compounds that might be found in a fuel cell reformer In nearly all cases linear calibrations can be constructed for feed or reformer output. Also, note the step change that the common fuel related gases over the concentration ran- occurs when hydrogen production startup occurs. The system ges that can be encountered during the R&D, prototype or is able to capture and record very rapid changes in a process pilot phases. The software is designed to make the calibra- that may be missed by other measurement techniques. tion process easy and straightforward. The user inputs for a given defined signal a series of responses and concentrations The monitoring of hydrocarbons, in addition to the common from calibration runs. The software then calculates the linear fuel related gases, can be useful to check conversion percen- equation to be used. An example is shown in Figure 5 for tages and to monitor the potential for carbon deposition in nitrogen in hydrogen calibration. Amounts and responses process systems, for example. were input for a three-point calibration into a popup window that is available under the edit signal menu. The linear equation is calculated and automatically applied to the N2 signal in this example. This process is repeated for each ion. Figure 4: System calibration screen. Nitrogen in hydrogen used as example. Figure 3: Graphical display of five signals: methane, C3-C5 hydrocarbons, C2-C5 hydrocarbons, carbon dioxide, ethane, and hydrogen. Scan range: 12 - 46 amu. Speed of Response Three variables are primarily responsible for limits on system response time: amount of time spent collecting signal at a given mass; number of masses in the method; distance and tubing size used to interface system to the process. For example, in a typical fuel related method monitoring five ions that are expected to be present in the percent level range, response to a perturbation will be registered by the Carbon Monoxide and Nitrogen RTGA on the seconds time scale. For trace level analysis at Both nitrogen and carbon monoxide have a mass of 28, ppm and ppb levels, longer response times may require for they cannot be differentiated using the RTGA under normal data collection at longer dwell times. operational modes. Carbon dioxide may also generate a small fragment ion at 28 amu. In most practical situations N2 or CO2, at some level is likely to be present, but the concentration level may not interfere for many applications. ✔ ❏ Diablo Analytical Inc. ✔ ❏ www.diabloanalytical.com ✔ ❏ www.transglobaldistributors.com Page 7
  • 8.
    Performance and Calibration: H2,CO2, O2, N2, CH4 The use and performance of any chemical measurement Calibration plots for CO2 over concentration ranges of system is enhanced if quantitative information is easy to 5% to 60% and 0.5% to 7% appear in Figures 7 and 8, obtain. In the study of fuel related systems, quantitative respectively. Finally, calibrations are shown respectively chemical analysis is required in addition to qualitative for oxygen, nitrogen and methane, in Figures 9, 10 and 11. trending. Calibration plots are shown in Figures 5 and 6, for H2 in nitrogen and helium, respectively. Both show good linearity over a wide concentration range indicating that simple two point calibrations could be performed as described above in the Calibration section. Correlation coefficients are better than 0.99. A more sensitive indication of hydrogen response can be seen in Figure 7 where Insert Graph Figure 7 response factors are plotted for dilution of a fuel cell mix (50% H2, 10% CO2, 5% CH4) in helium. Variation in response over the concentration range used is approximately ±10 %. Figure 7: Calibration of carbon dioxide (5 to 60%) in helium. Figure 5: Calibration of hydrogen in nitrogen diluent. Figure 8: Calibration of carbon dioxide (0.5 to 7%) in fuel cell mix. Figure 6: Calibration of hydrogen in helium diluent. Figure 9: Calibration of oxygen in helium. NITROGEN? ✔ ❏ Diablo Analytical Inc. ✔ ❏ www.diabloanalytical.com ✔ ❏ www.transglobaldistributors.com Page 8
  • 9.
    Figure 10: Calibrationof nitrogen in hydrogen. Figure 12: Calibration of dimethyl disulfide at the ppb level. Ion 94 monitored. Figure 13: Monitoring stepwise changes in low-level sulfur gases. Figure 11: Calibration of methane in fuel cell mix. These calibrations all show reasonably good linearity over the plotted concentration ranges, making it possible to calibrate a gas with just two data points. These points should be chosen so that the calibration range is representative of the expected concentrations whenever possible. All calibrations were performed with mass spec parameters from an automated tune using a scan range from 1.6 to 46 amu. Measurement of Low-level Impurities Monitoring and quantitation of low-level impurities, Figure 14: Monitoring stepwise changes in low-level sulfur including sulfur containing compounds is a significant area gases: Step 1: 1.0 ppm (mercaptans) to Step 5: 4.0ppm of study in fuel gases and related catalyst development. (mercaptans). For example, odorants present in natural gas feed to some fuel processors must be removed to levels well below 1ppm, using activated carbon beds in many cases, prior to steam reforming. Fig. 12 shows the calibration of dimethyl disulfide to demonstrate typical performance capability in the ppb range. Figures 13 & 14 show stepwise changes of low-level sulfur gases, illustrating the inertness of the RTGA interface. ✔ ❏ Diablo Analytical Inc. ✔ ❏ www.diabloanalytical.com ✔ ❏ www.transglobaldistributors.com Page 9
  • 10.
    Conclusions The main challengeto successful alternative fuel Acknowledgement & References commercialization is cost reduction. There is increasing 1. Fuel Cell Handbook, Fifth Edition, Business/Technology focus on fuel processor design and catalyst optimization. Books, Orinda, CA. With the level of development effort intensifying in all fuel 2. Fuel Cell Integration-A Study of the Impacts of Gas Quality cell and fuel processor technologies, any tools that can assist and Impurities, D.C. Dayton, M. Ratcliff, R. Bain, NREL, with this challenge are being used. Detailed, real time, and Golden, Colorado, 2001. quantitative chemical analysis can be powerful tools when 3. Fuel Cell Systems Explained, J. Larminie, A. Dicks, applied to alternative fuel development and optimization. John Wiley & Sons, LTD, England, 2002. This applies to the incoming fuels, processed fuels, reformer 4. R. Firor and B. Quimby, “Automated Dynamic Blending output, partial oxidation system gases, and fuel cell stack System for the Agilent 6890 Gas Chromatograph: electrochemical reaction gases. Low Level Sulfur Detection” Agilent Application Note, , publication 5988-2465EN, April 2001. The Diablo 5000A RTGA provides a stable, reliable, and 5. M. Feeney, P. Larson, B. Wilson, “Analysis of Fuel Cell quantitative solution to continuous chemical monitoring Reformer Gases in Seconds Using the Agilent 3000 Micro in fuel processing systems that is not possible with residual Gas Chromatograph” Agilent Application Note, publication , gas analyzers. Good linearity is seen for hydrogen and other 5988-5296EN, February 2002. gases that are encountered in fuel cell systems over a wide 6. R. Firor, M. Klee, “Chemical Analysis in Fuel Cell Systems” , concentration range from ppb to percent levels, making Agilent Application Note, publication, February 2002. calibration of the system straightforward. With a response time of 1 to 5 seconds, the system can monitor and capture rapid transients that can be missed by other monitoring equipment. Please contact us at: Diablo Analytical, Inc. TransGlobal Distributors B.V. 5141 Lone Tree Way Cairostraat 10 Antioch, CA 94531 3047 BC Rotterdam T: (925) 755-1005 The Netherlands F: (925) 755-1007 T: +31-10-258 1870 E: info@diabloanalytical.com F: +31-10-258 1879 E: info@transglobaldistributors.com I: www.transglobaldistributors.com