Downloaded 510 times


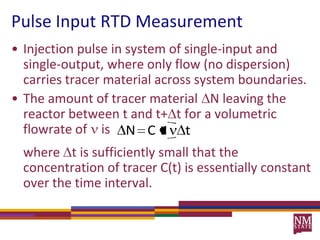
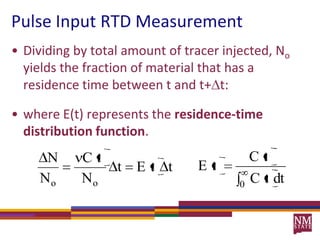
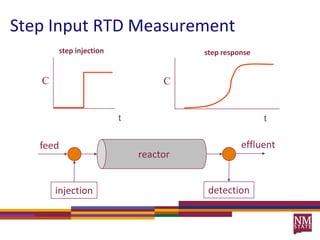
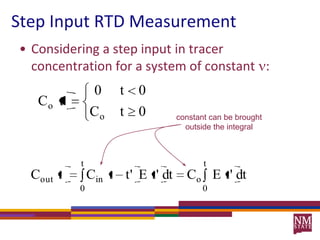
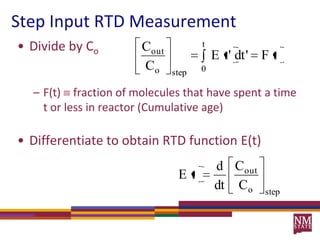
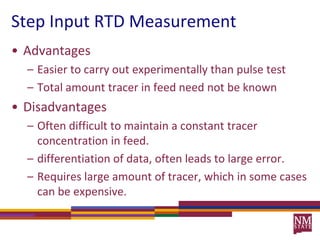
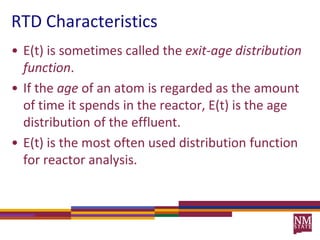
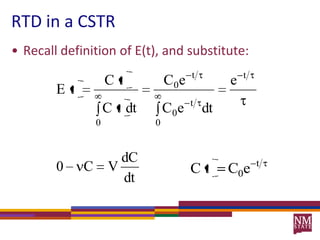

1) Residence time distributions (RTDs) are used to model imperfect mixing in chemical reactors and account for variations in flow patterns and residence times. 2) RTDs can be measured experimentally using inert tracers injected as pulses or steps and monitoring the effluent concentration over time. 3) The RTD function, E(t), represents the age distribution of molecules in the effluent and provides insights into the reactor's mixing behavior beyond the assumption of ideal reactors.


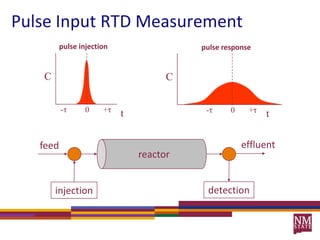
![5G Explained! A High Level Overview [Introduction]](https://cdn.slidesharecdn.com/ss_thumbnails/5gexplainedahighleveloverview-260119165306-cc137a3e-thumbnail.jpg?width=640&height=640&fit=bounds)


