Download to read offline


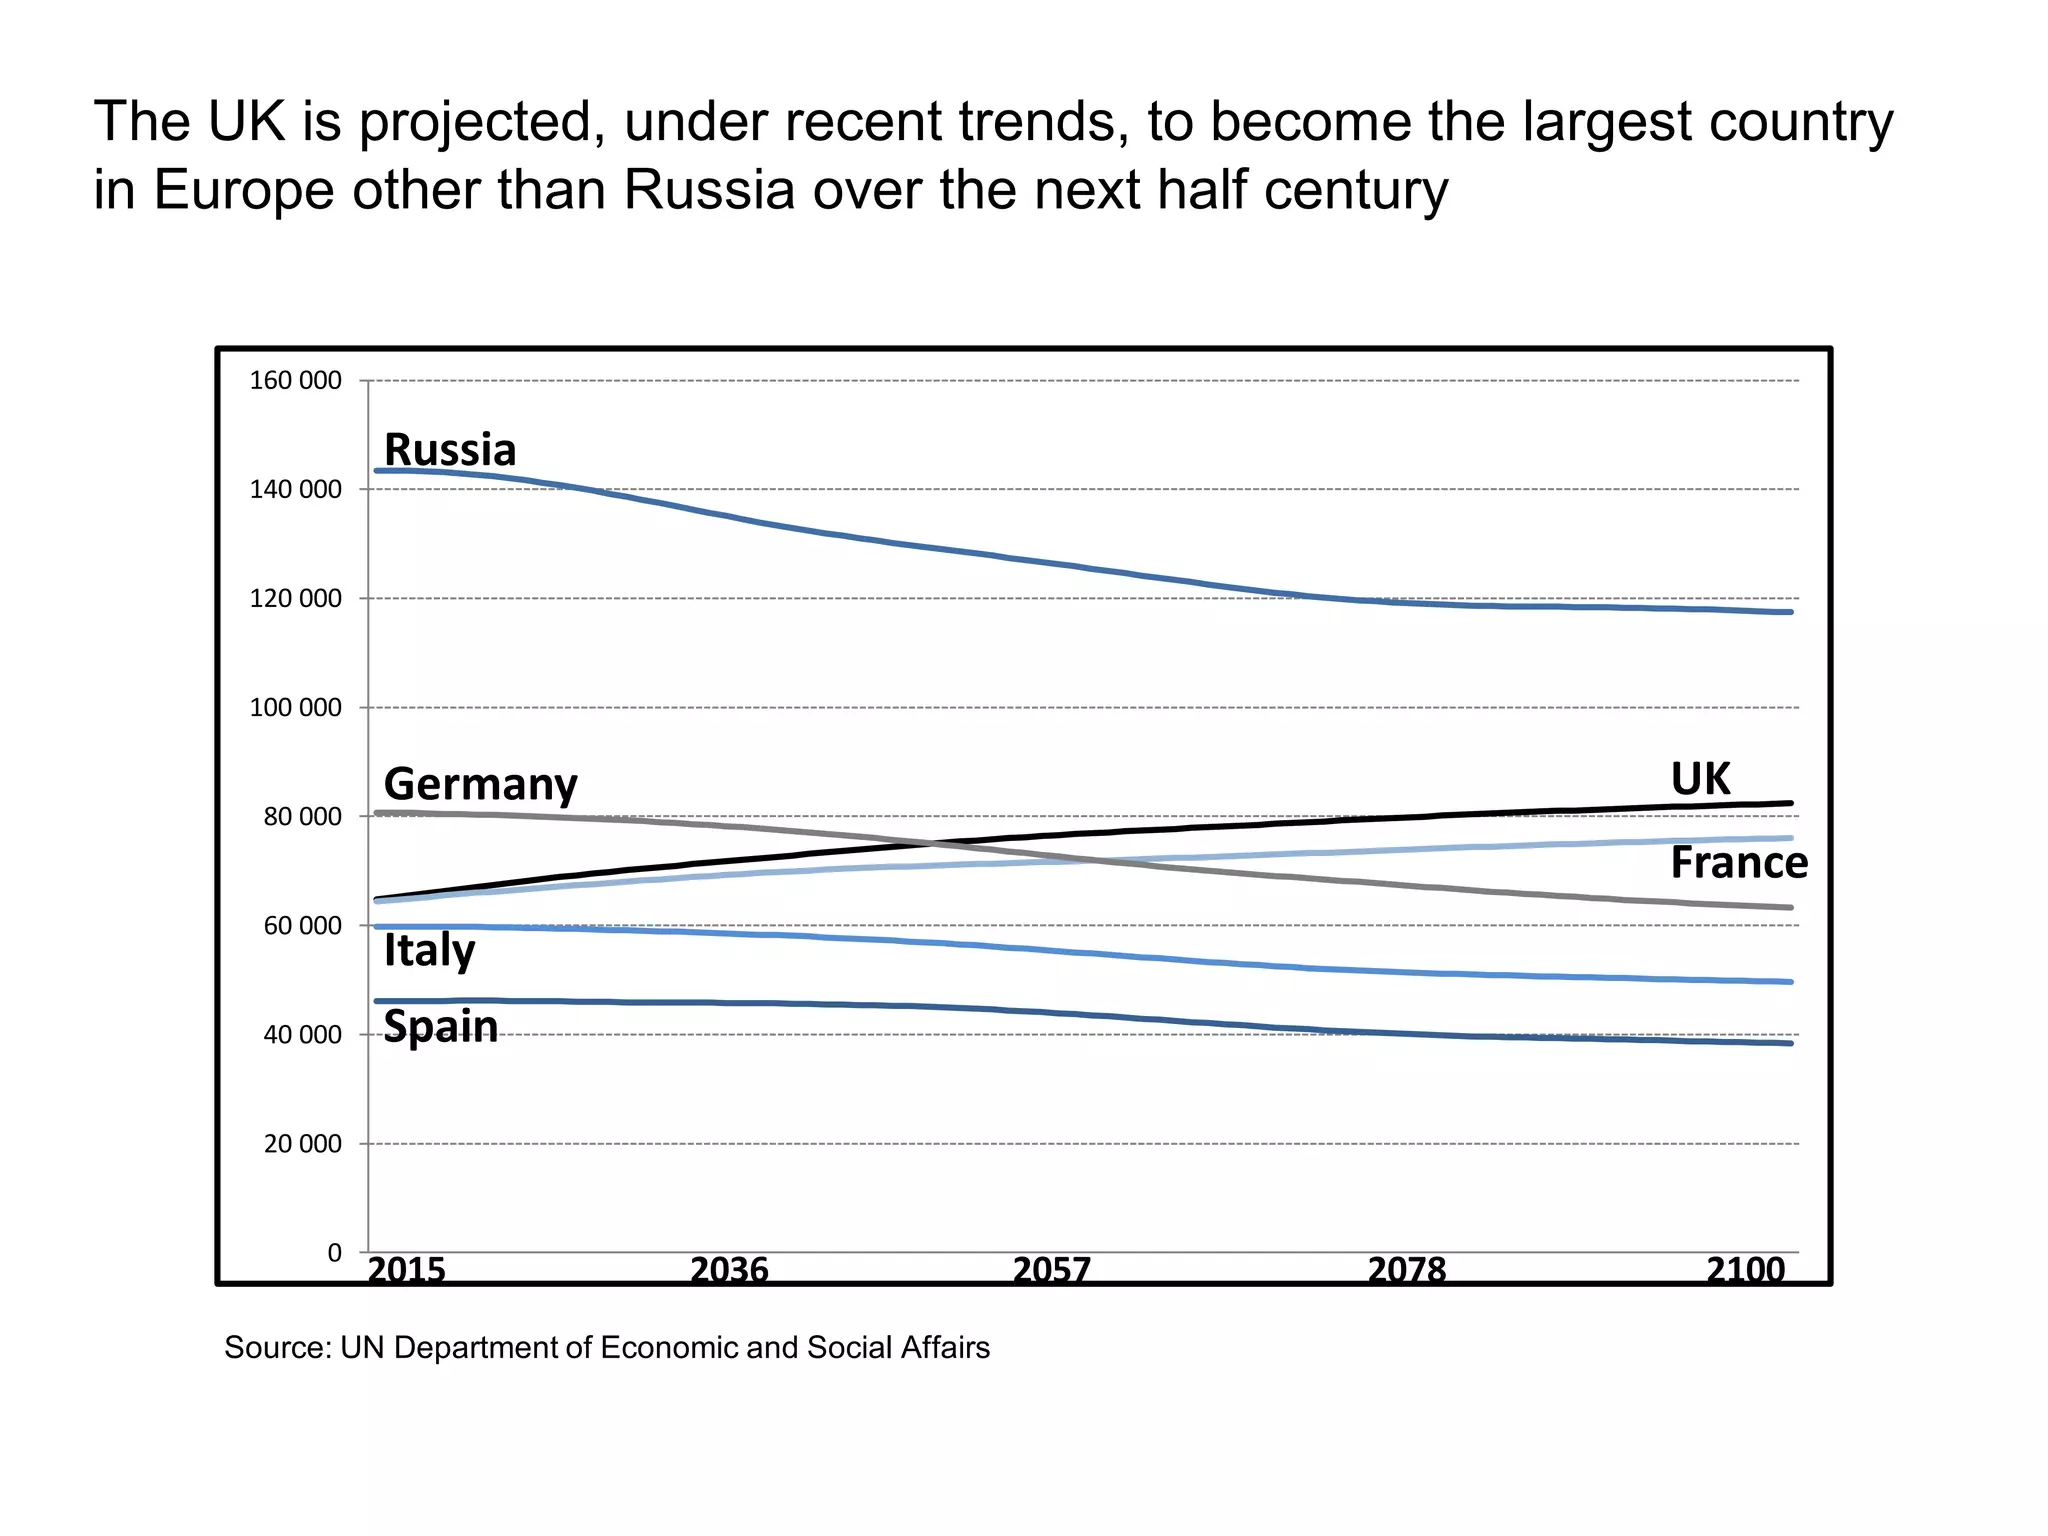


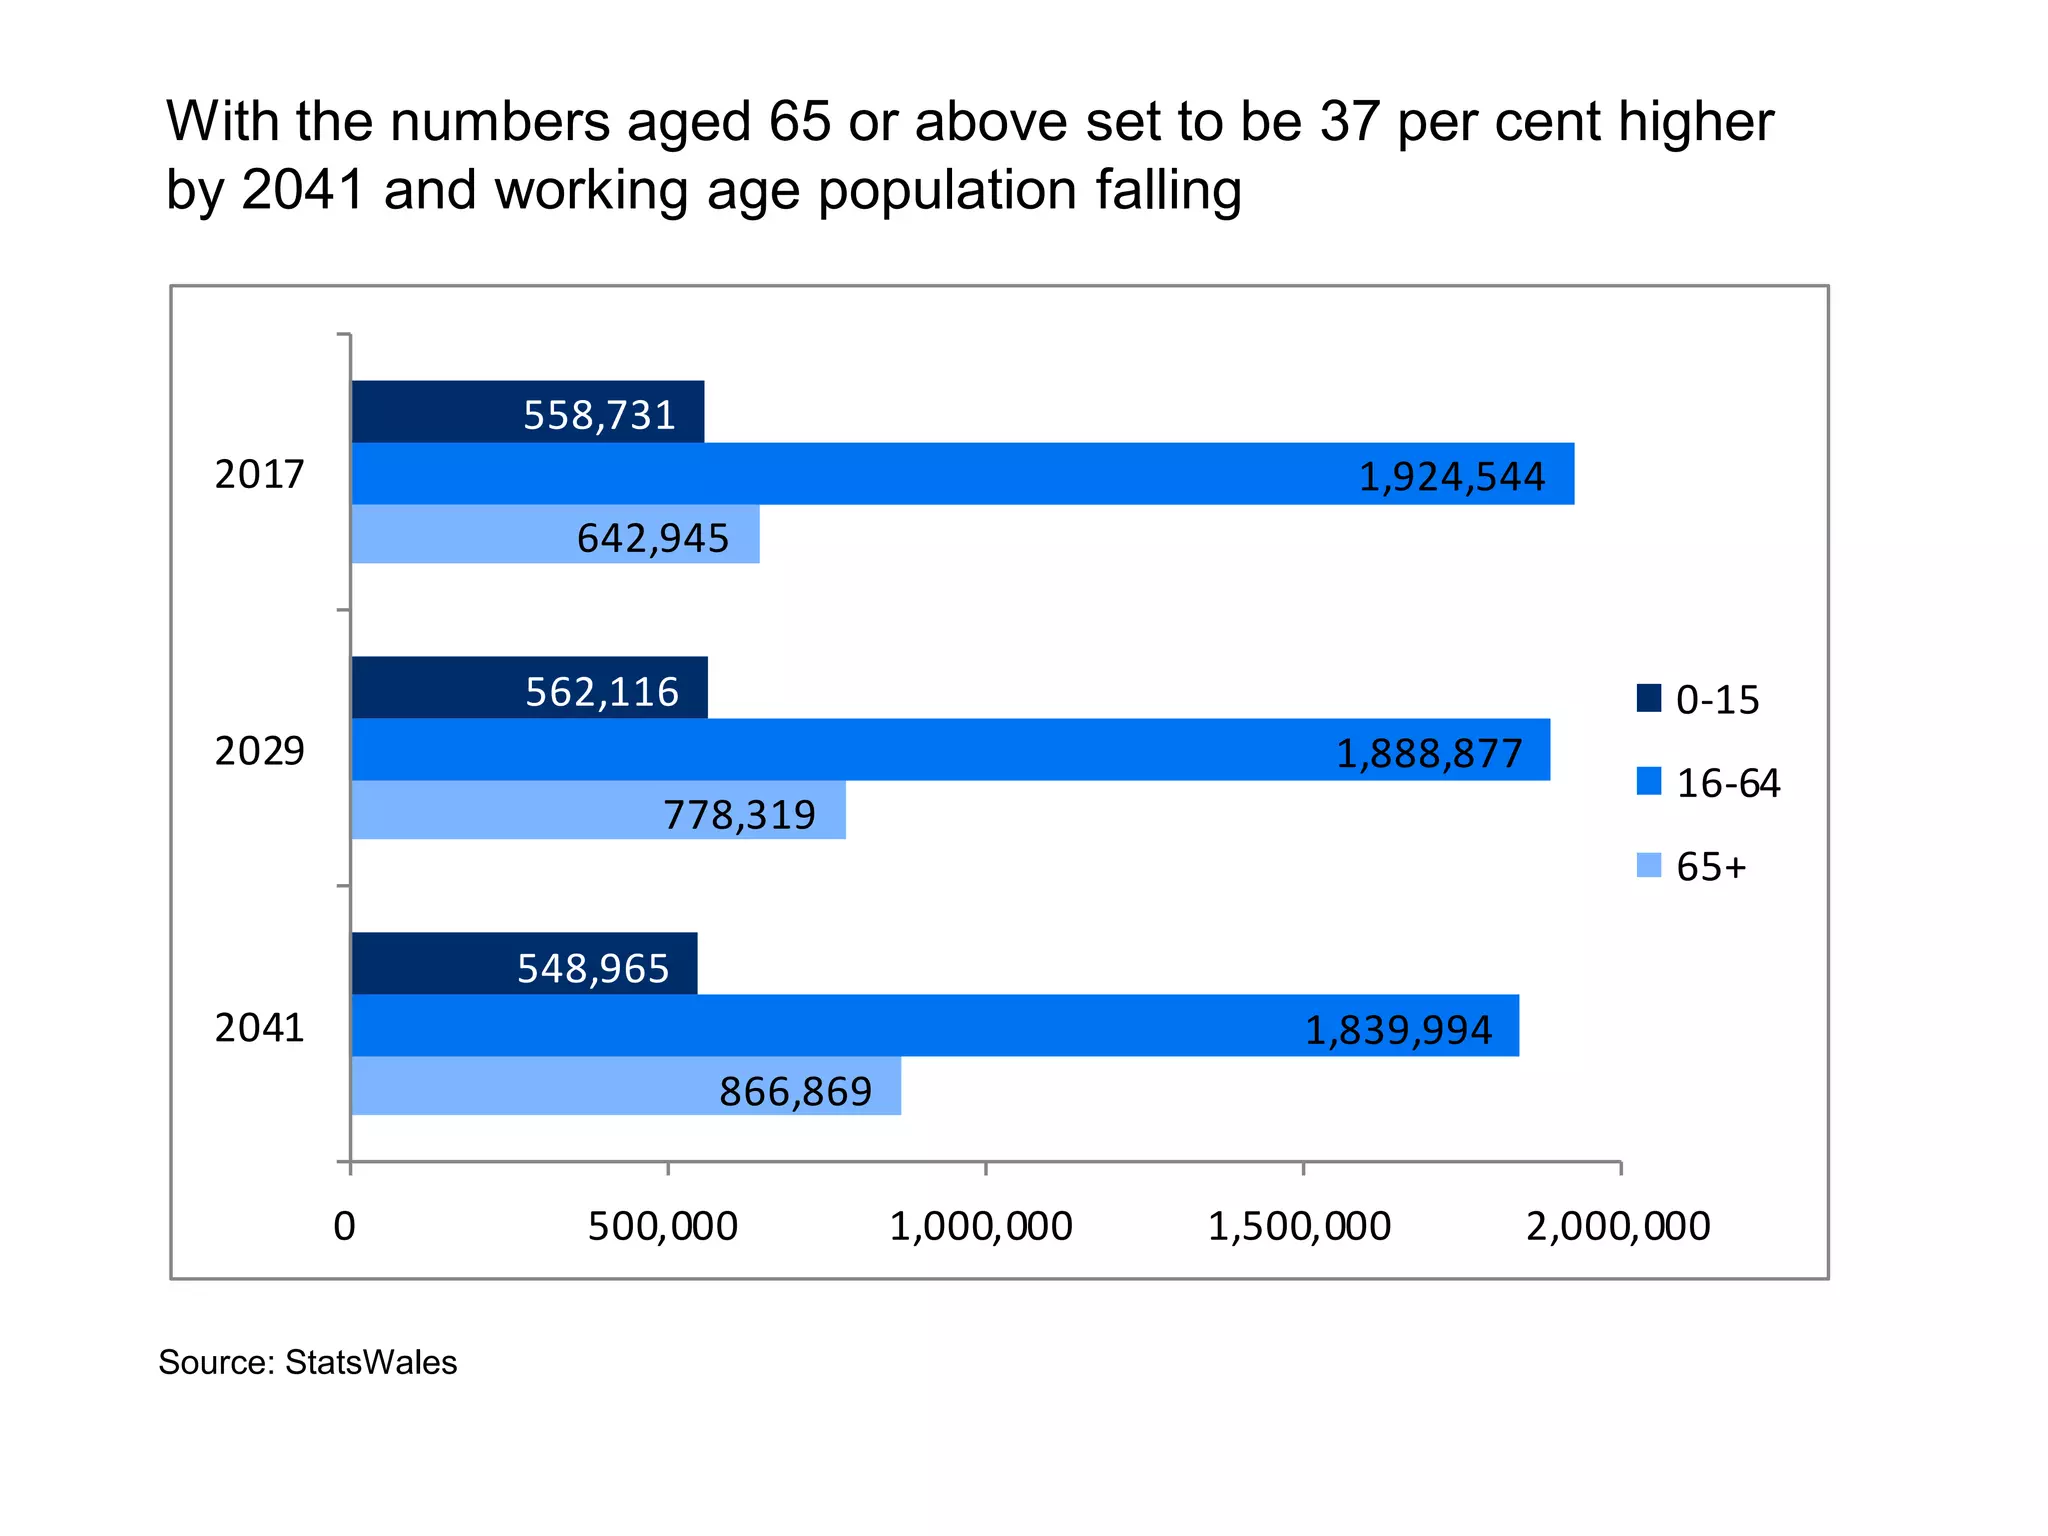

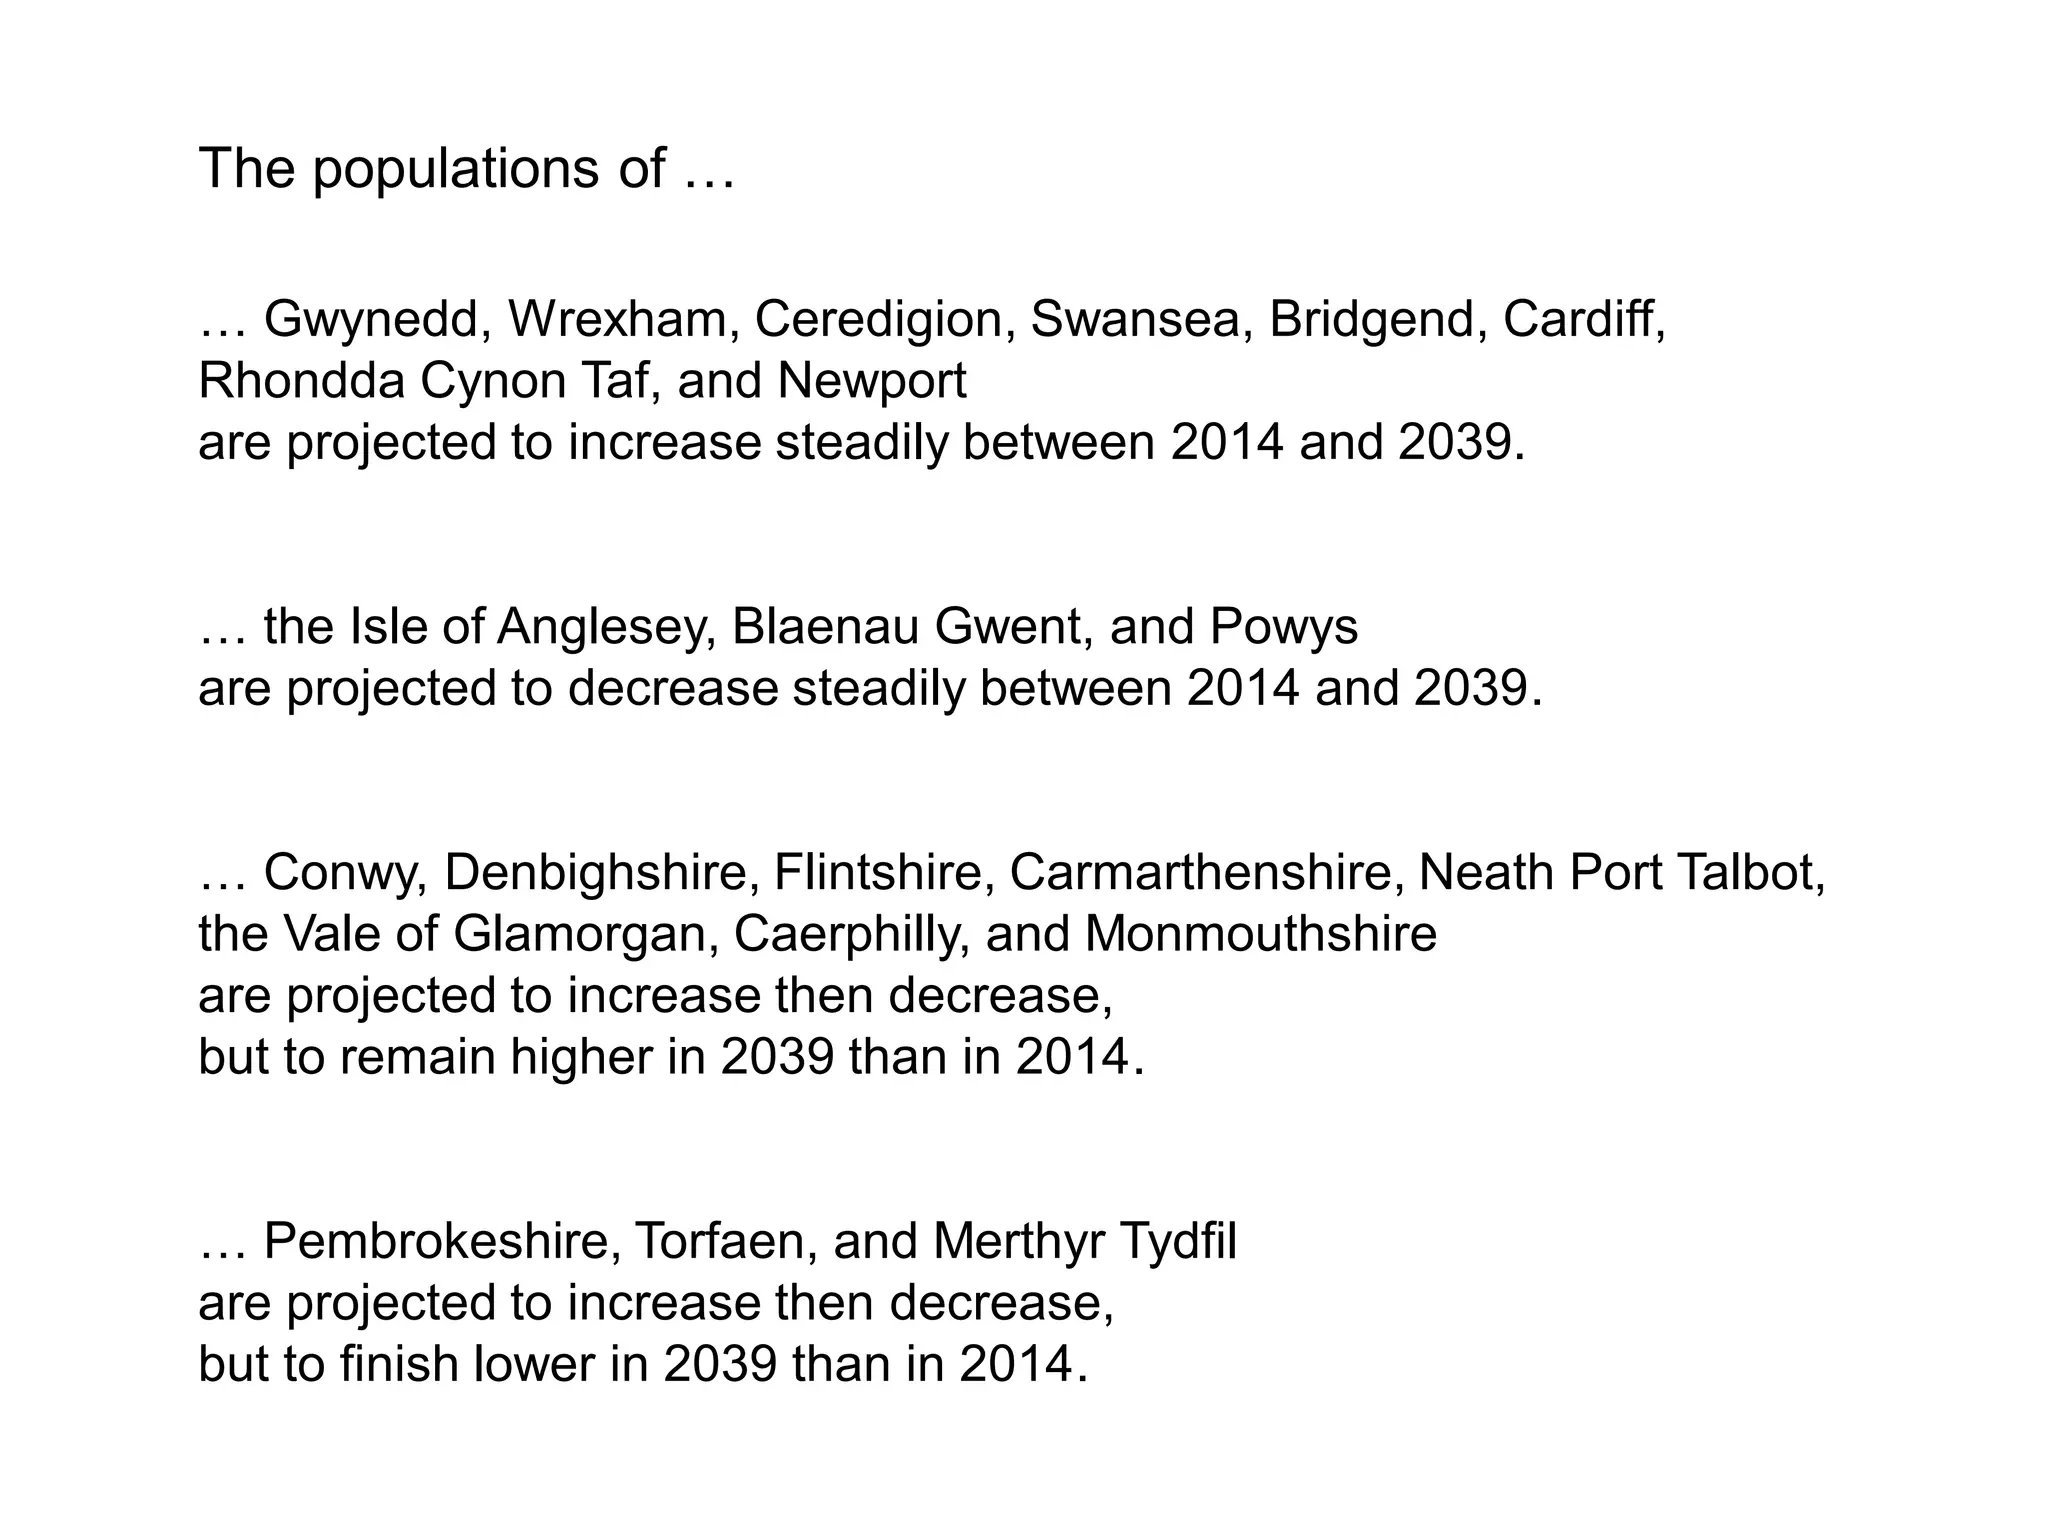


The Welsh Government's Future Trends Report 2017 outlines projected population changes, indicating an overall increase in Wales' population by about 4% over the next 20 years, driven mainly by growth among those aged 65 and above. Migration is expected to be the primary factor for population growth, with international migration contributing significantly more than natural change. The report also highlights uneven population distribution across Wales, with some areas projected to decline while others grow substantially.


