Downloaded 13 times


![fufru xMdjh
NITIN GADKARI
India, unfortunately ranks at the top with highest number of fatalities with about 11% share in the world.
The “Road accidents in India 2018" is an effort of the Ministry to highlight the state-wise data and causes
of the accidents and fatalities. The data would help the policy makers to put in place focused initiatives to
addressthemenaceofrisingroadaccidentsandresultantfatalities.
The data collected from all the States and UnionTerritories has been compiled in the Publication.The total
number of accident related deaths in 2018 stood at 1,51,417 indicate an increase of 2.3% over the figures
for 2017. About 85% of the accident related deaths happen in the most productive age group of 18-60.
Road accidents deaths not only cause severe trauma to the family of the victim but they also result in huge
economic loss to the Nation. We remain deeply committed to reducing road accidents in the country and
havebeentakingseveralmeasurestoreducethesame.
Our interventions on Road Safety include Engineering interventions like ihe identification of Black Spots
on Roads and rectification of the same, working with the automobile Industry for putting in place safety
provisions like seat belt reminder, air bags, speed alerts, reverse cameras, anti-lock braking systems, a
strongadvocacypolicyetc.
The most important initiative taken by us this year in respect of Road Safety has been the enactment of the
Motor Vehicle Amendment Act 2019 which, inter-alia, provides for a stiff hike in penalties for traffic
violations. The other provisions of theAct include setting up of a National Road Safety Board, protection
of “Good Samaritan", cashless treatment during golden hour. provision of third party Insurance,
constitution of a Motor Vehicle fund with increased compensation for hit and run. automated fitness
testingforvehicles,introductionoftheprovisionforrecallofvehiclesetc.
The Ministry is also working to improve the quality of accident data collection with use of IT based
systems which would also help in getting the real-time causative analysis of the road accidents. We also
expect to avoid the delays in bringing the Publication in the coming years with the ITbased data collection.
IcongratulatetheTRWTeamfortheirefforts.
With the better enforcement as well as better compliance of regulations by all the stake holders, I am sure,
wewillbeabletosignificantlyreducetheroadaccidentfatalitiesincomingyears.
Room No. 501, Transport Bhawan, 1, Sansad Marg, New Delhi - 110 001, Tel.: (RTH) 011-23710121 23711252 (O), 23719023 (F),
Room No 168 Udyog Bhawan, Rafi Marg New Delhi - 110 011, Tel.: (MSME) 011-2306156, 23061739 (O), 23063141 (F),
E-mail: nitin.gadkari@nic.in; website-www.morth.nic.in / https://msme gov.in
MESSAGE
Minister
Road Transport and Highways;
Micro, Small and Medium Enterprises
Government of India
ea=h
lM+d ifjogu ,oa jktekxZ;
lw{e] y?kq ,oa e/;e m|e
Hkkjr ljdkj
th
25 September, 2019](https://image.slidesharecdn.com/roadaccidedntsinindia-191119063702/75/Road-Accidents-in-India-2018-Report-3-2048.jpg)
![jkT; ea=h
lM+d ifjogu ,oa jktekxZ ea=ky;
Hkkjr ljdkj] ubZ fnYyh
Minister of State for
Road Transport & Highways
Government of India, New Delhi
tujy (Mk-) fot; dqekj flag
ihoh,l,e] ,oh,l,e] okbZ,l,e (ls-fu-)
GEN.(Dr) VIJAY KUMAR SINGH
PVSM, AVSM, YSM (Retd)
Road traffic continues to be a major developmental issue, a public health concern and is a leading cause of
death and injury across the world, killing more than 1.35 million globally as reported in the Global Status
report on Road Safety 2018 with 90% of these casualties taking place in the developing countries and 11%
alonebeingaccountedbyIndia.
As per the Report on Road accidents in India 2018, the accident related deaths in India in 2018 were
1,51,417. It is indeed a matter of great concern that despite the continuing efforts of the Government in this
regard and our commitments for halving deaths by 2020 in the Brasilia Declaration, we have not been able
toregisteranymarkedprogressonthisfront.
Ministry of Road Transport and Highways has been taking multiple initiatives including those related to
vehicular and road engineering as well as educational measures for raising awareness in the field of Road
Safety . The year 2019 has seen the culmination of our efforts in the field of Road safety through the
enactment of the Motor VehicleAmendmentAct 2019, which among other things, provides for a stiff hike
in penalties for traffic violations with the aim of bringing in discipline and a responsible attitude amongst
roadusers.
I believe that the countrywide implementation of the above act, in its true spirit , will mark the turning
pointinroadrelateddeathsinthecountry.
MESSAGE
Transport Bhawan, 1, Sansad Marg, New Delhi - 110 001
Office Tel.: +91-11-2331522, 23715159 Fax : +91-11-23718568, website-www.morth.nic.in](https://image.slidesharecdn.com/roadaccidedntsinindia-191119063702/75/Road-Accidents-in-India-2018-Report-4-2048.jpg)
![lM+d ifjogu vkSj jktekxZ ea=ky;
Ministry of Road Transport & Highways
Hkkjr ljdkj @ Government of India
MkΠlatho jatu] vkbZ-,-,l-
lfpo
Dr. SANJEEV RANJAN, I.A.S.
Secretary
Road accidents continue to be a leading cause of death, disabilities and hospitalization in the country despite
our commitment and efforts. The report also brings out that while accidents, deaths and injuries registered a
steep rise till 2010, they somewhat stabilised after that, with only marginal year to year fluctuations. Further,
the CAGR of accidents as well as accident related deaths in the period 2010-2018 dropped drastically and
was the least when compared with the previous decades, despite the very high rate of growth of automobiles.
(Chart1.1&1.2intheReport).
Road traffic accidents are amenable to remedial actions and the Ministry has been implementing a multi
pronged road safety strategy based on Education, Engineering (both of roads and vehicles), Enforcement
and Emergency Care as detailed in Chapter 8 of the Report, consisting inter-alia of setting up driver training
schools, creating awareness, strengthening automobile safety standards ,improving road infrastructure,
carrying out road safety audit etc. These efforts of the Ministry are manifest in the decline in the CAGR of
accidentsandaccidentrelateddeathsduringtheperiod2010-18.
The year 2019 witnessed a consolidation of the Ministry's efforts in the field of Road Safety as the Motor
vehicle Amendment Bill 2019, amending the Motor Vehicle Act 1988, was eventually passed by both
houses of Parliament in August 2019. The Motor Vehicle Amendment Act 2019 since enacted, focuses on
road safety and includes, inter-alia, stiff hike in penalties for traffic violations and electronic monitoring of
the same, enhanced penalties for juvenile driving, cashless treatment during the golden hour,
computerisation/automation of vehicle fitness and driving tests, recall of defective vehicles, extending the
scope of third party liability and payment of increased compensation for hit and run cases etc. The detailed
provisionsoftheActhavebeensummarizedinSection9oftheReport.
It is hoped that the data on different facets of road accidents and analysis contained in this Report will be
usefulinpolicyformulationbyStates/UTsaswellasforotherstakeholders.
FOREWORD
Room No. 509, Transport Bhawan, 1 Parliament Street, New Delhi-110 001, India Tel.: 91-11-23714104, Fax : 91-11-23356669
E-mail: sranjan@nic.in Web : http://www.morth.nic.in
th
Dated: 26 September, 2019](https://image.slidesharecdn.com/roadaccidedntsinindia-191119063702/75/Road-Accidents-in-India-2018-Report-5-2048.jpg)
![PREFACE
As you are aware, the Transport Research Wing of the Ministry of Road Transport and Highways
publishes an annual report of accidents, related deaths and injuries, calendar year- wise, based on
information supplied by the Police Departments of States and UTs in a set of standardized formats
approvedbytheCommitteeonRoadSafety.
The present volume of 'Road accidents in India 2018' provides information on various aspects of
road accidents in the year 2018. It has nine sections giving an overview, profile of road accidents ,
causes of road accidents; inter-state comparisons; share of millions plus cities; spatial and inter-
temporal distribution; international comparisons; road safety initiatives taken by the Government
ofIndiaandabriefwriteuponMotorVehicleAmendmentBill2019etc.AsummaryoftheReportis
availableunderthesectiontitledExecutiveSummary.
It is our constant endeavor to enrich this document which is the only official source of accidents,
related deaths and injuries in the country. We have been especially enriched with our interactions
with the Supreme Court Committee on Road Safety and have made substantial revisions in this
edition of the document and have tried to make the same more analytical and rigorous for the use of
theCommittee.
I remain extremely grateful to the Police Departments of all States/U.Ts for providing us the data as
per set formats. However, there is a need to reduce the timelag in bringing out this document and it is
with this end in view that TRW is in the process of developing a software at the national level to
enable integrating the accident related data collected by the States/UT with the Centre through
electronic transfer as against manual transfer done at present. This would enable instant uploading
of this information by the States and its analysis at the Central Level.We hope to share this software
shortlywiththestates.
We have also requested States for information in respect of Black Spots for the years 2015 to 2018.
This information remains extremely important for the Ministry for prioritizing their rectification
efforts and should ideally be a part of this document. However, for the lack of response from some
States,theinclusionofasectiononBlackSpotsisbeingpostponedtothenextdocument.
Lastly, I wish to record my deep appreciation for the support and cooperation provided by all my
colleaguesinTRWwhohaveworkedtirelesslyinimprovingandcompletingthisdocument.
New Delhi, September, 2019
(Babni Lal)
BABNI LAL
Economic Adviser (TRW)
Tel.: (O) 011-23384160
E-mail : babnilal@nic.in
Government of India
Ministry of Road Transport & Highways
(Transport Research Wing)
I.D.A., Building, Jamnagar, House,
ifjogu vuqla/kku foHkkx
Hkkjr ljdkj
lM+d ifjogu ,oa jktekxZ ea=ky;
vkbZ-Mh-,- fcfYMax] tkeuxj gkÅl
'kkgtgk¡ jksM] ubZ fnYyh & 110 011
Shahjahan Road, New Delhi-110 011](https://image.slidesharecdn.com/roadaccidedntsinindia-191119063702/75/Road-Accidents-in-India-2018-Report-6-2048.jpg)


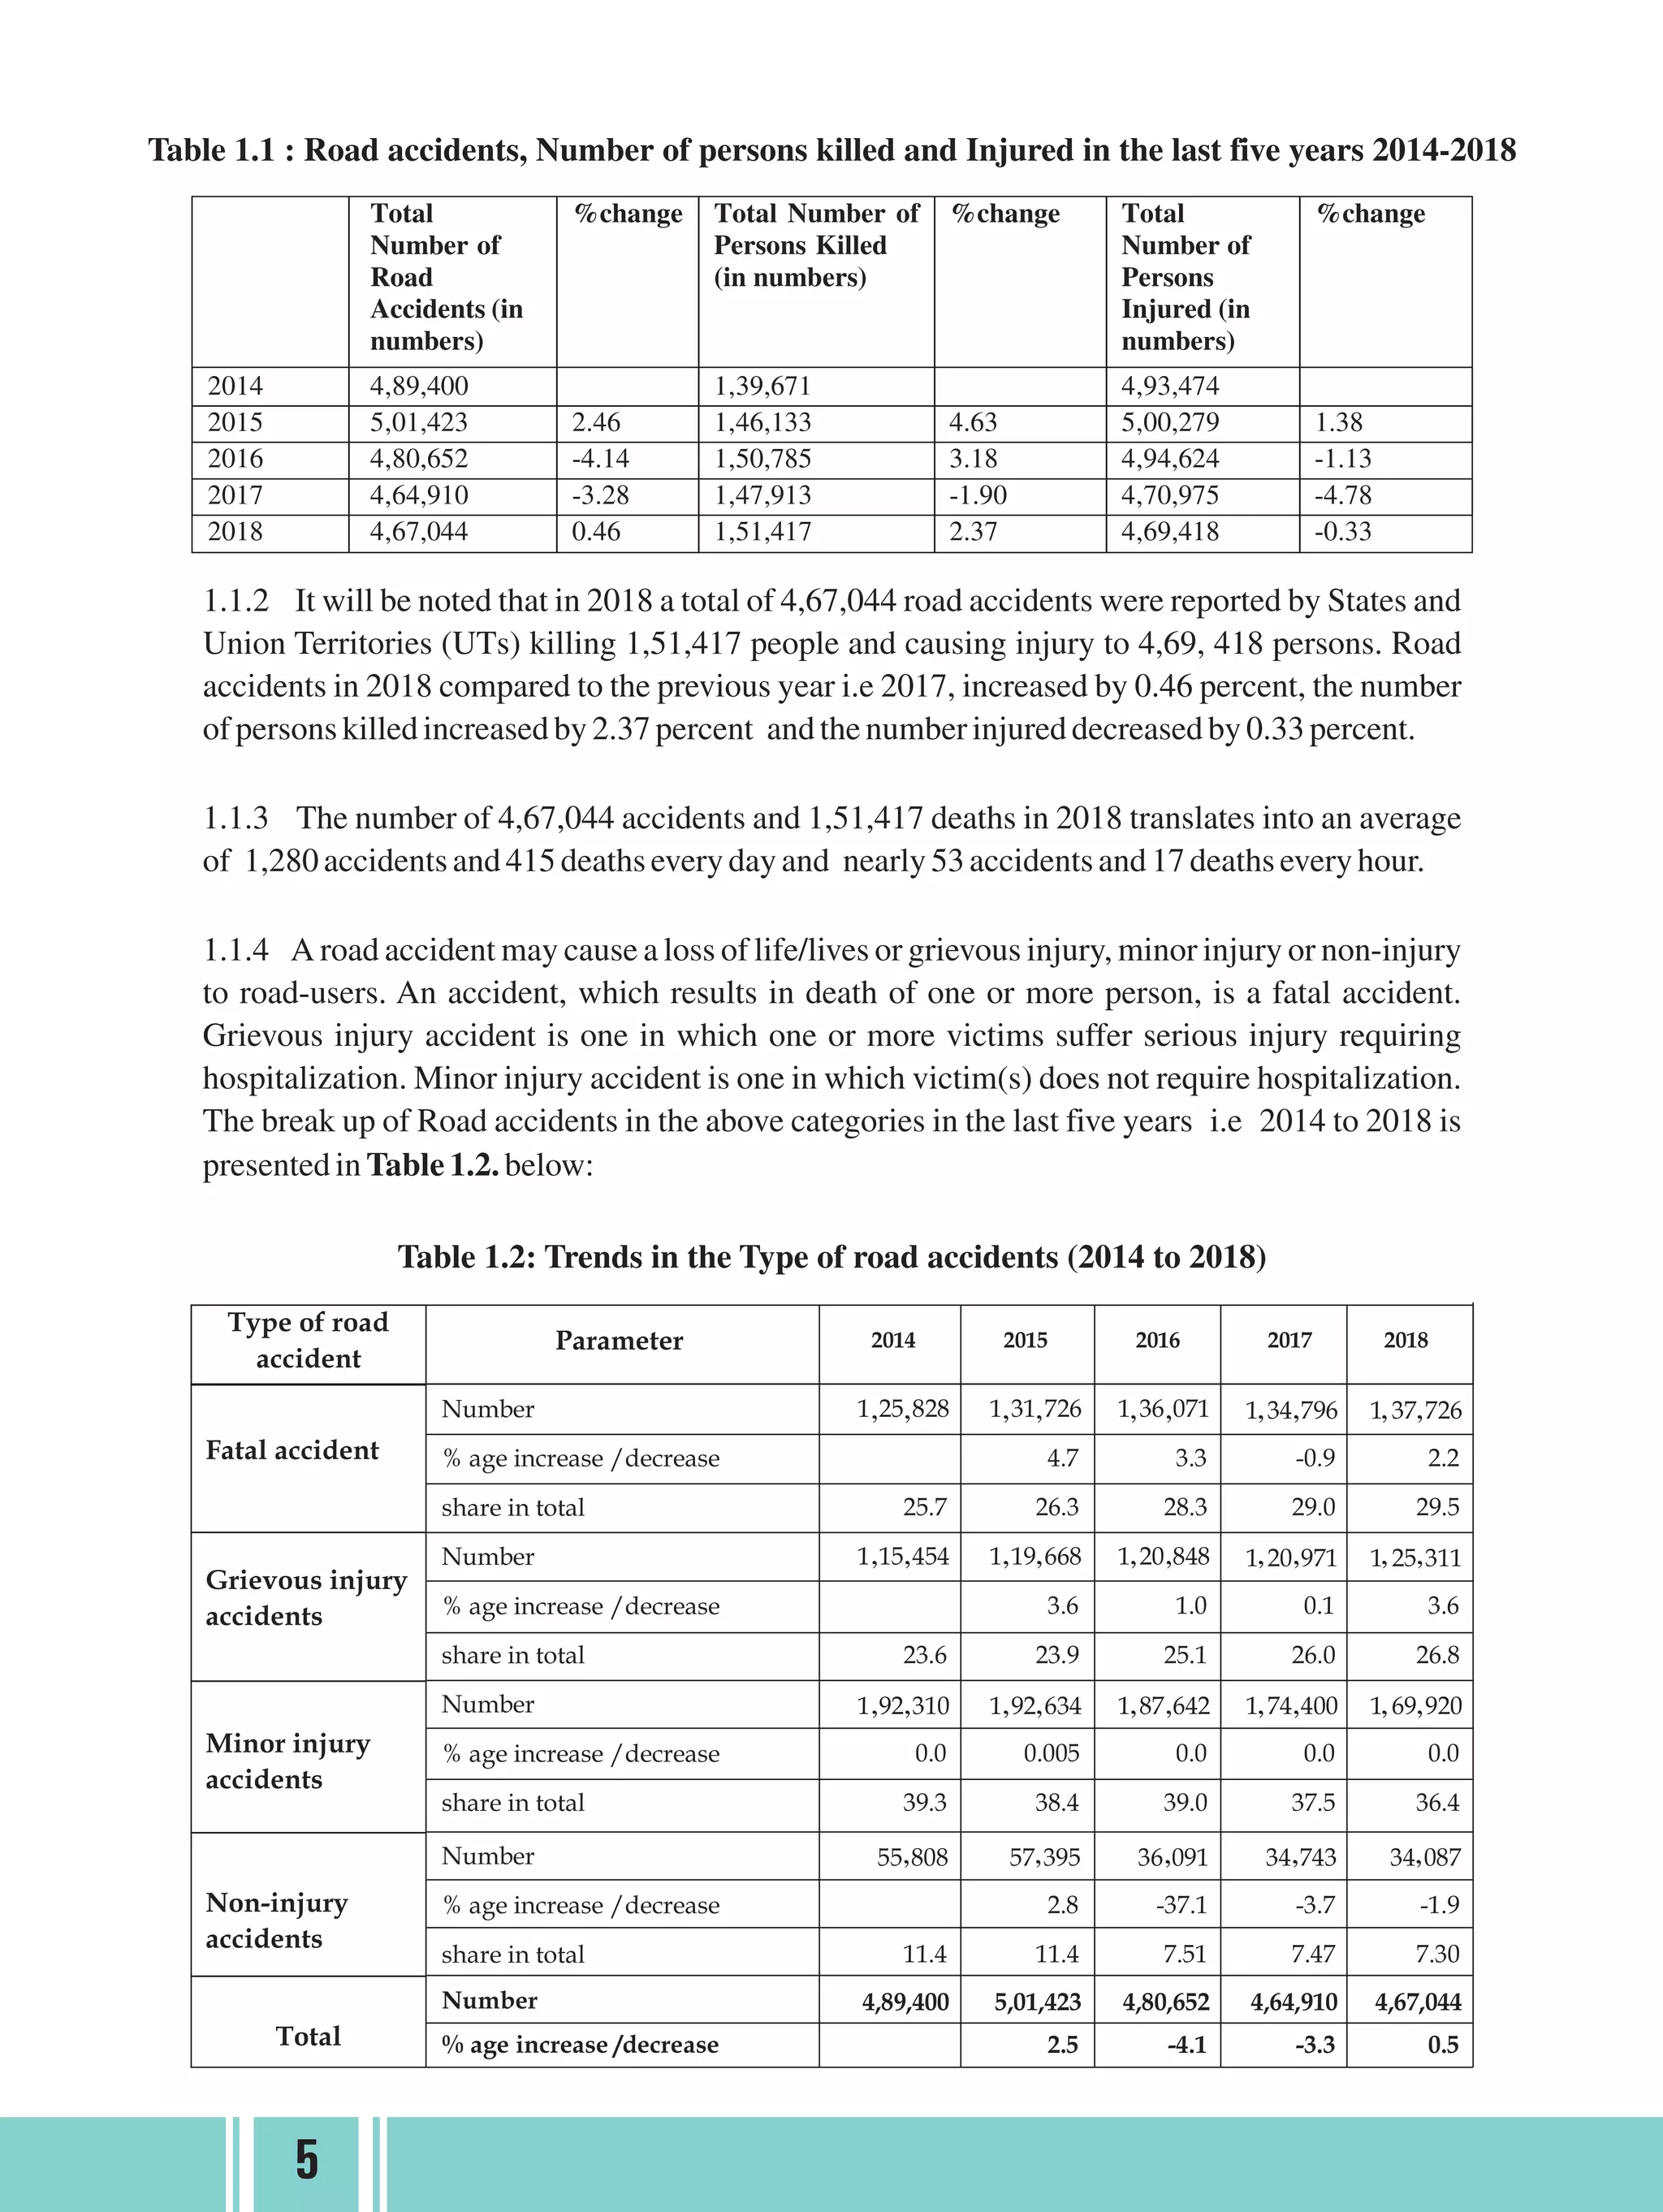


Road accidents continue to be a major public health issue in India, with over 1.5 lakh deaths reported in 2018 alone. The report analyzes state-wise accident data and finds that most deaths occur among productive aged groups. It highlights initiatives taken by the government to address road safety like identifying and rectifying black spots, strengthening vehicle safety standards, and enacting the Motor Vehicles Amendment Act of 2019 with stricter penalties. While efforts have stabilized accident rates after 2010, the high number of deaths remains a concern. The government is working to improve data collection systems and hopes that better enforcement of laws will help reduce fatalities in the coming years.


