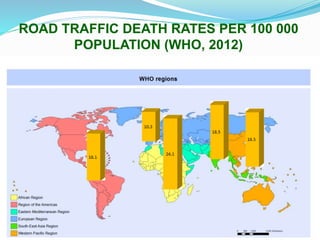
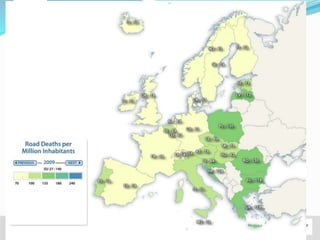
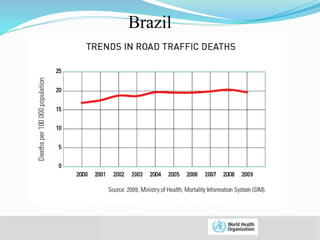
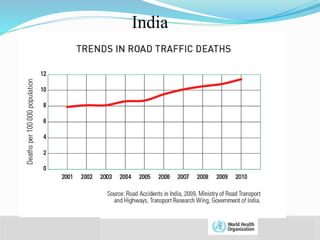
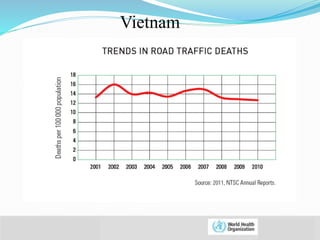
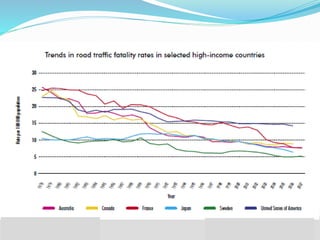
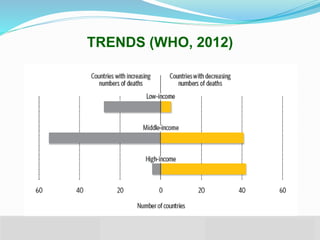
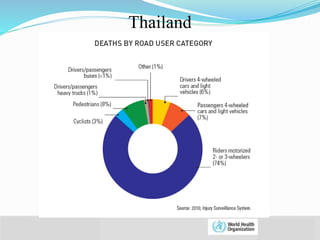
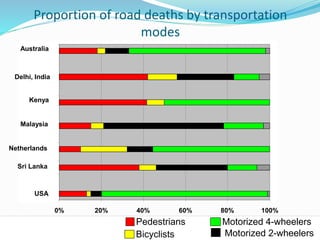
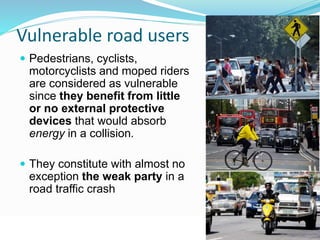
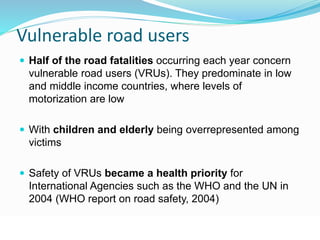
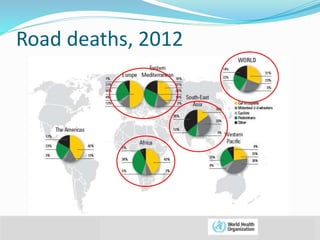
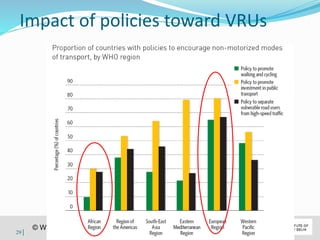
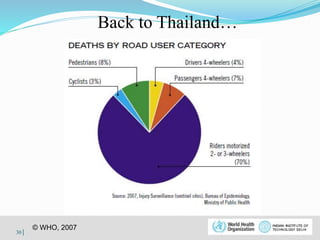
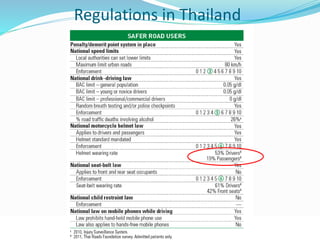
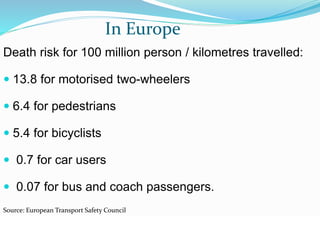
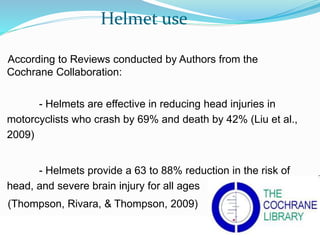
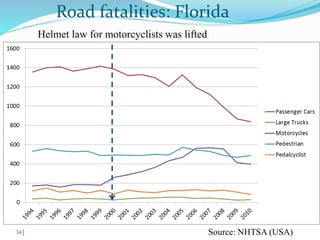
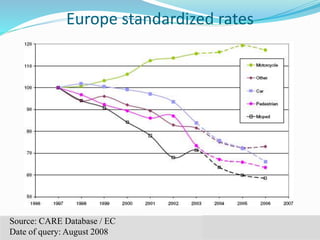
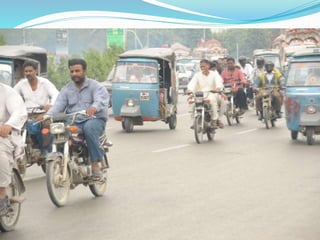
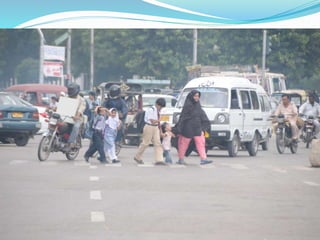
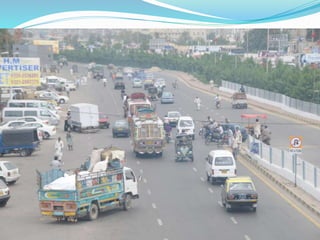
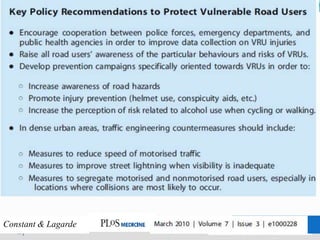
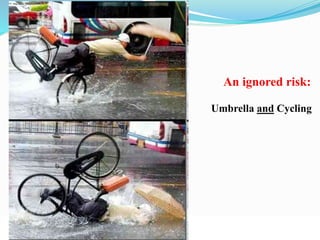
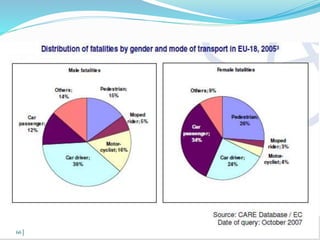
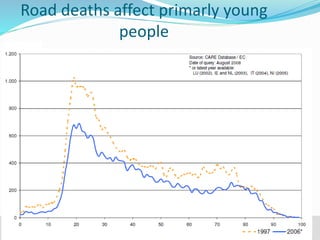
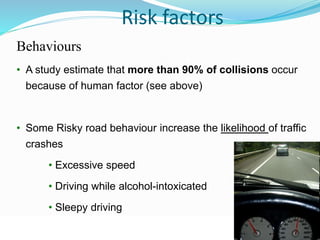
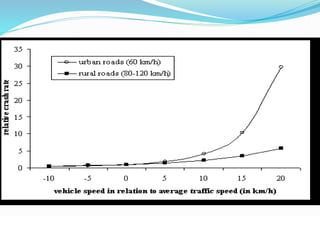
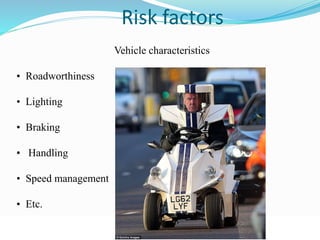
Improving Road safety: 
From public health to psychology 
© WHO, 2007 
Aymery Constant, PhD 
Maître de conférence / Lecturer 
EHESP / French School of Public Health 
1│
© WHO, 2007 
2│ 
Mobility 
• Every person has to move during lifetime 
• Going to school, work, shopping, travel... 
• Different transportation modes: motorized and 
non motorized 
But this is not a safe activity
© WHO, 2007 
Road mortality and injuries: 
A major public health issue 
3│
© WHO, 2007 
Road traffic crashes 
• 1.2 million deaths a year (road mortality) 
• 20-50 million injuries/disabilities (road 
injuries) 
• 11th leading cause of death 
• Account for 2.1% of all deaths globally
Global status report on road safety 2013 
© WHO, 2007
Drowning 
7.3% 
© WHO, 2007 
6│ 
Distribution of global injury mortality by cause 
Suicide 
16.9% 
Violence 
10.8% 
War 
3.4% 
Poisoning 
6.7% 
Falls 
7.5% 
Fires 
6.2% 
Road traffic injuries 
22.8% 
Other intentional injuries 
0.2% 
Other unintentional injuries 
18.1% Road traffic injuries 
account for 23% of 
all fatal injuries 
worldwide 
Source: WHO Global Burden of Disease project, 2002, Version 1
Indicators of road traffic safety 
© WHO, 2007 
7│
Absolutes Figures 
• Number of injuries indicating the number of people injured in 
© WHO, 2007 
8│ 
road traffic crashes 
Not very useful for making 
comparisons. A large proportion of 
slight injuries are not reported 
• Number of deaths indicating the number of people who die as 
a result of a road traffic crash 
Gives a partial estimate of the magnitude of 
the road traffic injury problem, in terms of 
death
• Fatalities per 10 000 
vehicles 
© WHO, 2007 
9│ 
showing ratio of fatalities to number of motor 
vehicles. Shows probability of vehicle involvement 
in fatal crashes 
It omits non-motorized transport and 
declines with motorization 
Relative figures 
• Fatalities per 100 000 
pop 
impact of road traffic crashes on human 
population as a public health problem. 
Useful for estimating severity of crashes. 
Might decline in countries with very large 
populations
Others indicators 
• Fatalities per 
vehicle-kilometre 
travelled 
© WHO, 2007 
10│ 
Useful for making international 
comparisons, decreases with motorization 
Does not take into account non-motorized 
travel 
• Disability-adjusted life 
years (DALYs) 
Estimate healthy life years lost to 
disability and mortality. 
DALYs combine both mortality and 
disability but do not include mental 
health consequences
Distribution of road fatalities 
© WHO, 2007 
11│
ROAD TRAFFIC DEATH RATES PER 100 000 
POPULATION (WHO, 2012) 
© WHO, 2007
© WHO, 2007 
13│
© WHO, 2007 
Evolution of road mortality 
over time 
14│
© WHO, 2007 
15│ 
Brazil
© WHO, 2007 
16│ 
India
© WHO, 2007 
17│ 
Vietnam
© WHO, 2007 
18│
© WHO, 2007 
TRENDS (WHO, 2012)
© WHO, 2007 
20│ 
Key points 
Decreasing trends in road traffic deaths in high-income 
countries, despite high levels of motorization 
(number of motor vehicle per capita) 
Increasing or stable trends in most low- and 
middle-income countries, despite low to average (but 
increasing) levels of motorization 
Traffic injuries and deaths represent a serious threat to 
development in low-income countries, and jeopardise 
the pursuit of equity in health
Differences in road fatalities 
between low-middle and high 
© WHO, 2007 
income countries 
21│
© WHO, 2007 
France
© WHO, 2007 
23│ 
Brazil
© WHO, 2007 
Thailand
Proportion of road deaths by transportation 
0% 20% 40% 60% 80% 100% 
Australia 
Delhi, India 
Kenya 
Malaysia 
Netherlands 
Sri Lanka 
© WHO, 2007 
modes 
25│ 
Pedestrians 
Motorized 4-wheelers 
Bicyclists Motorized 2-wheelers 
USA
Vulnerable road users 
 Pedestrians, cyclists, 
motorcyclists and moped riders 
are considered as vulnerable 
since they benefit from little 
or no external protective 
devices that would absorb 
energy in a collision. 
 They constitute with almost no 
exception the weak party in a 
road traffic crash 
© WHO, 2007 
26│
Vulnerable road users 
 Half of the road fatalities occurring each year concern 
vulnerable road users (VRUs). They predominate in low 
and middle income countries, where levels of 
motorization are low 
 With children and elderly being overrepresented among 
victims 
 Safety of VRUs became a health priority for 
International Agencies such as the WHO and the UN in 
2004 (WHO report on road safety, 2004) 
© WHO, 2007 
27│
Road deaths, 2012 
© WHO, 2007
Impact of policies toward VRUs 
© WHO, 2007 
29│
© WHO, 2007 
Thailand 
30│ 
Back to Thailand…
Regulations in Thailand 
© WHO, 2007 
31│
© WHO, 2007 
In Europe 
Death risk for 100 million person / kilometres travelled: 
 13.8 for motorised two-wheelers 
 6.4 for pedestrians 
 5.4 for bicyclists 
 0.7 for car users 
 0.07 for bus and coach passengers. 
Source: European Transport Safety Council 
32│
© WHO, 2007 
Helmet use 
According to Reviews conducted by Authors from the 
Cochrane Collaboration: 
- Helmets are effective in reducing head injuries in 
motorcyclists who crash by 69% and death by 42% (Liu et al., 
2009) 
- Helmets provide a 63 to 88% reduction in the risk of 
head, and severe brain injury for all ages 
(Thompson, Rivara, & Thompson, 2009)
© WHO, 2007 
34│ 
Road fatalities: Florida 
Helmet law for motorcyclists was lifted 
Source: NHTSA (USA)
Europe standardized rates 
Source: CARE Database / EC 
© WHO, 2007 
Date 35│ 
of query: August 2008
From Islamabad, Pakistan 
© WHO, 2007 
36│
© WHO, 2007 
37│
© WHO, 2007 
38│
Conclusion 
 High rates of mortality among VRUS might be due to several 
interacting factors : 
 Road infrastructure not adapted (bicycle lanes; 
separation between VRU and motorized traffic; etc.) 
 Few/No policies towards VRU 
 Risk behaviours and/or poor law enforcement 
 Absence of protective behaviour (helmet use..) 
© WHO, 2007 
39│
Constant & Lagarde 
© WHO, 2007 
40│
What can be done?: An example of intervention 
© WHO, 2007 
41│ 
study towards cyclists 
Investigating Helmet Promotion for Cyclists: 
Results from a Randomised Study with Observation of 
Behaviour, Using a Semi-Automatic Video System
Helmet use 
 In France, helmet is not mandatory for cyclists 
 The efficacy of lawful mandatory helmet use is in dispute, 
because: 
 of possible negative side-effects such as risk compensation 
 and possible decline in the number of cyclists (see 
Robinson, BMJ) 
 We launched a randomized comparative study that 
measured for the first time the efficacy of non legislative 
interventions to promote helmet use among cyclists 
© WHO, 2007 
42│
Methods 
 Participants were recruited in a borrow-a-bike municipal 
program. They completed a questionnaire on their attitudes 
toward road safety and helmet use. 
 They were assigned to one of the four groups: 
 Control group 
 Group #1: They received an information on helmet benefit 
 Group #2: They received a helmet 
 Group #3: They received both 
An ID coloured code was put on their rear mudguard. 
© WHO, 2007 
43│
Recruitment center 
© WHO, 2007
Municipality Bicycles 
© WHO, 2007
© WHO, 2007 
(Not good 
looking) helmets 
were given to 
groups #2 and #3
© WHO, 2007 
standardized 
brochures were 
given to groups #1 
and #3
© WHO, 2007
Outcomes 
 Five automatized observation sites were deployed in the 
urban centre of Bordeaux. Two of them made observations in 
both directions, leading to a total of seven observation spots 
 A first camera was programmed to detect moving objects, 
isolate cyclists, and calculate speed 
 A second synchronised high-definition camera 
automatically took a photo of each detected cyclist from 
behind at a 45 degree angle. 
© WHO, 2007 
49│
were connected to the main 
our settings via the 
INSERM 
© WHO, 2007 
50│
© WHO, 2007
© WHO, 2007
© WHO, 2007
Data collection 
© WHO, 2007
Data collection 
© WHO, 2007
© WHO, 2007
© WHO, 2007
© WHO, 2007 
58│
© WHO, 2007 
59│
© WHO, 2007 
60│
© WHO, 2007 
61│
© WHO, 2007 
62│ 
An ignored risk: 
Umbrella and Cycling
Conclusion 
 Helmet wearing rate ? 
 Efficiency of information to promote helmet use? 
 Duration of effect ? 
 Cues to improve helmet wearing rates ? 
© WHO, 2007 
63│
© WHO, 2007 
Road injuries: Risk Factors 
64│
Male gender 
© WHO, 2007 
65│
© WHO, 2007 
66│
Road deaths affect primarly young 
© WHO, 2007 
people 
67│
© WHO, 2007 
68│ 
Risk factors 
Behaviours 
• A study estimate that more than 90% of collisions occur 
because of human factor (see above) 
• Some Risky road behaviour increase the likelihood of traffic 
crashes 
• Excessive speed 
• Driving while alcohol-intoxicated 
• Sleepy driving
© WHO, 2007 
69│ 
Risk factors 
• Some behaviours increase the severity of a crash 
• Seats-belts not used (4-wheel drivers) 
• Helmet not used, no protective clothes (2-wheel drivers) 
• Insufficient car protection 
• Some behaviours increase both 
• Excessive speed 
• Driving while alcohol-intoxicated
© WHO, 2007 
70│
© WHO, 2007 
71│ 
Effect of alcohol in traffic 
 Alcohol directly weakens driver skills: 
- less attention and visual detection 
- longer reaction time 
- problem with keeping course 
 Accident risk increases exponentially depending on Blood 
Alcohol Content (BAC): 
- 0,5 g/l: 1,5 times higher than sober 
- 0,8 g/l: 2 times higher than sober 
- 1,3 g/l: 15 times higher than sober 
- 1,8 g/l: 50 times higher than sober 
71
© WHO, 2007 
72│ 
Accident risk of drink drivers at 
different BAC-levels
© WHO, 2007 
73│ 
Risk factors 
Road and environmental factors 
• Traffic density 
• Time (day/night; week-end/other; vacations; other) 
• Reduced visibility (absence / poor street lighting) 
• Type of road (highway, rural roads..), quality of the road surface 
• Road engineering and infrastructure 
• Unforgiving infrastructures 
• Protection for pedestrians/cyclists (bicycle lanes, traffic island..)
© WHO, 2007 
74│ 
Risk factors 
Vehicle characteristics 
• Roadworthiness 
• Lighting 
• Braking 
• Handling 
• Speed management 
• Etc.
The psychology of road traffic 
© WHO, 2007 
Crashes 
75│
The Haddon Matrix 
 Conceptual model that applies basic principles of public 
health to the problem of traffic safety. extremely useful and 
effective tool for revealing where and when to best conduct 
traffic safety interventions 
• Highlight injuries in terms of causal and contributing 
factors, as well as in terms of a time sequence consisting 
of pre-event, event, and post-event phases. 
© WHO, 2007 
76│
The Haddon Matrix 
 Consists of four (or three) columns representing the 
causal agents in the crash: the driver, the vehicle, and 
the physical and socio-economic environment 
 Three rows representing time phases: 
 pre-crash (before a potential vehicle collision), 
 crash (the actual event), 
 and post-crash (the immediate aftermath). 
© WHO, 2007 
77│
Haddon Matrix 
© WHO, 2007 
78│ 
Factors 
Vehicles and equipment Environment 
Phase Human 
Pre-crash Crash 
prevention 
Information 
Attitudes 
Impairment 
Police enforcement 
Roadworthiness 
Lighting 
Braking 
Handling 
Speed management 
Road design and 
road layout 
Speed limits 
Pedestrian 
facilities
Haddon Matrix 
© WHO, 2007 
79│ 
Factors 
Vehicles and equipment Environment 
Phase Human 
Pre-crash Crash 
prevention 
Information 
Attitudes 
behaviourt 
Police enforcement 
Roadworthiness 
Lighting 
Braking 
Handling 
Speed management 
Road design and 
road layout 
Speed limits 
Pedestrian 
facilities 
Crash Injury 
prevention 
during the 
crash 
Use of restraints 
Impairment 
Occupant restraints 
Other safety devices 
Crash protective design 
Crash-protective 
roadside objects 
Forgiving 
infrastructure
Haddon Matrix 
© WHO, 2007 
80│ 
Factors 
Vehicles and equipment Environment 
Phase Human 
Pre-crash Crash 
prevention 
Information 
Attitudes 
behaviour 
Police enforcement 
Roadworthiness 
Lighting 
Braking 
Handling 
Speed management 
Road design and 
road layout 
Speed limits 
Pedestrian 
facilities 
Crash Injury 
prevention 
during the 
crash 
Use of restraints 
Impairment 
Occupant restraints 
Other safety devices 
Crash protective design 
Crash-protective 
roadside objects 
Forgiving 
infrastructure 
Post-crash Life 
sustaining 
First-aid skill 
Access to medics 
Ease of access 
Fire risk 
Rescue facilities 
Congestion
Haddon Matrix 
© WHO, 2007 
81│ 
Factors 
Vehicles and equipment Environment 
Phase Human 
Pre-crash Crash 
prevention 
Information 
Attitudes 
behaviour 
Police enforcement 
Roadworthiness 
Lighting 
Braking 
Handling 
Speed management 
Road design and 
road layout 
Speed limits 
Pedestrian 
facilities 
Crash Injury 
prevention 
during the 
crash 
Use of restraints 
Impairment 
Occupant restraints 
Other safety devices 
Crash protective design 
Crash-protective 
roadside objects 
Post-crash Life 
sustaining 
First-aid skill 
Access to medics 
Ease of access 
Fire risk 
Rescue facilities 
Congestion
 Psychological and sociological models are of interest 
in studying human factors influencing the likelihhod 
of a crash before its occurrence (pre-crash) 
© WHO, 2007 
82│ 
Information 
Attitudes 
Norms 
Police 
enforcement 
Behaviours
Theory of planned behaviour (TPB) 
 Azjen (1991) suggested various factors combine to form an 
intention to act a certain way. 
© WHO, 2007 
83│ 
Attitudes toward 
behaviour 
Subjective 
norms 
Perceived 
behavioural 
control 
Intention to 
behave in a 
certain way 
Behaviour
Application of the TPB to road safety 
© WHO, 2007 
84│
Application of the TPB to road safety 
© WHO, 2007 
85│
Application of the TPB to road safety 
© WHO, 2007 
86│
Application of the TPB to road safety 
© WHO, 2007 
87│
© WHO, 2007 
88│ 
Predict intention 
Predict self reported 
behaviour 
Do not predict actual 
behaviour
© WHO, 2007 
89│
© WHO, 2007 
90│
© WHO, 2007 
Develop and evaluate intervention 
91│
© WHO, 2007 
92│ 
How to reduce road fatalities ? 
Evidence-based interventions 
• Usually, preventive interventions are assessed through 
longitudinal studies 
• The statistical unit is a target population 
• An outcome of interest is assessed before and after a 
preventive intervention (number of fatalities or head injuries 
when testing helmet law) 
• Ecological or “before-after” studies
Recent changes in French road safety 
14 000 
12 000 
10 000 
8 000 
6 000 
4 000 
2 000 
© WHO, 2007 
93│ 
0 
number of fatalities 
Number of road fatalities
Recent changes in French road safety 
14 000 
12 000 
10 000 
8 000 
6 000 
4 000 
2 000 
© WHO, 2007 
94│ 
0 
number of fatalities 
40,00% 
35,00% 
30,00% 
25,00% 
20,00% 
15,00% 
10,00% 
5,00% 
0,00% 
speed excesses % 
fatalities up to 2001 fatalities from 2001
The case of France 
• France is a high income country 
• Good infrastructure (highway, rural roads) and vehicles 
• High level of motorization 
• Numerous information campaigns against risky road 
behaviours since the 70’s 
• Road fatalities in 1976: 16 000 
• Decrease in road fatalities: 1975 -2001: - 2% on average 
© WHO, 2007 
95│ 
• 2002 - 2009: -44.4%
Automatic Speed cameras In France 
© WHO, 2007 
96│
© WHO, 2007 
97│
Influence on attitudes towards 
road safety and road behaviours 
 How attitudes toward traffic safety have changed between 
2001 and 2004? 
 How road behaviours have changed between 2001 and 
2007 
 What are the determinants of these changes? 
 Relevance: Providing useful insights into what occurred in 
this remarkable period and help assessment of whether 
observed behavioural changes are stable. 
© WHO, 2007 
98│
Methods: a prospective study in 
the GAZEL cohort 
 Participants: Current employees or recent retirees of the 
French national electricity and gas company, who volunteered to 
participate in a research cohort, known as the GAZEL cohort. 
 The same questionnaire was used to assess behaviours 
and attitudes toward road safety in 2001, 2004 and 2007 
 Data was also available from the cohort database (gender, age, 
occupational category, alcohol consumption, etc.) 
© WHO, 2007 
99│
Study on attitudes and road behaviors and 
in the GAZEL cohort 
© WHO, 2007 
100│ 
2001 2002 2004 
First 
Assessment 
2003 2005 2006 2007
Study on attitudes and road behaviors and 
in the GAZEL cohort 
French government 
© WHO, 2007 
101│ 
2001 2002 2004 
First 
Assessment 
2003 2005 2006 2007 
enact a zero 
tolerance policy
Study on attitudes and road behaviors and 
in the GAZEL cohort 
French government 
© WHO, 2007 
102│ 
2001 2002 2004 
First 
Assessment 
2003 2005 2006 2007 
enact a zero 
tolerance policy 
Increased law enforcement: 
-Automatic speed cameras 
- Alcohol controls 
Phoning and driving forbidden 
End of indulgences (ticket fixing) 
Legal sanctions harshened 
Dramatic decreases in road 
fatalities and in road injuries
Study on attitudes and road behaviors and 
in the GAZEL cohort 
© WHO, 2007 
103│ 
2001 2002 2004 
First 
Assessment 
2003 2005 2006 2007 
Second 
Assessment 
Third 
Assessment 
French government 
enact a zero 
tolerance policy
Influence of increased enforcement on attitudes 
© WHO, 2007 
104│
Influence of increased enforcement on attitudes 
© WHO, 2007 
105│
Conclusion 1 
Increased traffic law enforcement measures led to increasing 
support for current restrictions between 2001 and 2004. 
Even if support for additional traffic law enforcement began to 
wane slightly in 2004 (-4%), a large part of participants 
remained in favour of strengthening law enforcement 
related to speeding (61%) and drink driving (80%). 
© WHO, 2007 
106│
Influence of increased enforcement on excessive speed 
(reported speed at least 20 km/hour above the limit) 
© WHO, 2007 
107│
Influence of increased enforcement DWI 
© WHO, 2007 
108│
Conclusion 2 
Between 2001 and 2007, the proportion of participants who 
reported having driven at speeds at least 20 km/hour above the 
limit decreased in built-up areas, on rural roads and on 
highways 
But the recent crackdown on road violations by the French 
government has failed to deter DWI, despite declines in 
overall alcohol consuption over the same period 
© WHO, 2007 
109│
Unlike speeding, detection of DWI offenders cannot be achieved 
through automated devices, thus limiting the probability of 
being arrested for DWI. 
DWI remained unchanged although attitudes and norms 
rejecting such behaviour are very high in the population 
And despite the fact that DWI is identifed by 92% of drivers as 
a major cause of fatal crash (SARTRE Study) 
© WHO, 2007 
110│ 
Conclusions
Safety is mainly about…. 
1) behaviour 
2) behaviour change 
3) and (in the case of road safety) law enforcement 
© WHO, 2007 
111│ 
Conclusions
First, change behaviours (hardest part of the job, really) 
Then, health issues, and all related costs, will (hopefully) 
decrease, 
And finally, attitudes and norms will follow … 
© WHO, 2007 
112│ 
Implications for health actions and 
prevention initiatives

Road safety: from public health to psychology

  • 1.
    Improving Road safety: From public health to psychology © WHO, 2007 Aymery Constant, PhD Maître de conférence / Lecturer EHESP / French School of Public Health 1│
  • 2.
    © WHO, 2007 2│ Mobility • Every person has to move during lifetime • Going to school, work, shopping, travel... • Different transportation modes: motorized and non motorized But this is not a safe activity
  • 3.
    © WHO, 2007 Road mortality and injuries: A major public health issue 3│
  • 4.
    © WHO, 2007 Road traffic crashes • 1.2 million deaths a year (road mortality) • 20-50 million injuries/disabilities (road injuries) • 11th leading cause of death • Account for 2.1% of all deaths globally
  • 5.
    Global status reporton road safety 2013 © WHO, 2007
  • 6.
    Drowning 7.3% ©WHO, 2007 6│ Distribution of global injury mortality by cause Suicide 16.9% Violence 10.8% War 3.4% Poisoning 6.7% Falls 7.5% Fires 6.2% Road traffic injuries 22.8% Other intentional injuries 0.2% Other unintentional injuries 18.1% Road traffic injuries account for 23% of all fatal injuries worldwide Source: WHO Global Burden of Disease project, 2002, Version 1
  • 7.
    Indicators of roadtraffic safety © WHO, 2007 7│
  • 8.
    Absolutes Figures •Number of injuries indicating the number of people injured in © WHO, 2007 8│ road traffic crashes Not very useful for making comparisons. A large proportion of slight injuries are not reported • Number of deaths indicating the number of people who die as a result of a road traffic crash Gives a partial estimate of the magnitude of the road traffic injury problem, in terms of death
  • 9.
    • Fatalities per10 000 vehicles © WHO, 2007 9│ showing ratio of fatalities to number of motor vehicles. Shows probability of vehicle involvement in fatal crashes It omits non-motorized transport and declines with motorization Relative figures • Fatalities per 100 000 pop impact of road traffic crashes on human population as a public health problem. Useful for estimating severity of crashes. Might decline in countries with very large populations
  • 10.
    Others indicators •Fatalities per vehicle-kilometre travelled © WHO, 2007 10│ Useful for making international comparisons, decreases with motorization Does not take into account non-motorized travel • Disability-adjusted life years (DALYs) Estimate healthy life years lost to disability and mortality. DALYs combine both mortality and disability but do not include mental health consequences
  • 11.
    Distribution of roadfatalities © WHO, 2007 11│
  • 12.
    ROAD TRAFFIC DEATHRATES PER 100 000 POPULATION (WHO, 2012) © WHO, 2007
  • 13.
  • 14.
    © WHO, 2007 Evolution of road mortality over time 14│
  • 15.
    © WHO, 2007 15│ Brazil
  • 16.
    © WHO, 2007 16│ India
  • 17.
    © WHO, 2007 17│ Vietnam
  • 18.
  • 19.
    © WHO, 2007 TRENDS (WHO, 2012)
  • 20.
    © WHO, 2007 20│ Key points Decreasing trends in road traffic deaths in high-income countries, despite high levels of motorization (number of motor vehicle per capita) Increasing or stable trends in most low- and middle-income countries, despite low to average (but increasing) levels of motorization Traffic injuries and deaths represent a serious threat to development in low-income countries, and jeopardise the pursuit of equity in health
  • 21.
    Differences in roadfatalities between low-middle and high © WHO, 2007 income countries 21│
  • 22.
    © WHO, 2007 France
  • 23.
    © WHO, 2007 23│ Brazil
  • 24.
    © WHO, 2007 Thailand
  • 25.
    Proportion of roaddeaths by transportation 0% 20% 40% 60% 80% 100% Australia Delhi, India Kenya Malaysia Netherlands Sri Lanka © WHO, 2007 modes 25│ Pedestrians Motorized 4-wheelers Bicyclists Motorized 2-wheelers USA
  • 26.
    Vulnerable road users  Pedestrians, cyclists, motorcyclists and moped riders are considered as vulnerable since they benefit from little or no external protective devices that would absorb energy in a collision.  They constitute with almost no exception the weak party in a road traffic crash © WHO, 2007 26│
  • 27.
    Vulnerable road users  Half of the road fatalities occurring each year concern vulnerable road users (VRUs). They predominate in low and middle income countries, where levels of motorization are low  With children and elderly being overrepresented among victims  Safety of VRUs became a health priority for International Agencies such as the WHO and the UN in 2004 (WHO report on road safety, 2004) © WHO, 2007 27│
  • 28.
    Road deaths, 2012 © WHO, 2007
  • 29.
    Impact of policiestoward VRUs © WHO, 2007 29│
  • 30.
    © WHO, 2007 Thailand 30│ Back to Thailand…
  • 31.
    Regulations in Thailand © WHO, 2007 31│
  • 32.
    © WHO, 2007 In Europe Death risk for 100 million person / kilometres travelled:  13.8 for motorised two-wheelers  6.4 for pedestrians  5.4 for bicyclists  0.7 for car users  0.07 for bus and coach passengers. Source: European Transport Safety Council 32│
  • 33.
    © WHO, 2007 Helmet use According to Reviews conducted by Authors from the Cochrane Collaboration: - Helmets are effective in reducing head injuries in motorcyclists who crash by 69% and death by 42% (Liu et al., 2009) - Helmets provide a 63 to 88% reduction in the risk of head, and severe brain injury for all ages (Thompson, Rivara, & Thompson, 2009)
  • 34.
    © WHO, 2007 34│ Road fatalities: Florida Helmet law for motorcyclists was lifted Source: NHTSA (USA)
  • 35.
    Europe standardized rates Source: CARE Database / EC © WHO, 2007 Date 35│ of query: August 2008
  • 36.
    From Islamabad, Pakistan © WHO, 2007 36│
  • 37.
  • 38.
  • 39.
    Conclusion  Highrates of mortality among VRUS might be due to several interacting factors :  Road infrastructure not adapted (bicycle lanes; separation between VRU and motorized traffic; etc.)  Few/No policies towards VRU  Risk behaviours and/or poor law enforcement  Absence of protective behaviour (helmet use..) © WHO, 2007 39│
  • 40.
    Constant & Lagarde © WHO, 2007 40│
  • 41.
    What can bedone?: An example of intervention © WHO, 2007 41│ study towards cyclists Investigating Helmet Promotion for Cyclists: Results from a Randomised Study with Observation of Behaviour, Using a Semi-Automatic Video System
  • 42.
    Helmet use In France, helmet is not mandatory for cyclists  The efficacy of lawful mandatory helmet use is in dispute, because:  of possible negative side-effects such as risk compensation  and possible decline in the number of cyclists (see Robinson, BMJ)  We launched a randomized comparative study that measured for the first time the efficacy of non legislative interventions to promote helmet use among cyclists © WHO, 2007 42│
  • 43.
    Methods  Participantswere recruited in a borrow-a-bike municipal program. They completed a questionnaire on their attitudes toward road safety and helmet use.  They were assigned to one of the four groups:  Control group  Group #1: They received an information on helmet benefit  Group #2: They received a helmet  Group #3: They received both An ID coloured code was put on their rear mudguard. © WHO, 2007 43│
  • 44.
  • 45.
  • 46.
    © WHO, 2007 (Not good looking) helmets were given to groups #2 and #3
  • 47.
    © WHO, 2007 standardized brochures were given to groups #1 and #3
  • 48.
  • 49.
    Outcomes  Fiveautomatized observation sites were deployed in the urban centre of Bordeaux. Two of them made observations in both directions, leading to a total of seven observation spots  A first camera was programmed to detect moving objects, isolate cyclists, and calculate speed  A second synchronised high-definition camera automatically took a photo of each detected cyclist from behind at a 45 degree angle. © WHO, 2007 49│
  • 50.
    were connected tothe main our settings via the INSERM © WHO, 2007 50│
  • 51.
  • 52.
  • 53.
  • 54.
  • 55.
  • 56.
  • 57.
  • 58.
  • 59.
  • 60.
  • 61.
  • 62.
    © WHO, 2007 62│ An ignored risk: Umbrella and Cycling
  • 63.
    Conclusion  Helmetwearing rate ?  Efficiency of information to promote helmet use?  Duration of effect ?  Cues to improve helmet wearing rates ? © WHO, 2007 63│
  • 64.
    © WHO, 2007 Road injuries: Risk Factors 64│
  • 65.
    Male gender ©WHO, 2007 65│
  • 66.
  • 67.
    Road deaths affectprimarly young © WHO, 2007 people 67│
  • 68.
    © WHO, 2007 68│ Risk factors Behaviours • A study estimate that more than 90% of collisions occur because of human factor (see above) • Some Risky road behaviour increase the likelihood of traffic crashes • Excessive speed • Driving while alcohol-intoxicated • Sleepy driving
  • 69.
    © WHO, 2007 69│ Risk factors • Some behaviours increase the severity of a crash • Seats-belts not used (4-wheel drivers) • Helmet not used, no protective clothes (2-wheel drivers) • Insufficient car protection • Some behaviours increase both • Excessive speed • Driving while alcohol-intoxicated
  • 70.
  • 71.
    © WHO, 2007 71│ Effect of alcohol in traffic  Alcohol directly weakens driver skills: - less attention and visual detection - longer reaction time - problem with keeping course  Accident risk increases exponentially depending on Blood Alcohol Content (BAC): - 0,5 g/l: 1,5 times higher than sober - 0,8 g/l: 2 times higher than sober - 1,3 g/l: 15 times higher than sober - 1,8 g/l: 50 times higher than sober 71
  • 72.
    © WHO, 2007 72│ Accident risk of drink drivers at different BAC-levels
  • 73.
    © WHO, 2007 73│ Risk factors Road and environmental factors • Traffic density • Time (day/night; week-end/other; vacations; other) • Reduced visibility (absence / poor street lighting) • Type of road (highway, rural roads..), quality of the road surface • Road engineering and infrastructure • Unforgiving infrastructures • Protection for pedestrians/cyclists (bicycle lanes, traffic island..)
  • 74.
    © WHO, 2007 74│ Risk factors Vehicle characteristics • Roadworthiness • Lighting • Braking • Handling • Speed management • Etc.
  • 75.
    The psychology ofroad traffic © WHO, 2007 Crashes 75│
  • 76.
    The Haddon Matrix  Conceptual model that applies basic principles of public health to the problem of traffic safety. extremely useful and effective tool for revealing where and when to best conduct traffic safety interventions • Highlight injuries in terms of causal and contributing factors, as well as in terms of a time sequence consisting of pre-event, event, and post-event phases. © WHO, 2007 76│
  • 77.
    The Haddon Matrix  Consists of four (or three) columns representing the causal agents in the crash: the driver, the vehicle, and the physical and socio-economic environment  Three rows representing time phases:  pre-crash (before a potential vehicle collision),  crash (the actual event),  and post-crash (the immediate aftermath). © WHO, 2007 77│
  • 78.
    Haddon Matrix ©WHO, 2007 78│ Factors Vehicles and equipment Environment Phase Human Pre-crash Crash prevention Information Attitudes Impairment Police enforcement Roadworthiness Lighting Braking Handling Speed management Road design and road layout Speed limits Pedestrian facilities
  • 79.
    Haddon Matrix ©WHO, 2007 79│ Factors Vehicles and equipment Environment Phase Human Pre-crash Crash prevention Information Attitudes behaviourt Police enforcement Roadworthiness Lighting Braking Handling Speed management Road design and road layout Speed limits Pedestrian facilities Crash Injury prevention during the crash Use of restraints Impairment Occupant restraints Other safety devices Crash protective design Crash-protective roadside objects Forgiving infrastructure
  • 80.
    Haddon Matrix ©WHO, 2007 80│ Factors Vehicles and equipment Environment Phase Human Pre-crash Crash prevention Information Attitudes behaviour Police enforcement Roadworthiness Lighting Braking Handling Speed management Road design and road layout Speed limits Pedestrian facilities Crash Injury prevention during the crash Use of restraints Impairment Occupant restraints Other safety devices Crash protective design Crash-protective roadside objects Forgiving infrastructure Post-crash Life sustaining First-aid skill Access to medics Ease of access Fire risk Rescue facilities Congestion
  • 81.
    Haddon Matrix ©WHO, 2007 81│ Factors Vehicles and equipment Environment Phase Human Pre-crash Crash prevention Information Attitudes behaviour Police enforcement Roadworthiness Lighting Braking Handling Speed management Road design and road layout Speed limits Pedestrian facilities Crash Injury prevention during the crash Use of restraints Impairment Occupant restraints Other safety devices Crash protective design Crash-protective roadside objects Post-crash Life sustaining First-aid skill Access to medics Ease of access Fire risk Rescue facilities Congestion
  • 82.
     Psychological andsociological models are of interest in studying human factors influencing the likelihhod of a crash before its occurrence (pre-crash) © WHO, 2007 82│ Information Attitudes Norms Police enforcement Behaviours
  • 83.
    Theory of plannedbehaviour (TPB)  Azjen (1991) suggested various factors combine to form an intention to act a certain way. © WHO, 2007 83│ Attitudes toward behaviour Subjective norms Perceived behavioural control Intention to behave in a certain way Behaviour
  • 84.
    Application of theTPB to road safety © WHO, 2007 84│
  • 85.
    Application of theTPB to road safety © WHO, 2007 85│
  • 86.
    Application of theTPB to road safety © WHO, 2007 86│
  • 87.
    Application of theTPB to road safety © WHO, 2007 87│
  • 88.
    © WHO, 2007 88│ Predict intention Predict self reported behaviour Do not predict actual behaviour
  • 89.
  • 90.
  • 91.
    © WHO, 2007 Develop and evaluate intervention 91│
  • 92.
    © WHO, 2007 92│ How to reduce road fatalities ? Evidence-based interventions • Usually, preventive interventions are assessed through longitudinal studies • The statistical unit is a target population • An outcome of interest is assessed before and after a preventive intervention (number of fatalities or head injuries when testing helmet law) • Ecological or “before-after” studies
  • 93.
    Recent changes inFrench road safety 14 000 12 000 10 000 8 000 6 000 4 000 2 000 © WHO, 2007 93│ 0 number of fatalities Number of road fatalities
  • 94.
    Recent changes inFrench road safety 14 000 12 000 10 000 8 000 6 000 4 000 2 000 © WHO, 2007 94│ 0 number of fatalities 40,00% 35,00% 30,00% 25,00% 20,00% 15,00% 10,00% 5,00% 0,00% speed excesses % fatalities up to 2001 fatalities from 2001
  • 95.
    The case ofFrance • France is a high income country • Good infrastructure (highway, rural roads) and vehicles • High level of motorization • Numerous information campaigns against risky road behaviours since the 70’s • Road fatalities in 1976: 16 000 • Decrease in road fatalities: 1975 -2001: - 2% on average © WHO, 2007 95│ • 2002 - 2009: -44.4%
  • 96.
    Automatic Speed camerasIn France © WHO, 2007 96│
  • 97.
  • 98.
    Influence on attitudestowards road safety and road behaviours  How attitudes toward traffic safety have changed between 2001 and 2004?  How road behaviours have changed between 2001 and 2007  What are the determinants of these changes?  Relevance: Providing useful insights into what occurred in this remarkable period and help assessment of whether observed behavioural changes are stable. © WHO, 2007 98│
  • 99.
    Methods: a prospectivestudy in the GAZEL cohort  Participants: Current employees or recent retirees of the French national electricity and gas company, who volunteered to participate in a research cohort, known as the GAZEL cohort.  The same questionnaire was used to assess behaviours and attitudes toward road safety in 2001, 2004 and 2007  Data was also available from the cohort database (gender, age, occupational category, alcohol consumption, etc.) © WHO, 2007 99│
  • 100.
    Study on attitudesand road behaviors and in the GAZEL cohort © WHO, 2007 100│ 2001 2002 2004 First Assessment 2003 2005 2006 2007
  • 101.
    Study on attitudesand road behaviors and in the GAZEL cohort French government © WHO, 2007 101│ 2001 2002 2004 First Assessment 2003 2005 2006 2007 enact a zero tolerance policy
  • 102.
    Study on attitudesand road behaviors and in the GAZEL cohort French government © WHO, 2007 102│ 2001 2002 2004 First Assessment 2003 2005 2006 2007 enact a zero tolerance policy Increased law enforcement: -Automatic speed cameras - Alcohol controls Phoning and driving forbidden End of indulgences (ticket fixing) Legal sanctions harshened Dramatic decreases in road fatalities and in road injuries
  • 103.
    Study on attitudesand road behaviors and in the GAZEL cohort © WHO, 2007 103│ 2001 2002 2004 First Assessment 2003 2005 2006 2007 Second Assessment Third Assessment French government enact a zero tolerance policy
  • 104.
    Influence of increasedenforcement on attitudes © WHO, 2007 104│
  • 105.
    Influence of increasedenforcement on attitudes © WHO, 2007 105│
  • 106.
    Conclusion 1 Increasedtraffic law enforcement measures led to increasing support for current restrictions between 2001 and 2004. Even if support for additional traffic law enforcement began to wane slightly in 2004 (-4%), a large part of participants remained in favour of strengthening law enforcement related to speeding (61%) and drink driving (80%). © WHO, 2007 106│
  • 107.
    Influence of increasedenforcement on excessive speed (reported speed at least 20 km/hour above the limit) © WHO, 2007 107│
  • 108.
    Influence of increasedenforcement DWI © WHO, 2007 108│
  • 109.
    Conclusion 2 Between2001 and 2007, the proportion of participants who reported having driven at speeds at least 20 km/hour above the limit decreased in built-up areas, on rural roads and on highways But the recent crackdown on road violations by the French government has failed to deter DWI, despite declines in overall alcohol consuption over the same period © WHO, 2007 109│
  • 110.
    Unlike speeding, detectionof DWI offenders cannot be achieved through automated devices, thus limiting the probability of being arrested for DWI. DWI remained unchanged although attitudes and norms rejecting such behaviour are very high in the population And despite the fact that DWI is identifed by 92% of drivers as a major cause of fatal crash (SARTRE Study) © WHO, 2007 110│ Conclusions
  • 111.
    Safety is mainlyabout…. 1) behaviour 2) behaviour change 3) and (in the case of road safety) law enforcement © WHO, 2007 111│ Conclusions
  • 112.
    First, change behaviours(hardest part of the job, really) Then, health issues, and all related costs, will (hopefully) decrease, And finally, attitudes and norms will follow … © WHO, 2007 112│ Implications for health actions and prevention initiatives