Downloaded 34 times


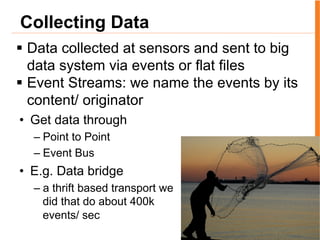
![CEP Query
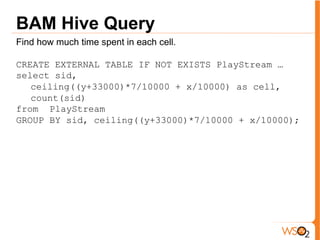
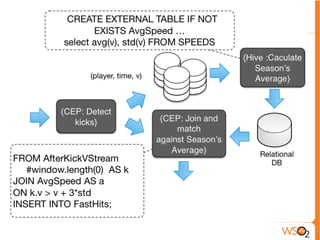
define partition sidPrt by PlayStream.sid,
LocBySecStream.sid
from PlayStream#window.timeBatch(1sec)
select sid, avg(x) as xMean, avg(y) as yMean, avg(z) as
zMean
insert into LocBySecStream partition by sidPrt
from every e1 = LocBySecStream ->
e2 = LocBySecStream [e1.yMean + 10000 > yMean
or yMean + 10000 > e1.yMean]
within 2sec select e1.sid
insert into LongAdvStream partition by sidPrt ;
Calculate the mean
location of each player
every second
Detect more
than 10m run](https://image.slidesharecdn.com/makingmostofcustomerdata-140806013600-phpapp02/85/Making-the-Most-of-Customer-Data-24-320.jpg)
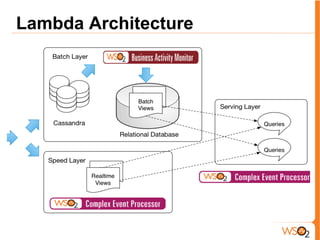

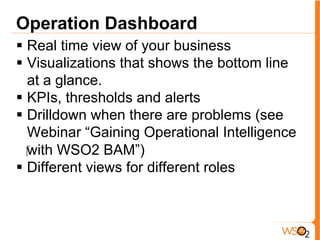


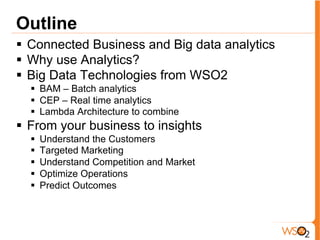
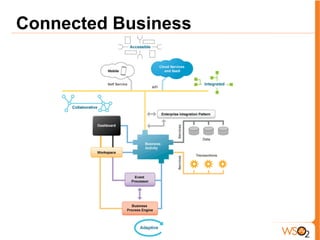
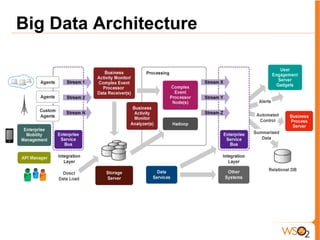
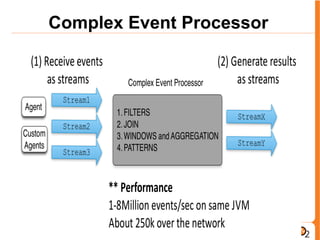
The document discusses how companies can use customer data and analytics to improve their business. It recommends using a big data platform to collect and analyze customer transaction logs and events. Basic analytics like Hive can be used to build customer profiles and identify high-value customers. More advanced techniques like complex event processing and predictive modeling can help with targeted marketing, understanding competition, optimizing operations, and predicting outcomes. The overall goal is to gain insights from data to better understand customers, markets, and how to adapt the business.


![[Roundtable] Choreo - The AI-Native Internal Developer Platform as a Service](https://cdn.slidesharecdn.com/ss_thumbnails/choreo-deck-250328074645-511dded7-thumbnail.jpg?width=640&height=640&fit=bounds)


