Download as PDF, PPTX

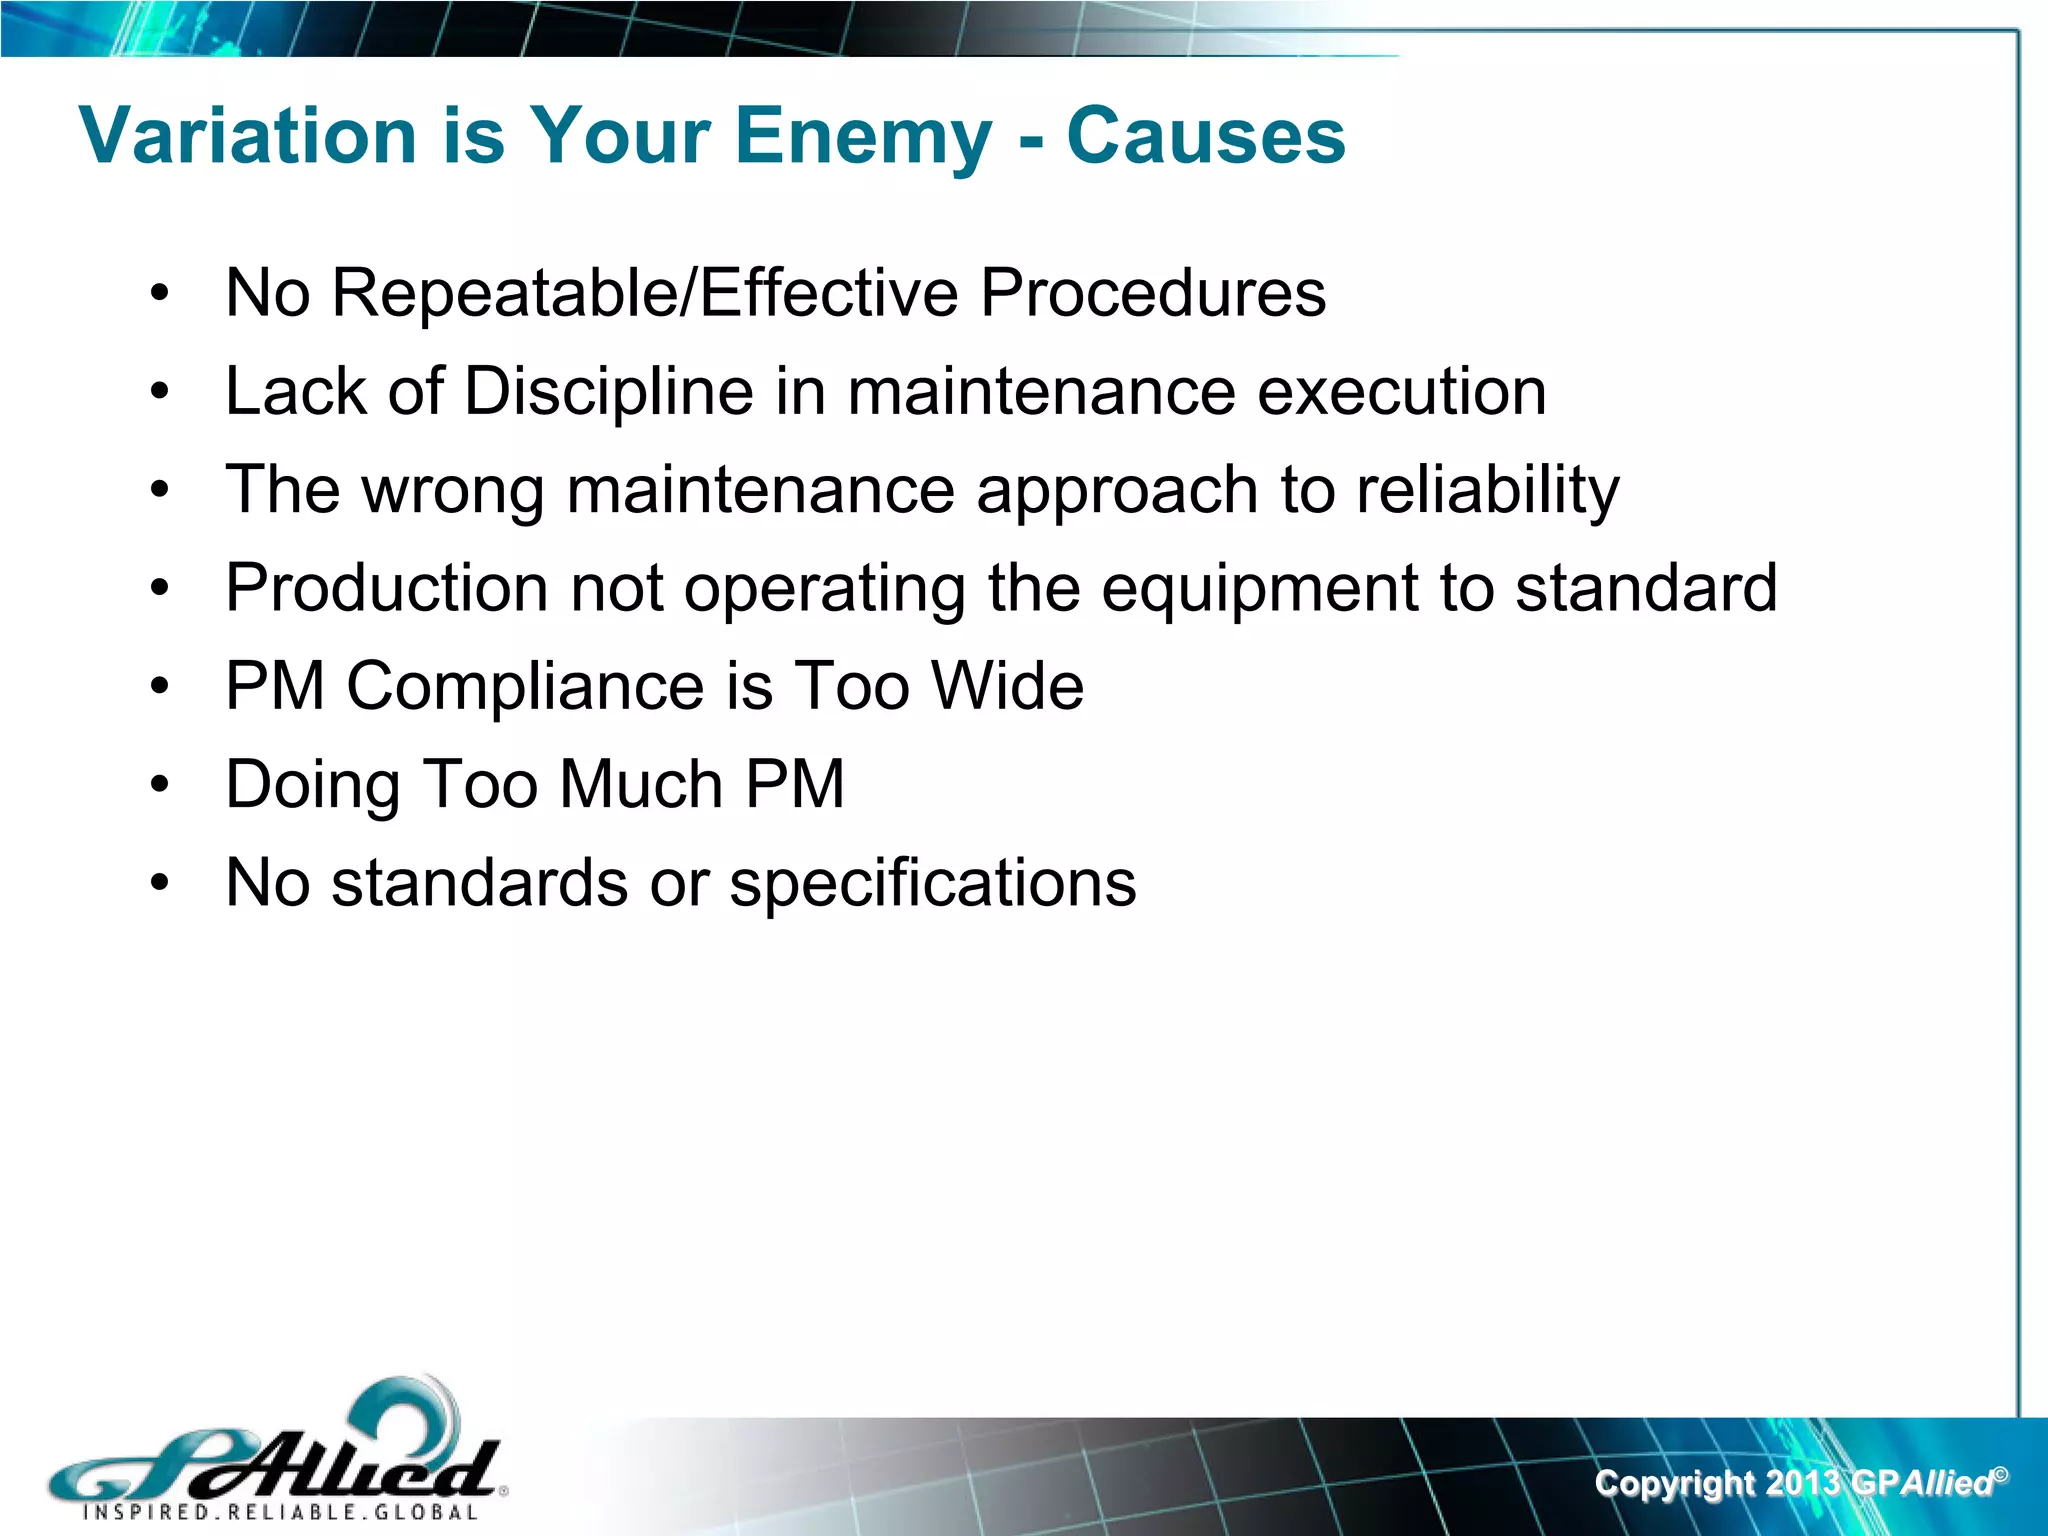
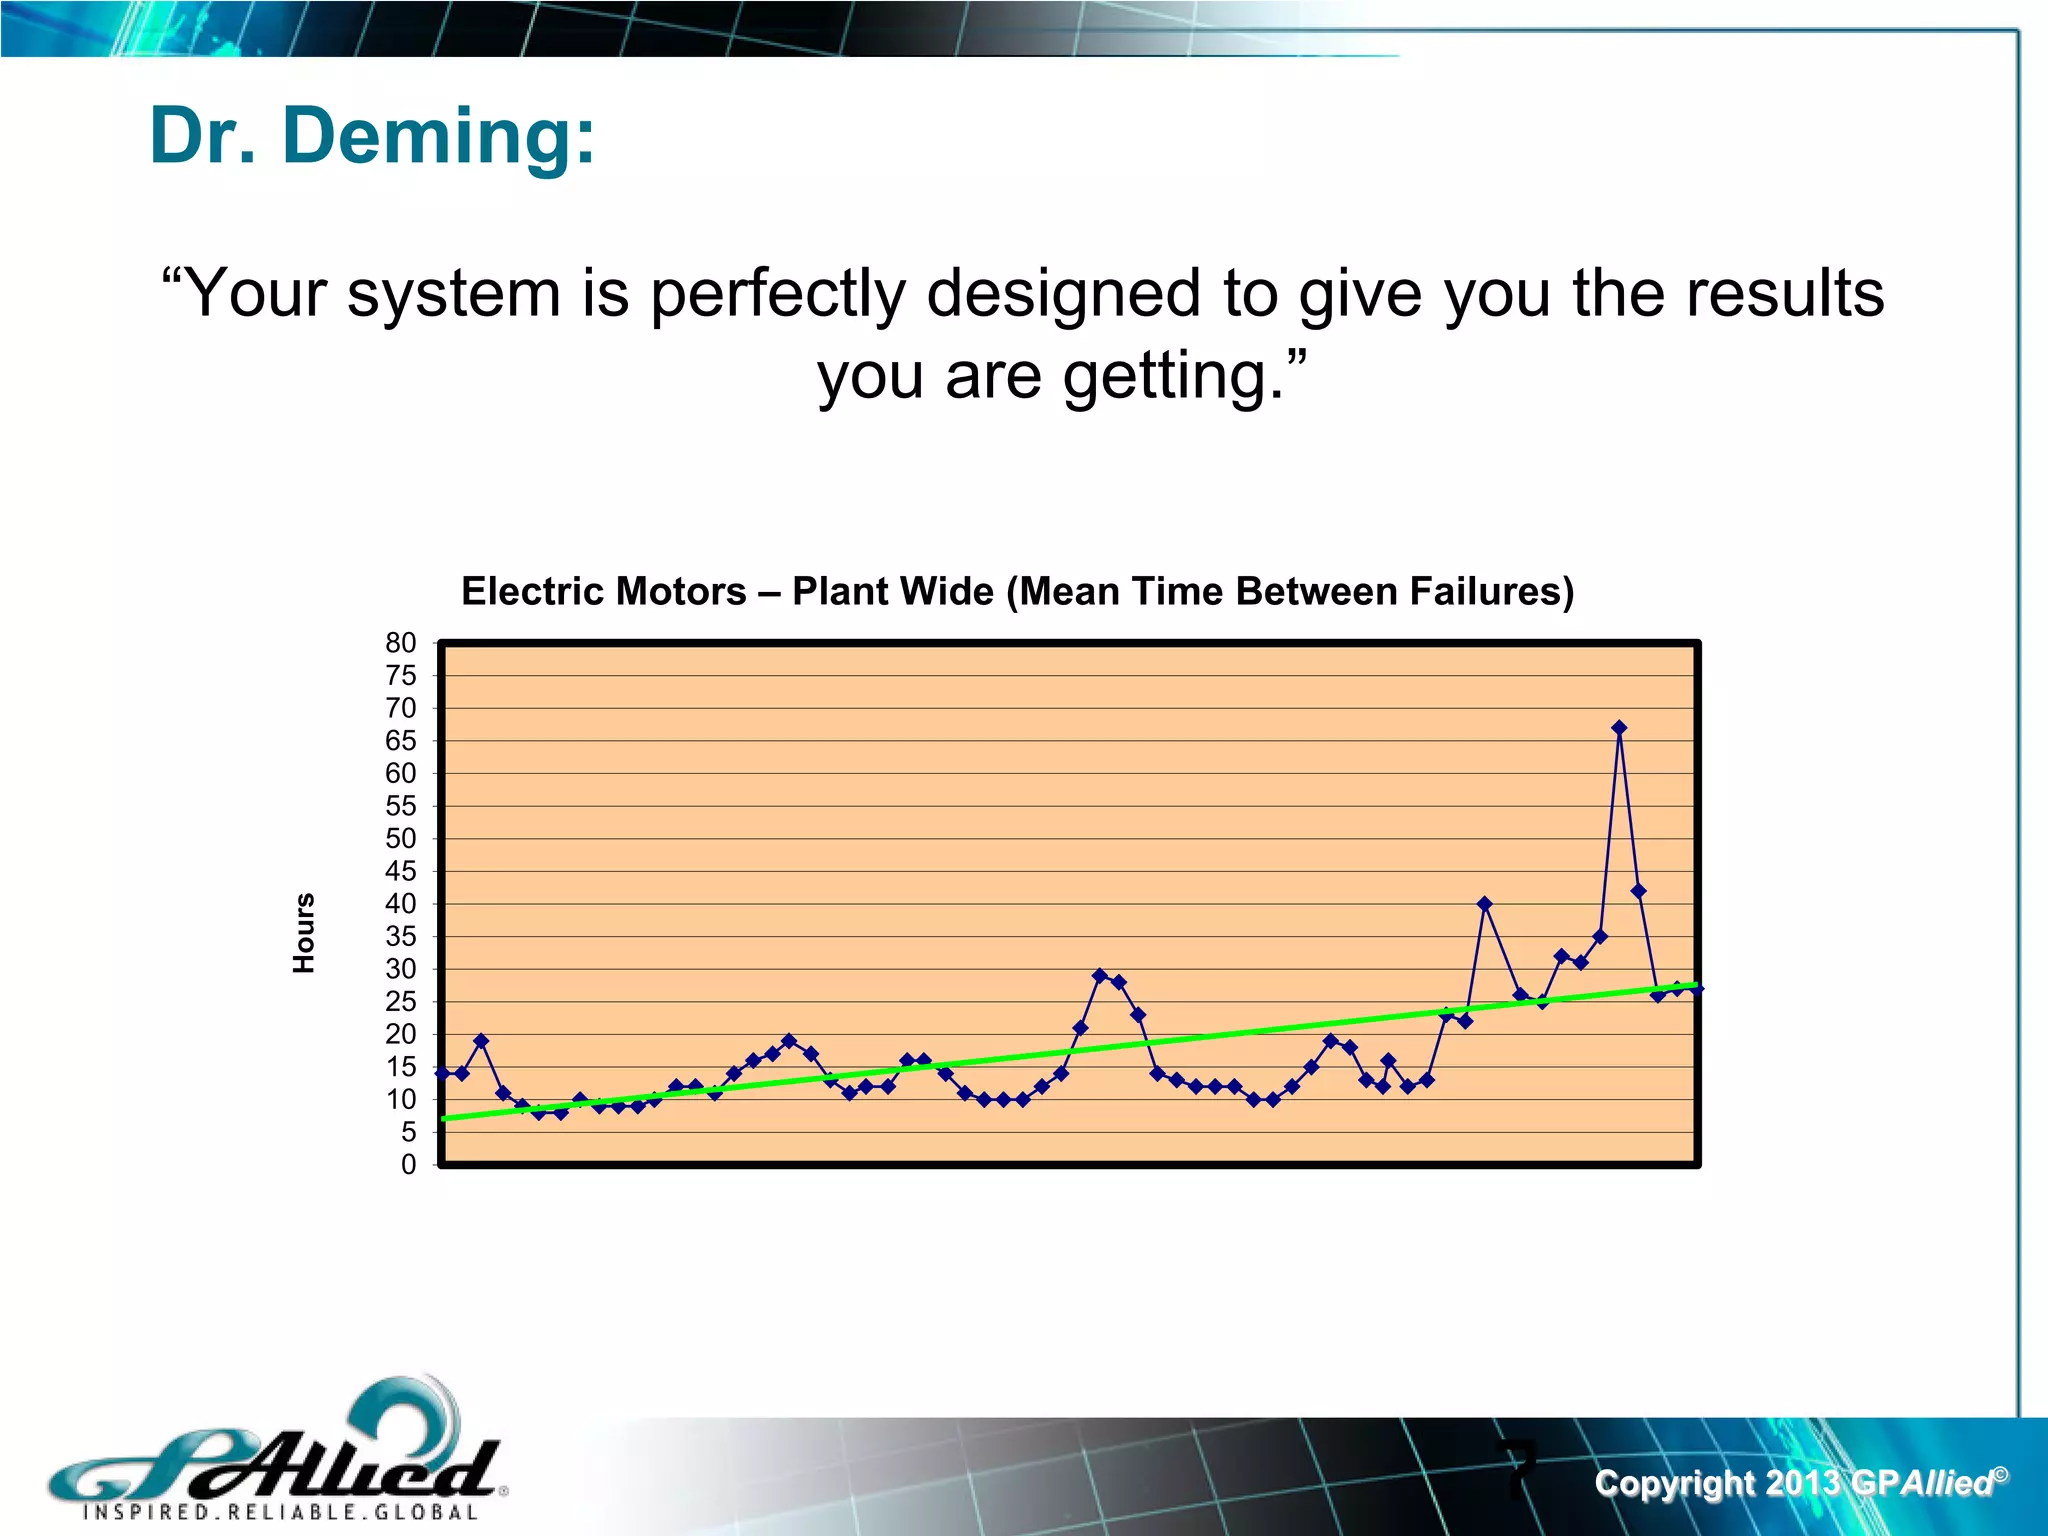
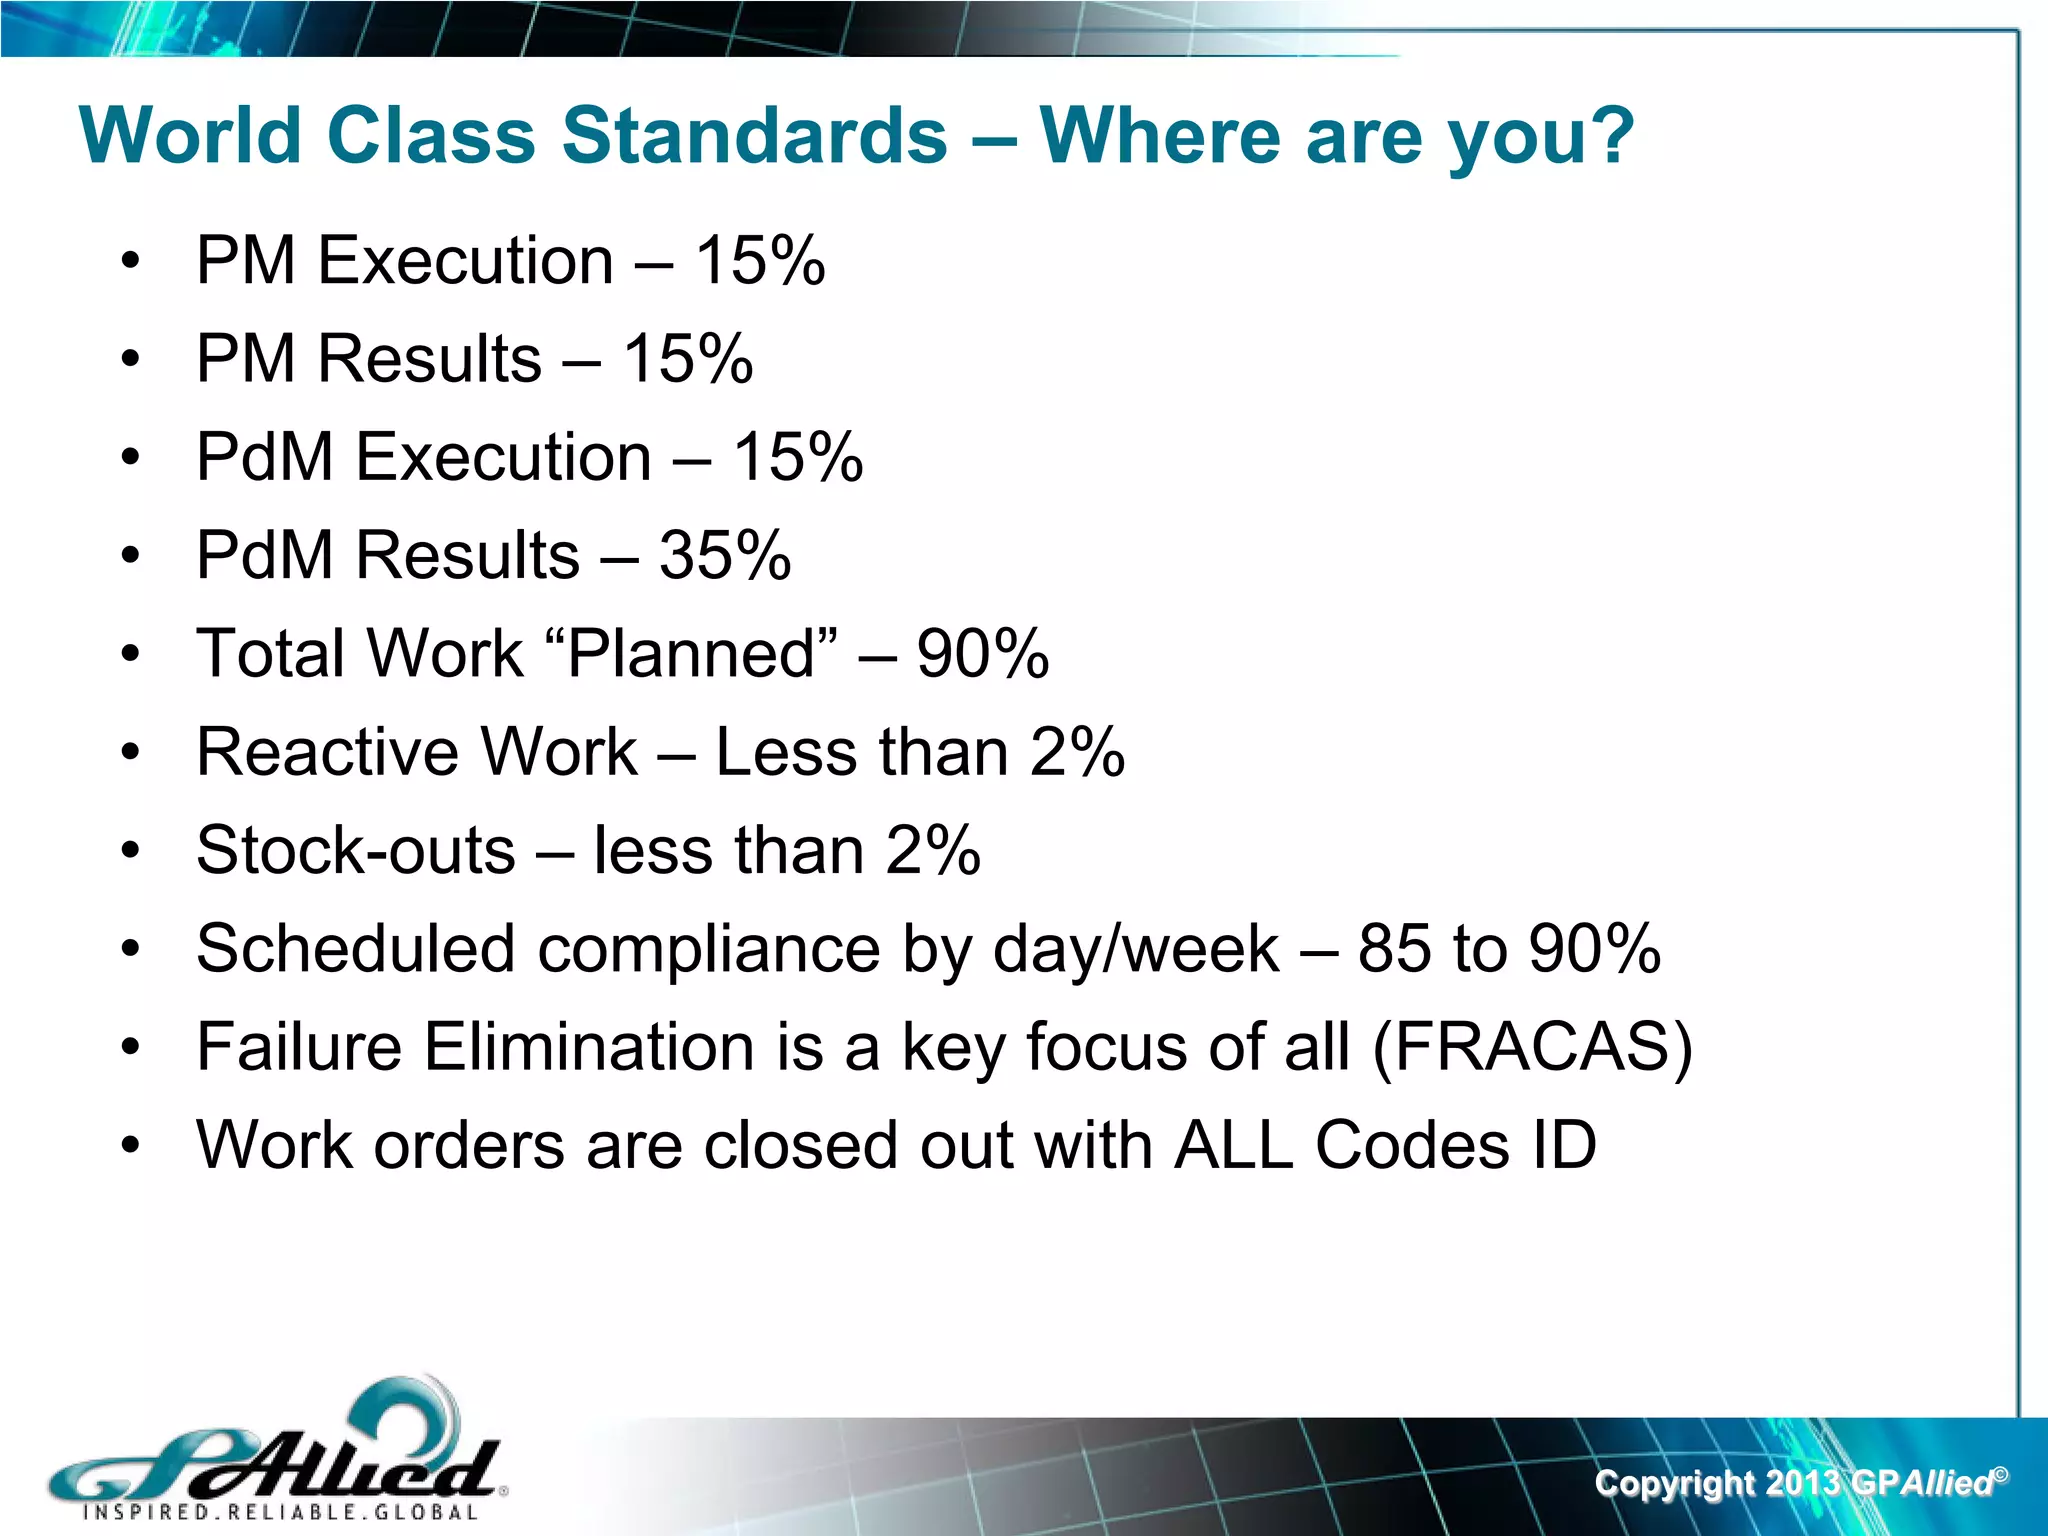
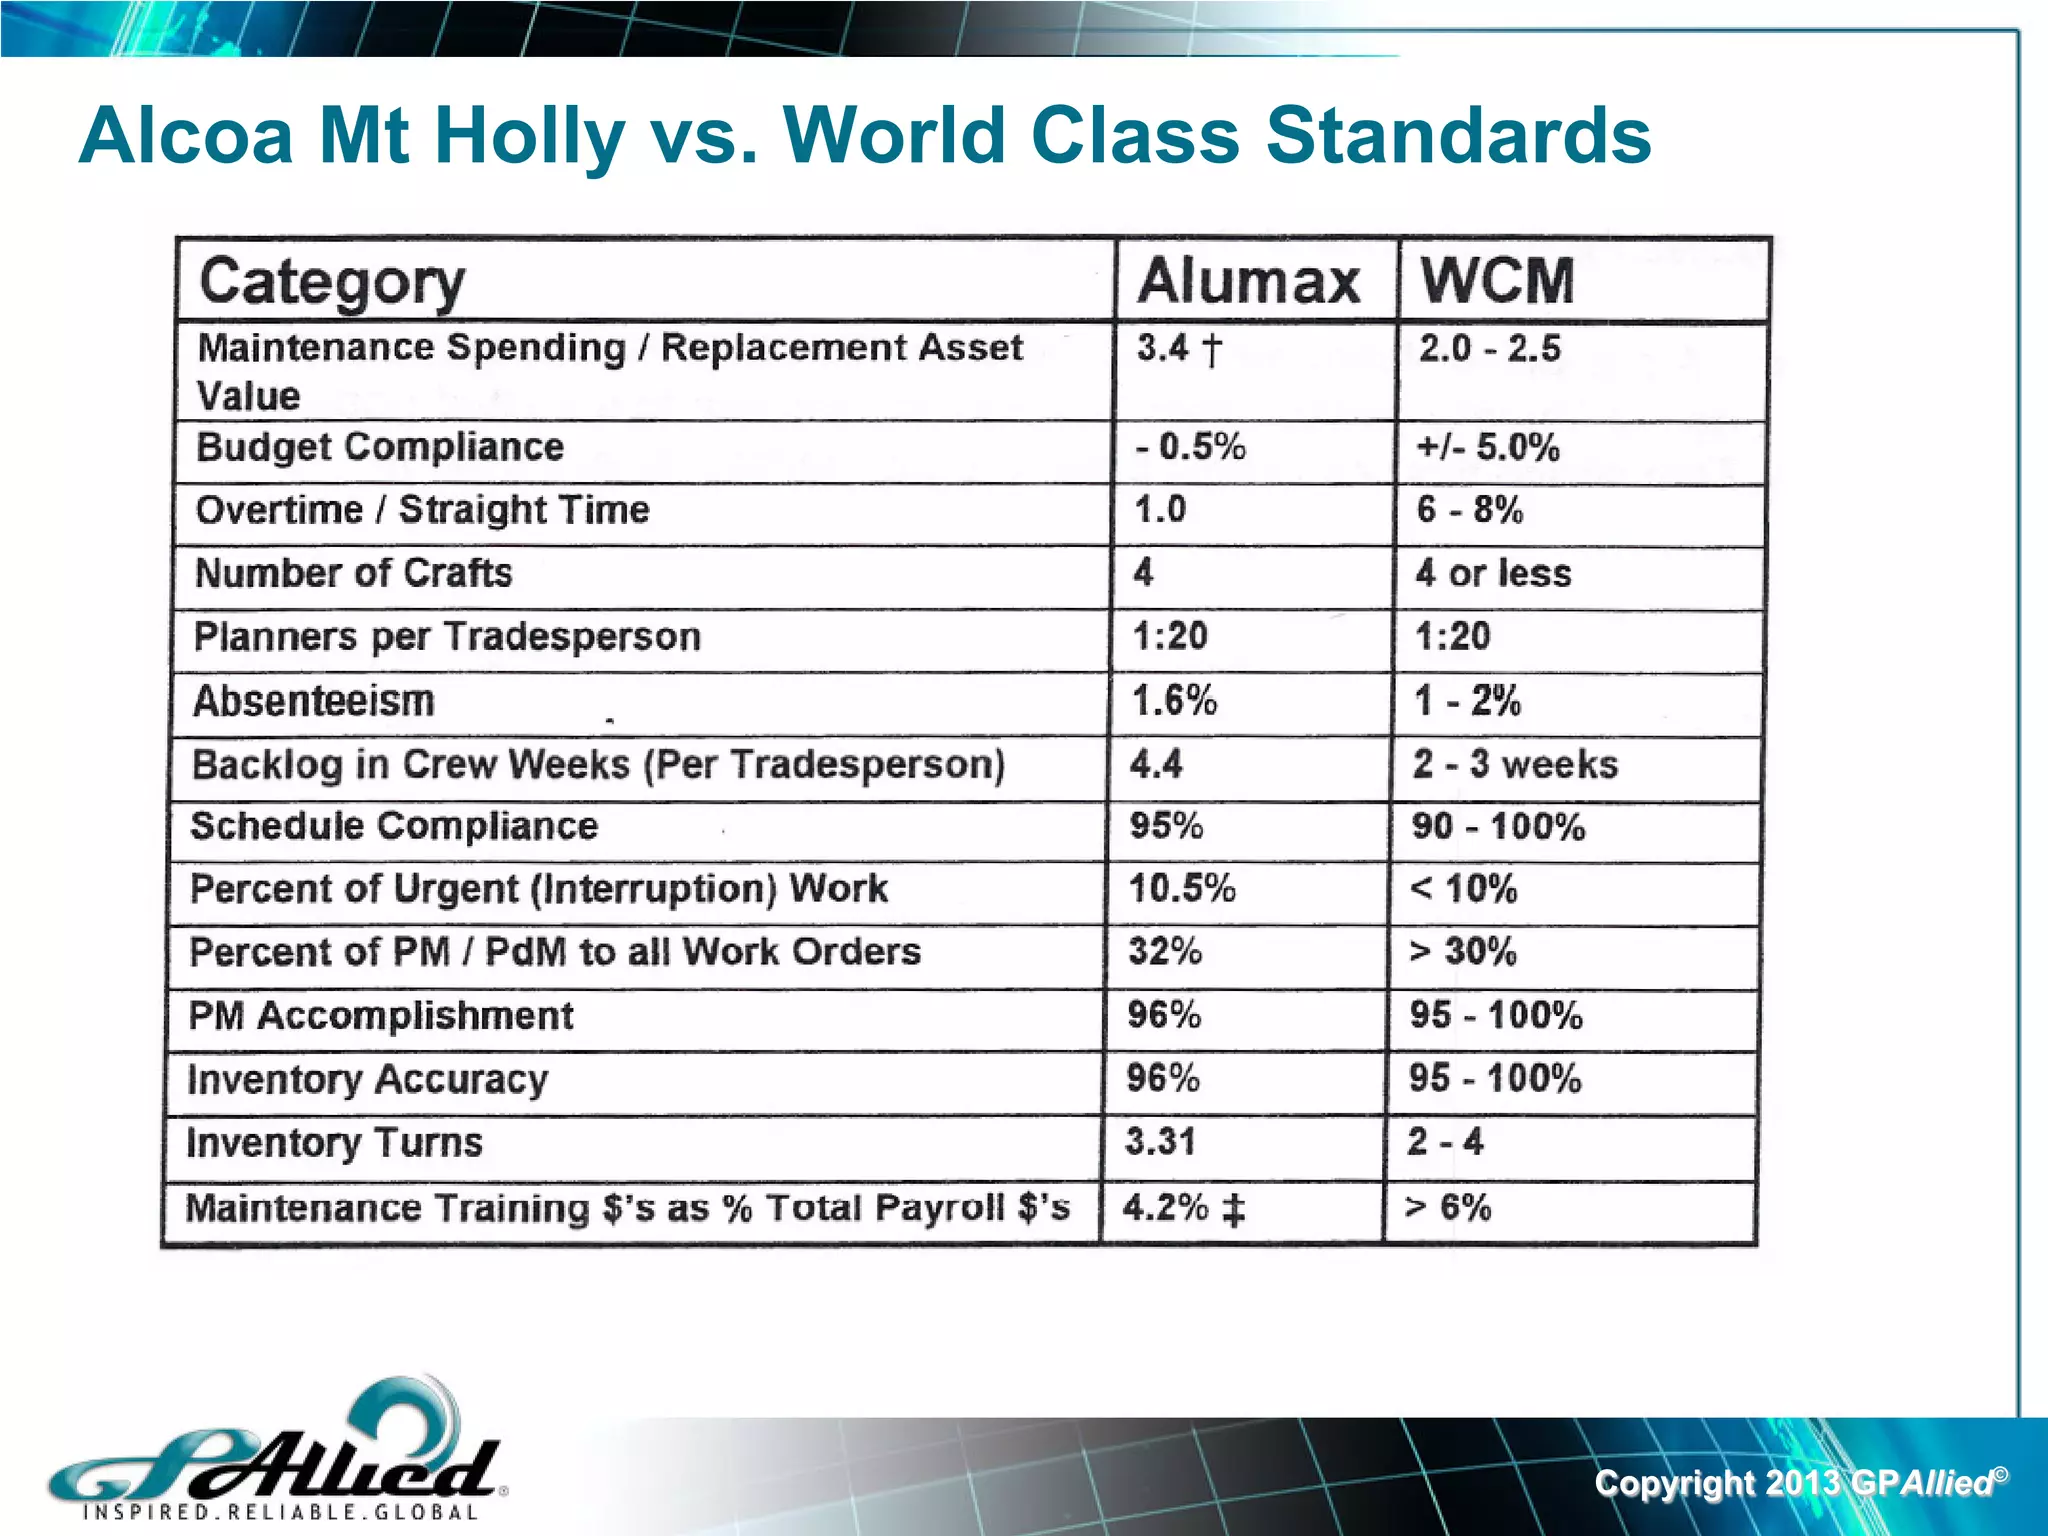
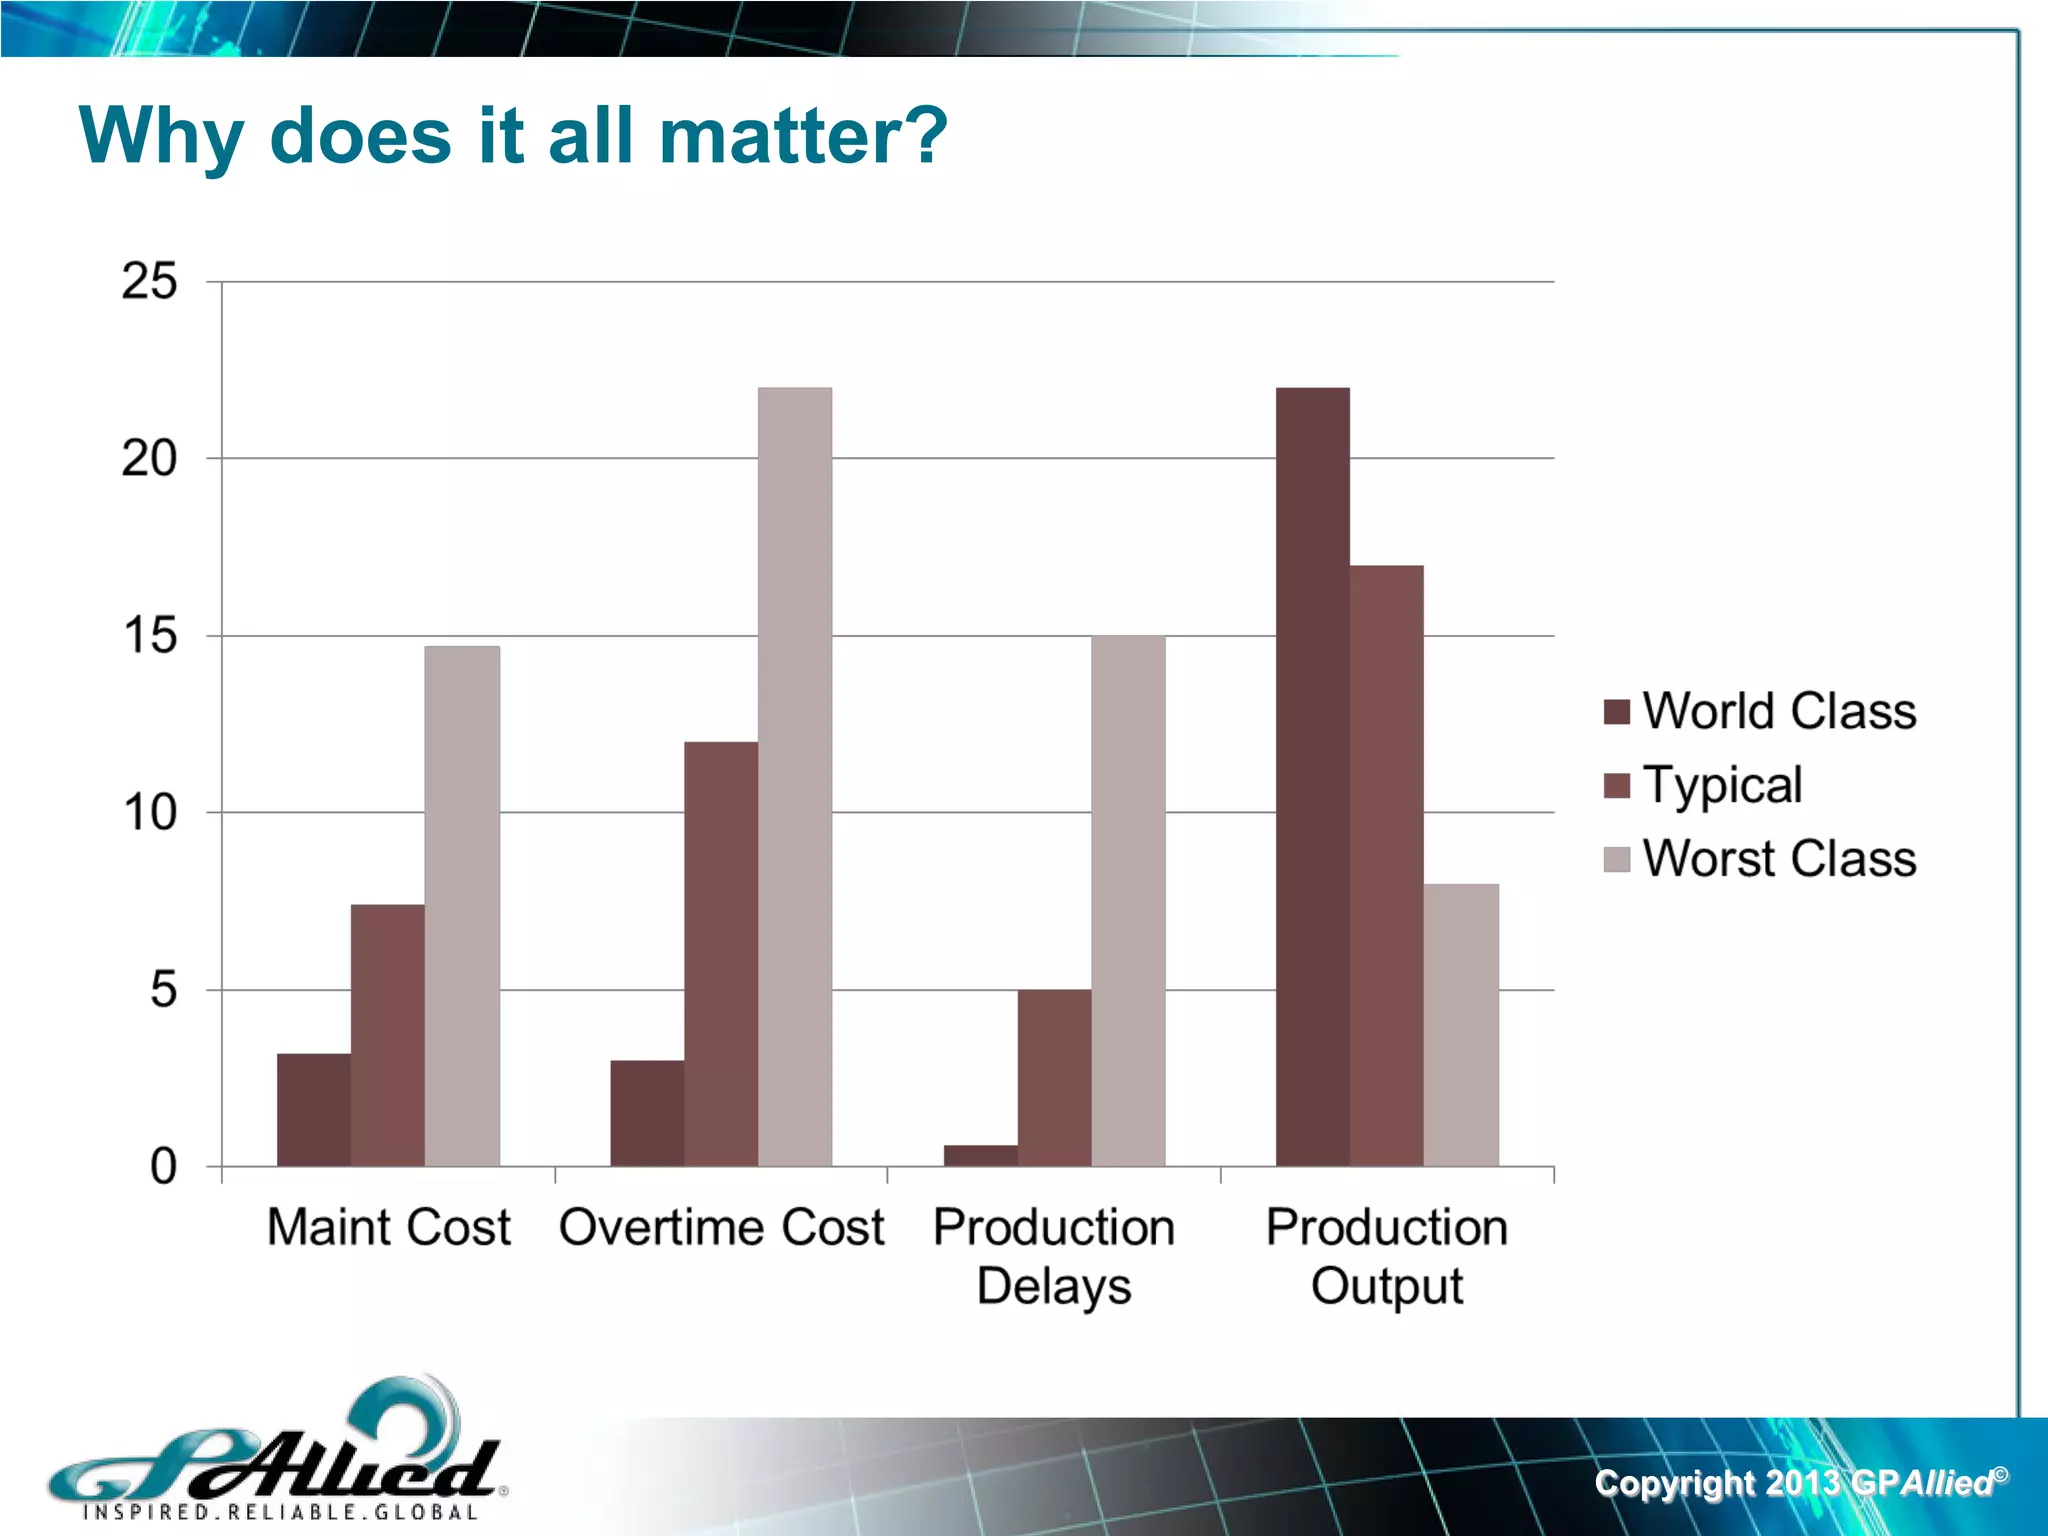
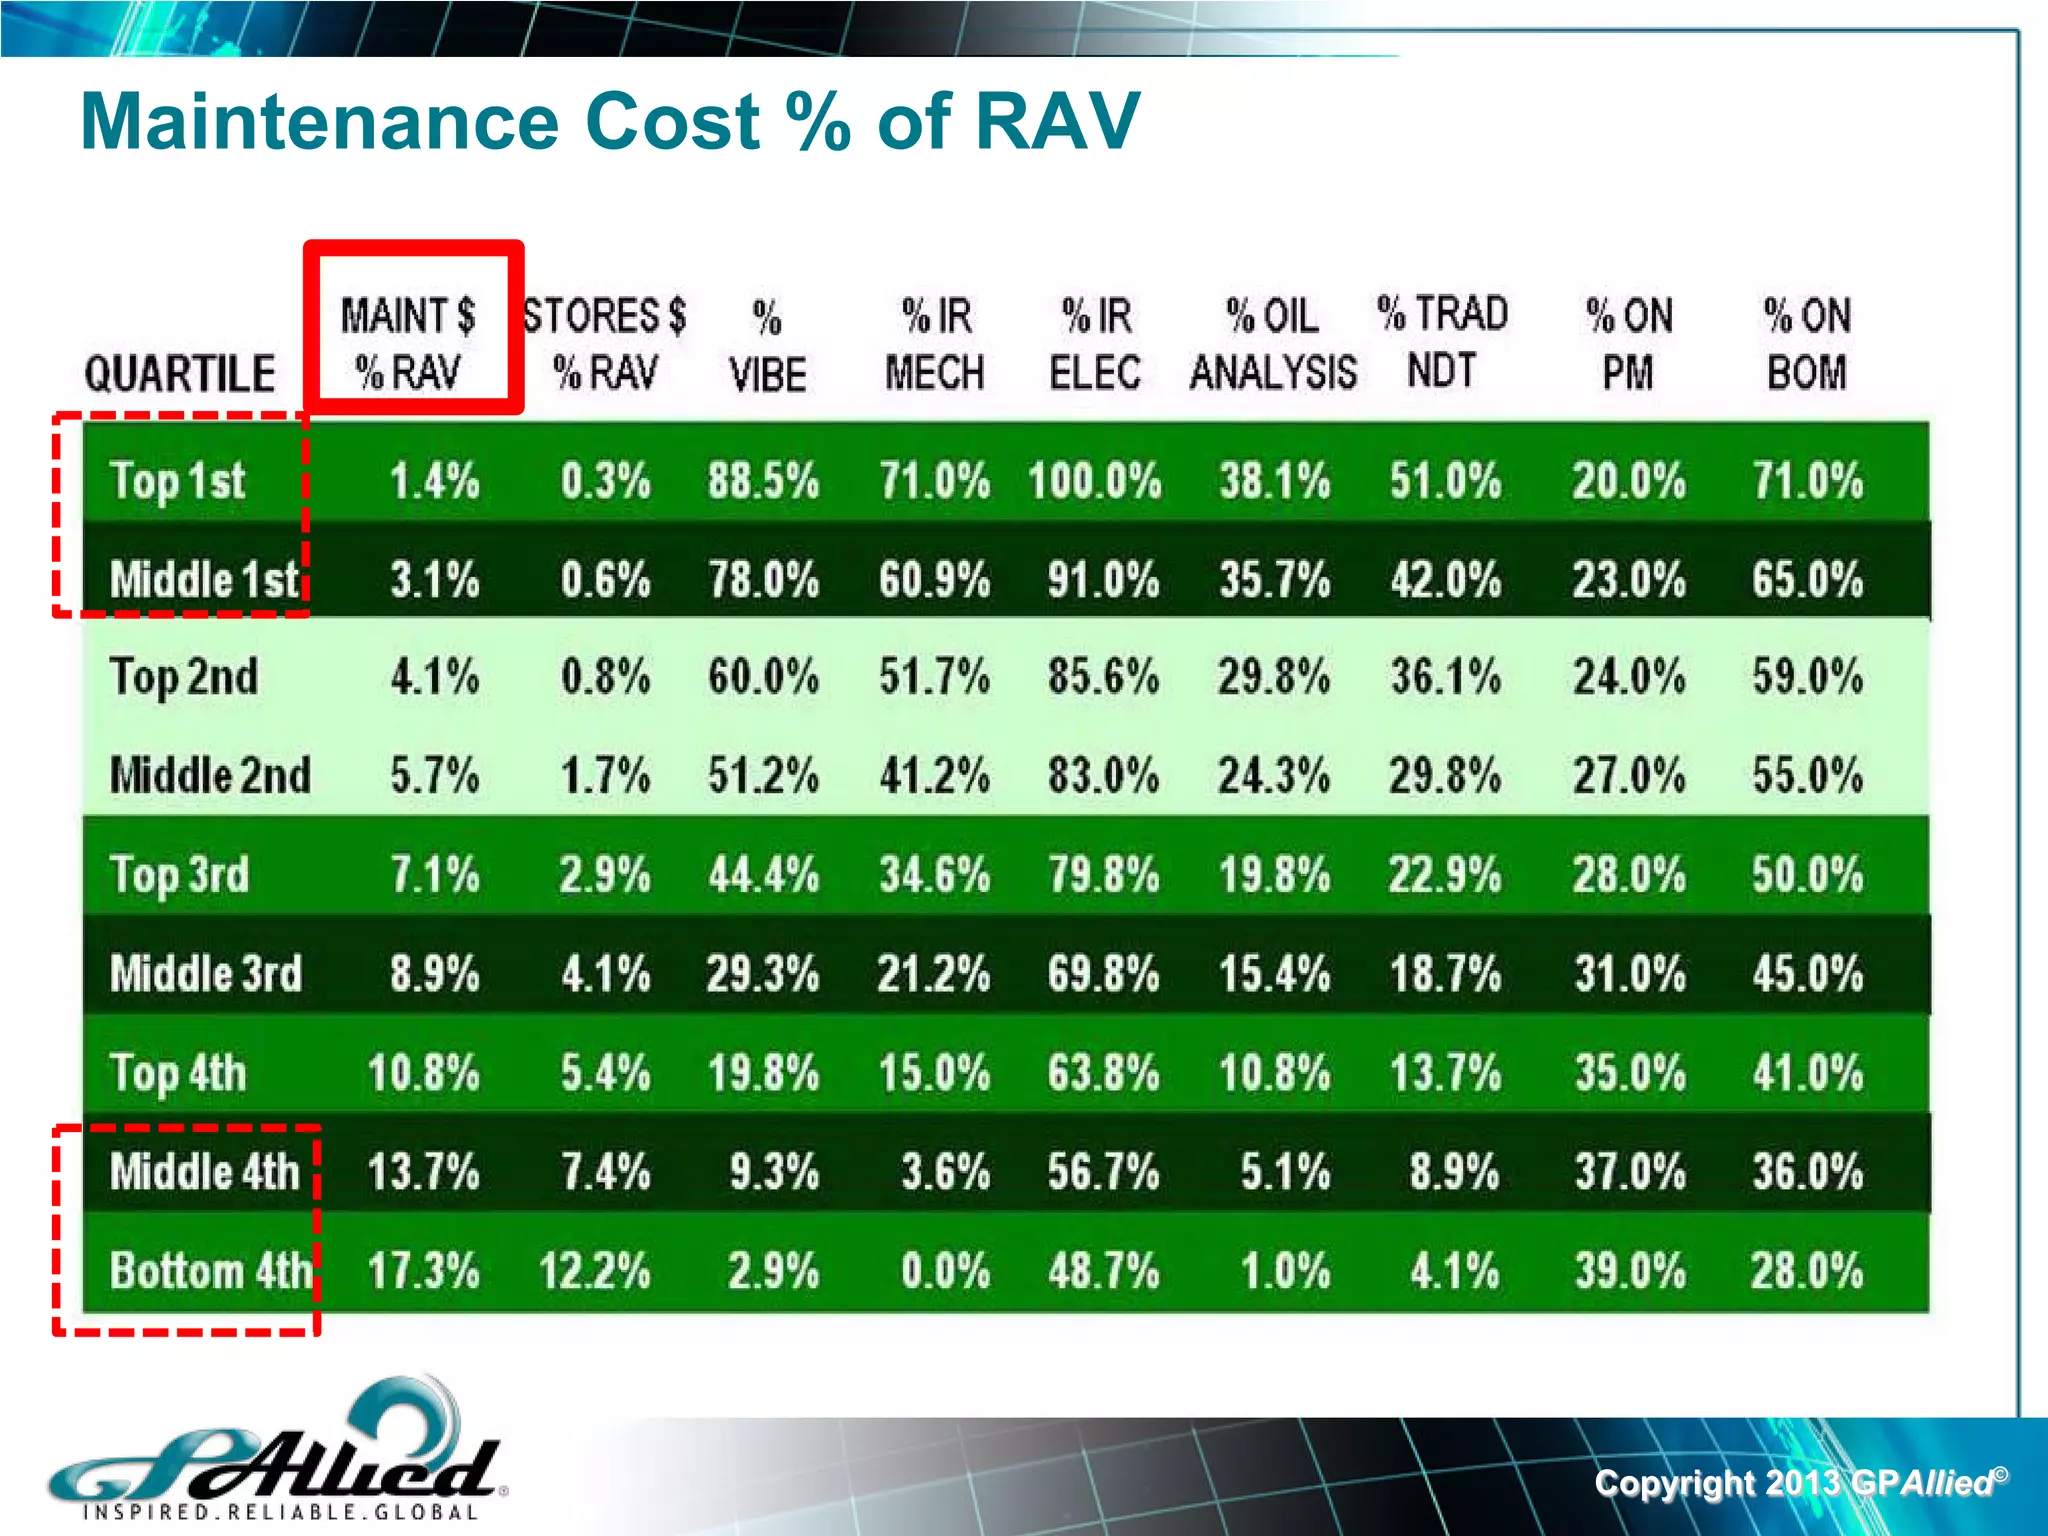
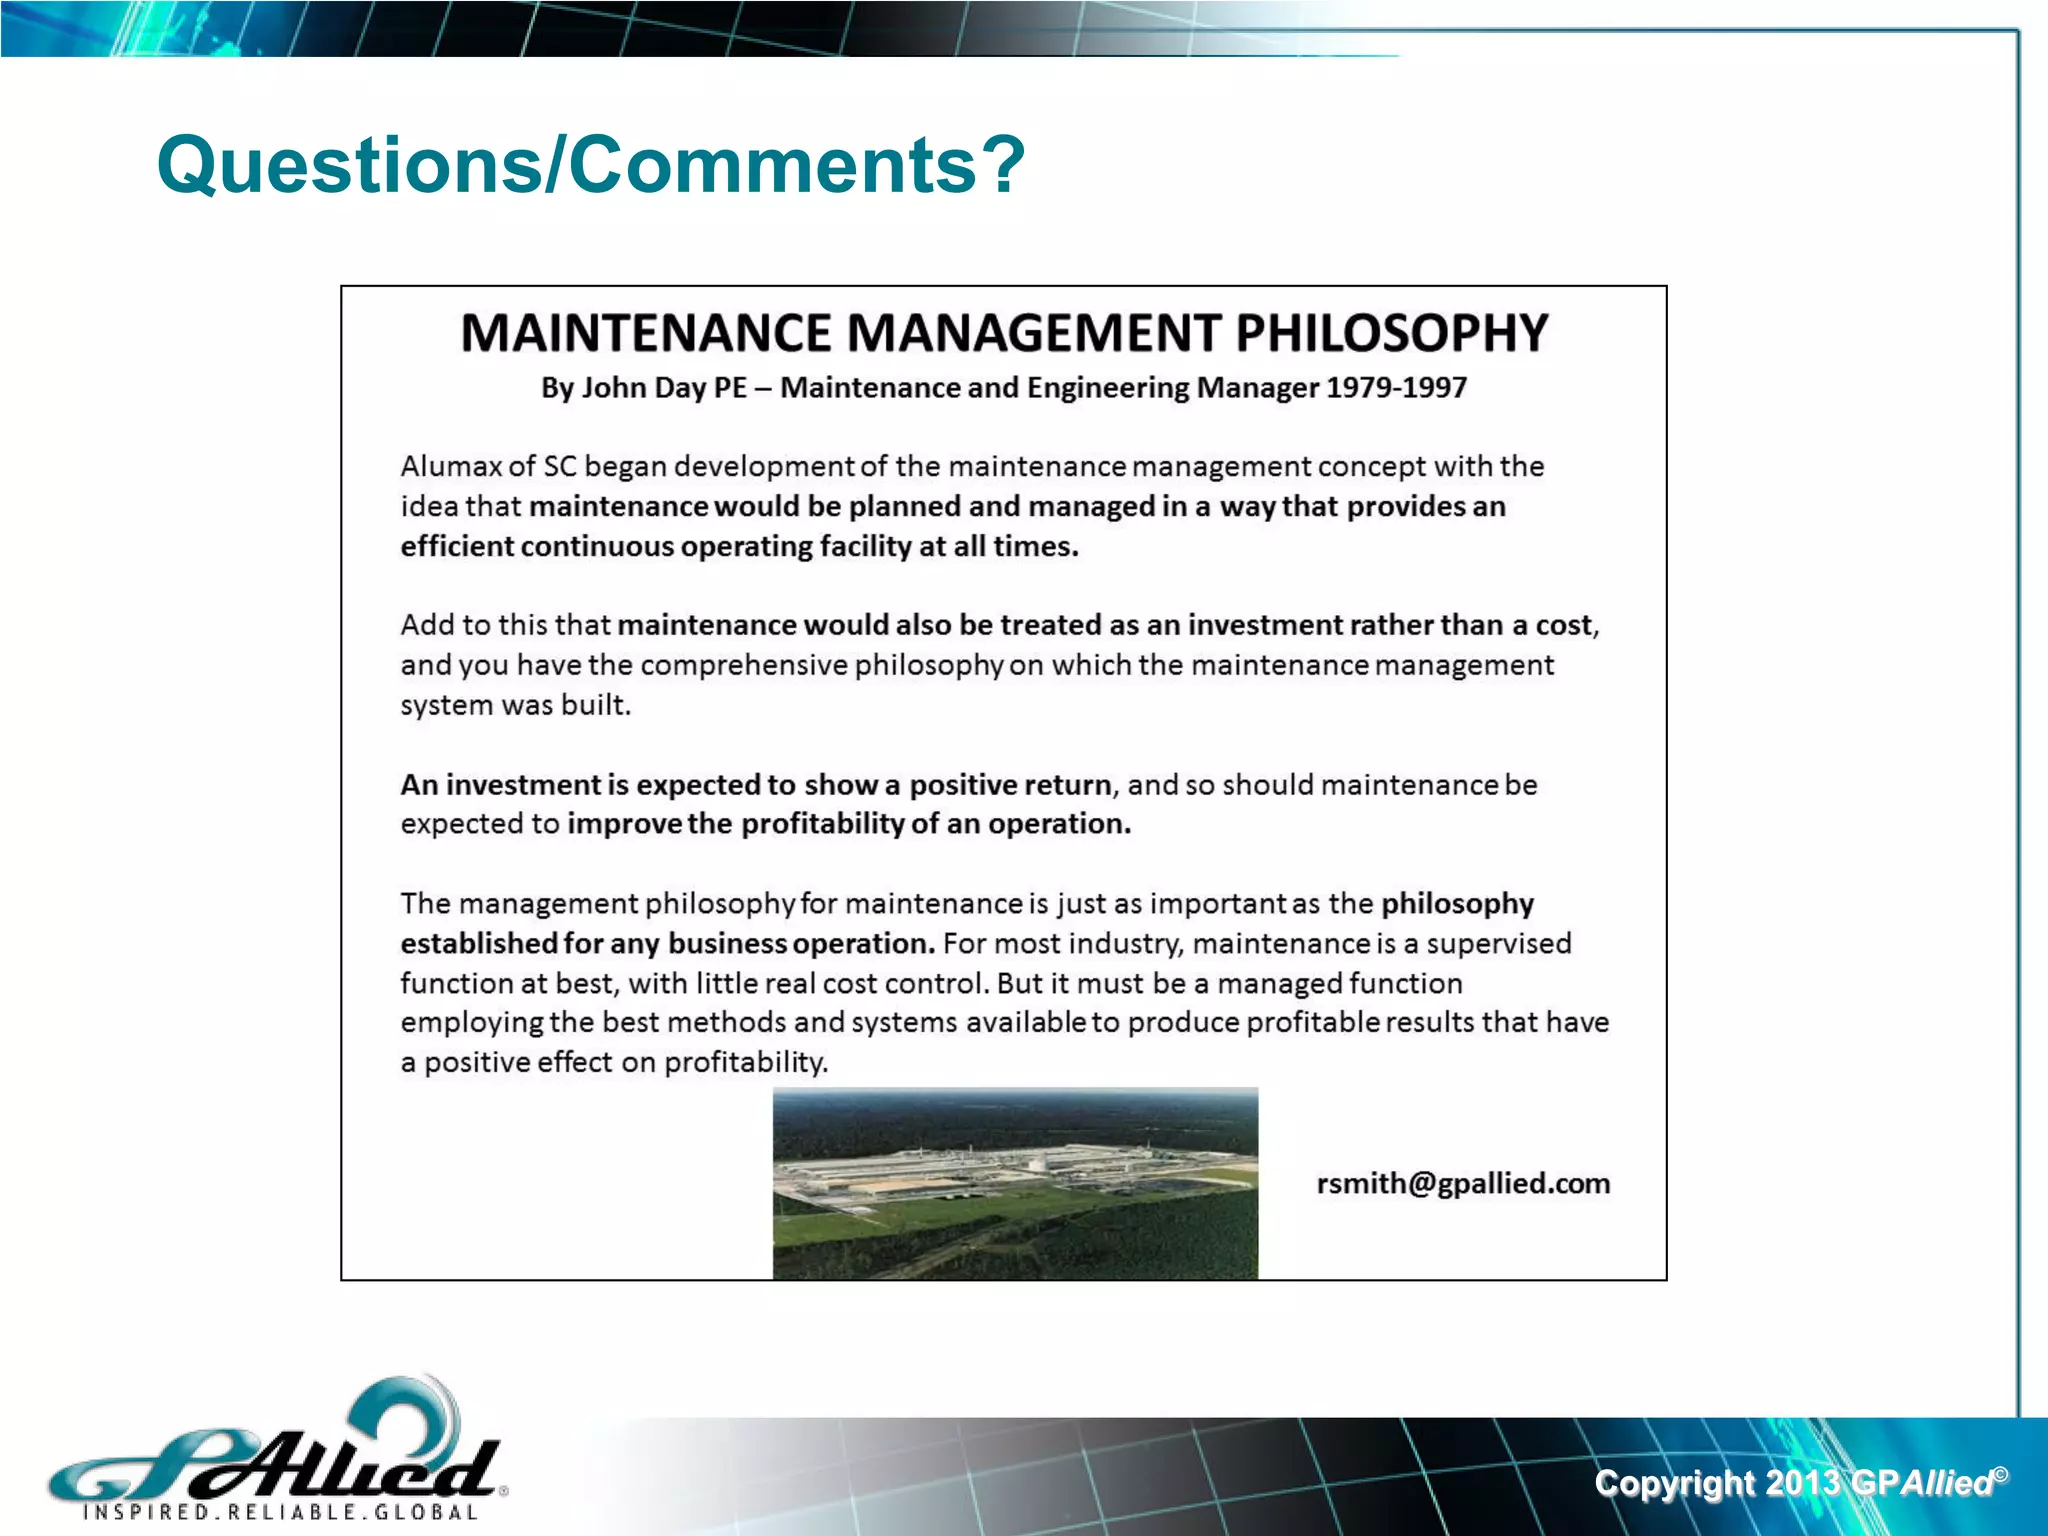

The document discusses optimized reliability processes in maintenance, emphasizing that skipping steps or poor performance can lead to defects known as failures. It highlights the importance of a proactive reliability approach, effective planning, and adherence to standards to minimize reactive maintenance and improve overall asset reliability and cost efficiency. Additionally, it presents comparisons between current maintenance practices and world-class standards, underscoring the role of systematic execution in achieving optimal results.


