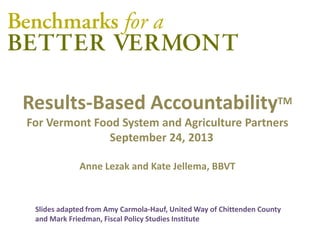
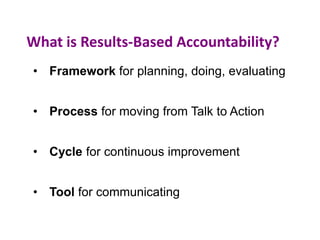
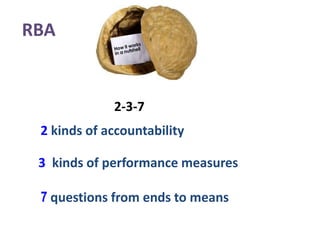
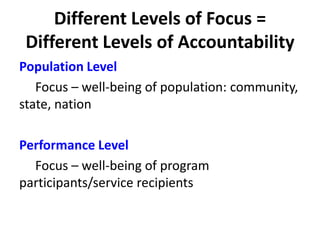
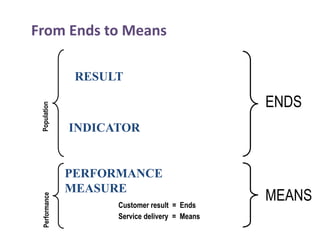
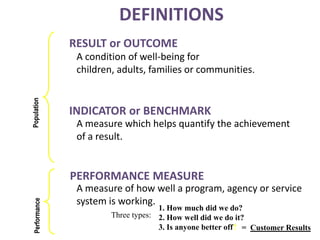
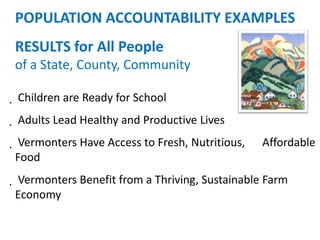
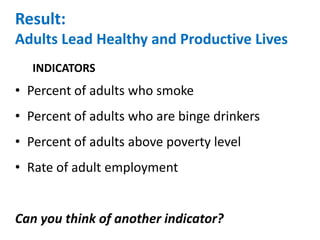
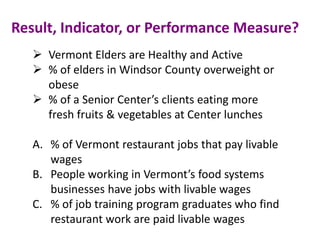
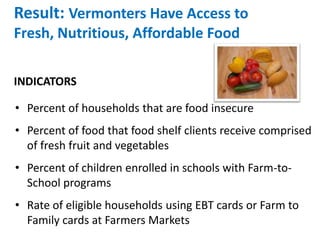
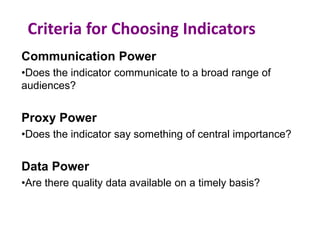
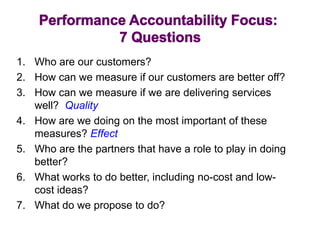
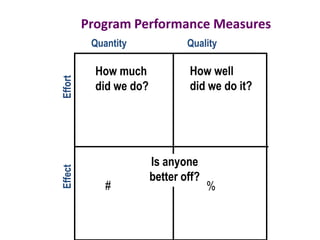
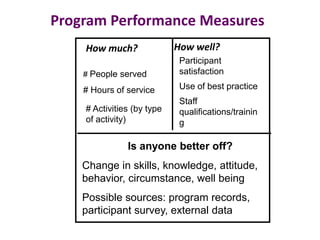
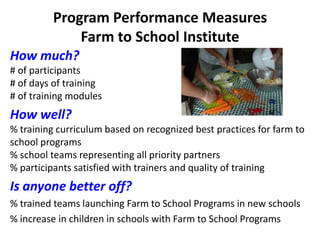
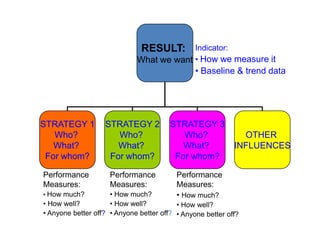
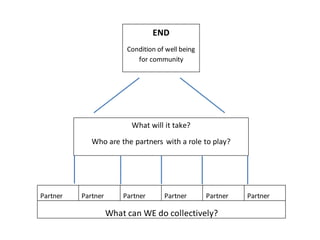
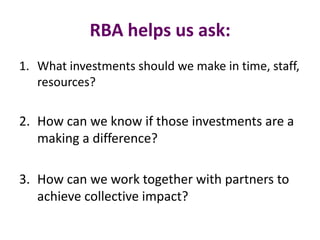
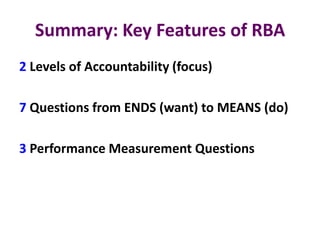
Results-Based AccountabilityTM
Featuring the Vermont Food System
September 24, 2013
Anne Lezak and Kate Jellema, BBVT
Slides adapted from Amy Carmola-Hauf, United Way of Chittenden County
and Mark Friedman, Fiscal Policy Studies Institute
1. Welcome! We’ll start at 2 pm.
2. One-way video and
sound
o Speaker volume
o Sound check
3. Two-way chat (typing)
o Practice typing your name and
organization in the chat box.
4. What if you lose the
connection?
o Try again
START RECORDING NOW
If it works, the recording will be posted to the
Common Good website.
Results-Based AccountabilityTM
For Vermont Food System and Agriculture Partners
September 24, 2013
Anne Lezak and Kate Jellema, BBVT
Slides adapted from Amy Carmola-Hauf, United Way of Chittenden County
and Mark Friedman, Fiscal Policy Studies Institute
Agenda for Today (2:00-3:30 pm)
• Tech Orientation
• Welcome!
• Results-Based Accountability in a Nutshell
• Next Steps
• Questions
Next Steps
• Full-day RBA training for food systems
sector participants:
RBA for VT Food Systems
Monday, Oct. 7, 9:00 – 4:00
VT Technical College, Randolph
For more info, visit: http://bit.ly/RBA4Food
• Customized training, Coaching and TA
Contact bbvt@marlboro.edu
What Do I Hope to Accomplish?
7
Provide basic understanding of and appreciation for RBA
 What is Results-Based Accountability?
 What are the two levels of accountability and why do they
matter?
 How can RBA help us better plan, communicate, and maximize
limited resources?
 How can RBA contribute to our increasing our effectiveness?
Pique your interest – RBA might be for us!
Kate will answer: Where do we learn more?
What is Results-Based Accountability?
8
• Framework for planning, doing, evaluating
• Process for moving from Talk to Action
• Cycle for continuous improvement
• Tool for communicating
“My question is: Are we making an impact?
3 kinds of performance measures
RBA
2 kinds of accountability
7 questions from ends to means
2-3-7
Different Levels of Focus =
Different Levels of Accountability
Population Level
Focus – well-being of population: community,
state, nation
Performance Level
Focus – well-being of program
participants/service recipients
From Ends to Means
ENDS
MEANS
PopulationPerformance
RESULT
INDICATOR
PERFORMANCE
MEASURE
Customer result = Ends
Service delivery = Means
DEFINITIONS
1. How much did we do?
2. How well did we do it?
3. Is anyone better off?
RESULT or OUTCOME
INDICATOR or BENCHMARK
PERFORMANCE MEASURE
A condition of well-being for
children, adults, families or communities.
A measure which helps quantify the achievement
of a result.
A measure of how well a program, agency or service
system is working.
Three types:
PopulationPerformancePopulationPerformance
= Customer Results
POPULATION ACCOUNTABILITY EXAMPLES
RESULTS for All People
of a State, County, Community
 Children are Ready for School
 Adults Lead Healthy and Productive Lives
 Vermonters Have Access to Fresh, Nutritious, Affordable
Food
 Vermonters Benefit from a Thriving, Sustainable Farm
Economy
Result:
Adults Lead Healthy and Productive Lives
• Percent of adults who smoke
• Percent of adults who are binge drinkers
• Percent of adults above poverty level
• Rate of adult employment
Can you think of another indicator?
INDICATORS
Result, Indicator, or Performance Measure?
 Vermont Elders are Healthy and Active
 % of elders in Windsor County overweight or
obese
 % of a Senior Center’s clients eating more
fresh fruits & vegetables at Center lunches
A. % of Vermont restaurant jobs that pay livable
wages
B. People working in Vermont’s food systems
businesses have jobs with livable wages
C. % of job training program graduates who find
restaurant work are paid livable wages
Result: Vermonters Have Access to
Fresh, Nutritious, Affordable Food
• Percent of households that are food insecure
• Percent of food that food shelf clients receive comprised
of fresh fruit and vegetables
• Percent of children enrolled in schools with Farm-to-
School programs
• Rate of eligible households using EBT cards or Farm to
Family cards at Farmers Markets
INDICATORS
Criteria for Choosing Indicators
Communication Power
•Does the indicator communicate to a broad range of
audiences?
Proxy Power
•Does the indicator say something of central importance?
Data Power
•Are there quality data available on a timely basis?
Population/Community Focus: 7 Questions
1. What are the quality of life conditions we want?
Vermonters have access to fresh, nutritious,
affordable food
2. How will we recognize it?
Children eat fresh, nutritious food in school lunches
3. How can we measure those conditions?
Percent of children in schools with Farm to School
programs
4. How are we doing now?
Baseline and story behind the baseline
Population/Community Focus:
7 Questions, Cont.
5. Who are the partners?
6. What works to do better?
Committed school team, training, mentoring, planning time and
resources, food preparation guidance, lesson plans, partnering
with farms and distribution networks
7. What do we propose to do?
Vermont Farm to School Institute- 10 schools, June, 2013
Overweight and Obese Vermonters
From Farm to Plate Strategic Plan (2013)
Food Insecurity and Very Low Food Security in Vermont Households
From Farm to Plate Strategic Plan (2013)
Performance Accountability
Focus - well being of program
participants/service recipients
1. Who are our customers?
2. How can we measure if our customers are better off?
3. How can we measure if we are delivering services
well? Quality
4. How are we doing on the most important of these
measures? Effect
5. Who are the partners that have a role to play in doing
better?
6. What works to do better, including no-cost and low-
cost ideas?
7. What do we propose to do?
How much
did we do?
Program Performance Measures
How well
did we do it?
Is anyone
better off?
Quantity Quality
EffectEffort
# %
Program Performance Measures
How well?
Is anyone better off?
# People served
# Hours of service
# Activities (by type
of activity)
Participant
satisfaction
Use of best practice
Staff
qualifications/trainin
g
Change in skills, knowledge, attitude,
behavior, circumstance, well being
Possible sources: program records,
participant survey, external data
How much?
Program Performance Measures
Farm to School Institute
How much?
# of participants
# of days of training
# of training modules
How well?
% training curriculum based on recognized best practices for farm to
school programs
% school teams representing all priority partners
% participants satisfied with trainers and quality of training
Is anyone better off?
% trained teams launching Farm to School Programs in new schools
% increase in children in schools with Farm to School Programs
RESULT:
What we want
STRATEGY 1
Who?
What?
For whom?
STRATEGY 2
Who?
What?
For whom?
STRATEGY 3
Who?
What?
For whom?
OTHER
INFLUENCES
Indicator:
• How we measure it
• Baseline & trend data
Performance
Measures:
• How much?
• How well?
• Anyone better off?
Performance
Measures:
• How much?
• How well?
• Anyone better off?
Performance
Measures:
• How much?
• How well?
• Anyone better off?
Partner Partner Partner Partner Partner Partner
What can WE do collectively?
END
Condition of well being
for community
What will it take?
Who are the partners with a role to play?
RBA helps us ask:
1. What investments should we make in time, staff,
resources?
2. How can we know if those investments are a
making a difference?
3. How can we work together with partners to
achieve collective impact?
Summary: Key Features of RBA
2 Levels of Accountability (focus)
7 Questions from ENDS (want) to MEANS (do)
3 Performance Measurement Questions
Acknowledgements & Resources
Fiscal Policy Studies Institute
www.resultsaccountability.com
www.raguide.org
Trying Hard Is Not Good Enough:
How to Produce Measurable Improvements for Customers
and Communities, Mark Friedman
Amy Carmola, Ph.D.
Director, Community Impact & Volunteer Mobilization
United Way of Chittenden County
For more information, see bbvt.marlboro.edu or contact
Anne Lezak at alezak@gradschool.marlboro.edu
Next Steps
• Full-day RBA training for food systems sector
participants:
RBA for VT Food Systems
Monday, Oct. 7, 9:00 – 4:00
VT Technical College, Randolph
For more info, visit: http://bit.ly/RBA4Food
• Customized training, Coaching and TA Contact
bbvt@marlboro.edu
• RBA Showcase on October 16 in Barre!
Contact bbvt@marlboro.edu
Your Questions?

Results Based Accountability for Food Sector

  • 1.
    Results-Based AccountabilityTM Featuring theVermont Food System September 24, 2013 Anne Lezak and Kate Jellema, BBVT Slides adapted from Amy Carmola-Hauf, United Way of Chittenden County and Mark Friedman, Fiscal Policy Studies Institute
  • 2.
    1. Welcome! We’llstart at 2 pm. 2. One-way video and sound o Speaker volume o Sound check 3. Two-way chat (typing) o Practice typing your name and organization in the chat box. 4. What if you lose the connection? o Try again
  • 3.
    START RECORDING NOW Ifit works, the recording will be posted to the Common Good website.
  • 4.
    Results-Based AccountabilityTM For VermontFood System and Agriculture Partners September 24, 2013 Anne Lezak and Kate Jellema, BBVT Slides adapted from Amy Carmola-Hauf, United Way of Chittenden County and Mark Friedman, Fiscal Policy Studies Institute
  • 5.
    Agenda for Today(2:00-3:30 pm) • Tech Orientation • Welcome! • Results-Based Accountability in a Nutshell • Next Steps • Questions
  • 6.
    Next Steps • Full-dayRBA training for food systems sector participants: RBA for VT Food Systems Monday, Oct. 7, 9:00 – 4:00 VT Technical College, Randolph For more info, visit: http://bit.ly/RBA4Food • Customized training, Coaching and TA Contact bbvt@marlboro.edu
  • 7.
    What Do IHope to Accomplish? 7 Provide basic understanding of and appreciation for RBA  What is Results-Based Accountability?  What are the two levels of accountability and why do they matter?  How can RBA help us better plan, communicate, and maximize limited resources?  How can RBA contribute to our increasing our effectiveness? Pique your interest – RBA might be for us! Kate will answer: Where do we learn more?
  • 8.
    What is Results-BasedAccountability? 8 • Framework for planning, doing, evaluating • Process for moving from Talk to Action • Cycle for continuous improvement • Tool for communicating
  • 9.
    “My question is:Are we making an impact?
  • 10.
    3 kinds ofperformance measures RBA 2 kinds of accountability 7 questions from ends to means 2-3-7
  • 11.
    Different Levels ofFocus = Different Levels of Accountability Population Level Focus – well-being of population: community, state, nation Performance Level Focus – well-being of program participants/service recipients
  • 12.
    From Ends toMeans ENDS MEANS PopulationPerformance RESULT INDICATOR PERFORMANCE MEASURE Customer result = Ends Service delivery = Means
  • 13.
    DEFINITIONS 1. How muchdid we do? 2. How well did we do it? 3. Is anyone better off? RESULT or OUTCOME INDICATOR or BENCHMARK PERFORMANCE MEASURE A condition of well-being for children, adults, families or communities. A measure which helps quantify the achievement of a result. A measure of how well a program, agency or service system is working. Three types: PopulationPerformancePopulationPerformance = Customer Results
  • 14.
    POPULATION ACCOUNTABILITY EXAMPLES RESULTSfor All People of a State, County, Community  Children are Ready for School  Adults Lead Healthy and Productive Lives  Vermonters Have Access to Fresh, Nutritious, Affordable Food  Vermonters Benefit from a Thriving, Sustainable Farm Economy
  • 15.
    Result: Adults Lead Healthyand Productive Lives • Percent of adults who smoke • Percent of adults who are binge drinkers • Percent of adults above poverty level • Rate of adult employment Can you think of another indicator? INDICATORS
  • 16.
    Result, Indicator, orPerformance Measure?  Vermont Elders are Healthy and Active  % of elders in Windsor County overweight or obese  % of a Senior Center’s clients eating more fresh fruits & vegetables at Center lunches A. % of Vermont restaurant jobs that pay livable wages B. People working in Vermont’s food systems businesses have jobs with livable wages C. % of job training program graduates who find restaurant work are paid livable wages
  • 17.
    Result: Vermonters HaveAccess to Fresh, Nutritious, Affordable Food • Percent of households that are food insecure • Percent of food that food shelf clients receive comprised of fresh fruit and vegetables • Percent of children enrolled in schools with Farm-to- School programs • Rate of eligible households using EBT cards or Farm to Family cards at Farmers Markets INDICATORS
  • 18.
    Criteria for ChoosingIndicators Communication Power •Does the indicator communicate to a broad range of audiences? Proxy Power •Does the indicator say something of central importance? Data Power •Are there quality data available on a timely basis?
  • 19.
    Population/Community Focus: 7Questions 1. What are the quality of life conditions we want? Vermonters have access to fresh, nutritious, affordable food 2. How will we recognize it? Children eat fresh, nutritious food in school lunches 3. How can we measure those conditions? Percent of children in schools with Farm to School programs 4. How are we doing now? Baseline and story behind the baseline
  • 20.
    Population/Community Focus: 7 Questions,Cont. 5. Who are the partners? 6. What works to do better? Committed school team, training, mentoring, planning time and resources, food preparation guidance, lesson plans, partnering with farms and distribution networks 7. What do we propose to do? Vermont Farm to School Institute- 10 schools, June, 2013
  • 21.
    Overweight and ObeseVermonters From Farm to Plate Strategic Plan (2013)
  • 22.
    Food Insecurity andVery Low Food Security in Vermont Households From Farm to Plate Strategic Plan (2013)
  • 23.
    Performance Accountability Focus -well being of program participants/service recipients
  • 24.
    1. Who areour customers? 2. How can we measure if our customers are better off? 3. How can we measure if we are delivering services well? Quality 4. How are we doing on the most important of these measures? Effect 5. Who are the partners that have a role to play in doing better? 6. What works to do better, including no-cost and low- cost ideas? 7. What do we propose to do?
  • 25.
    How much did wedo? Program Performance Measures How well did we do it? Is anyone better off? Quantity Quality EffectEffort # %
  • 26.
    Program Performance Measures Howwell? Is anyone better off? # People served # Hours of service # Activities (by type of activity) Participant satisfaction Use of best practice Staff qualifications/trainin g Change in skills, knowledge, attitude, behavior, circumstance, well being Possible sources: program records, participant survey, external data How much?
  • 27.
    Program Performance Measures Farmto School Institute How much? # of participants # of days of training # of training modules How well? % training curriculum based on recognized best practices for farm to school programs % school teams representing all priority partners % participants satisfied with trainers and quality of training Is anyone better off? % trained teams launching Farm to School Programs in new schools % increase in children in schools with Farm to School Programs
  • 28.
    RESULT: What we want STRATEGY1 Who? What? For whom? STRATEGY 2 Who? What? For whom? STRATEGY 3 Who? What? For whom? OTHER INFLUENCES Indicator: • How we measure it • Baseline & trend data Performance Measures: • How much? • How well? • Anyone better off? Performance Measures: • How much? • How well? • Anyone better off? Performance Measures: • How much? • How well? • Anyone better off?
  • 29.
    Partner Partner PartnerPartner Partner Partner What can WE do collectively? END Condition of well being for community What will it take? Who are the partners with a role to play?
  • 30.
    RBA helps usask: 1. What investments should we make in time, staff, resources? 2. How can we know if those investments are a making a difference? 3. How can we work together with partners to achieve collective impact?
  • 31.
    Summary: Key Featuresof RBA 2 Levels of Accountability (focus) 7 Questions from ENDS (want) to MEANS (do) 3 Performance Measurement Questions
  • 32.
    Acknowledgements & Resources FiscalPolicy Studies Institute www.resultsaccountability.com www.raguide.org Trying Hard Is Not Good Enough: How to Produce Measurable Improvements for Customers and Communities, Mark Friedman Amy Carmola, Ph.D. Director, Community Impact & Volunteer Mobilization United Way of Chittenden County For more information, see bbvt.marlboro.edu or contact Anne Lezak at alezak@gradschool.marlboro.edu
  • 33.
    Next Steps • Full-dayRBA training for food systems sector participants: RBA for VT Food Systems Monday, Oct. 7, 9:00 – 4:00 VT Technical College, Randolph For more info, visit: http://bit.ly/RBA4Food • Customized training, Coaching and TA Contact bbvt@marlboro.edu • RBA Showcase on October 16 in Barre! Contact bbvt@marlboro.edu
  • 34.

Editor's Notes

  • #20 This isn’t the ONLY way, but we’ve found it to be the best way for these reasons. Goal = common approach among all of us, and this does that VERY well. So that’s why we’re talking about RBA. (not because I work for RBA)Starting point with this work = ENDS (we need a common approach) and RBA = MEANS.ENDS first, then MEANS – emphasize this more, we talk about what we DO or our inputs, but it’s really about the ENDS, we should always start there! (And that’s the conversation boards, staff, RD people need to be having always, starting with ENDS)