Downloaded 34 times
![Co-Presenters Karen Finn Senior Consultant karen@resultsleadership.org www. resultsleadership.org Katherine Mowers Senior Consultant [email_address] www.citidc.com Simplifying and Maximizing Organizational Impact Data](https://image.slidesharecdn.com/simplifyingandmaximizingorgimpactdata2011final-110511061733-phpapp02/85/Performance-Management-for-Nonprofits-Simplifying-and-Maximizing-Organization-Impact-Data-1-320.jpg)


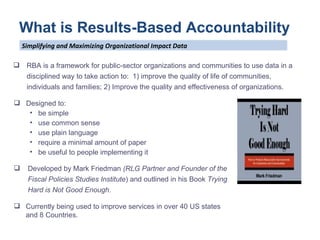


The document outlines a data session aimed at improving organizational impact through the Results-Based Accountability (RBA) framework, which emphasizes the use of data to enhance community and organizational outcomes. It discusses key principles and processes related to performance measures for both populations and programs, advocating for data-driven decision-making to assess service effectiveness. Additionally, it covers the importance of proper data management systems and software selection to support organizational objectives.