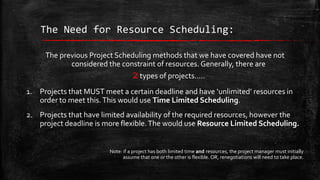
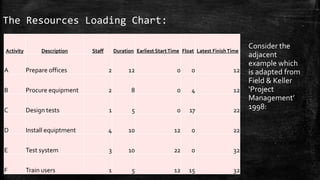
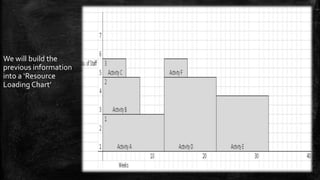
Resource Scheduling
The Need for Resource Scheduling:
The previous Project Scheduling methods that we have covered have not
considered the constraint of resources. Generally, there are
2 types of projects…..
1. Projects that MUST meet a certain deadline and have ‘unlimited’ resources in
order to meet this. This would use Time Limited Scheduling.
2. Projects that have limited availability of the required resources, however the
project deadline is more flexible. The would use Resource Limited Scheduling.

Note: if a project has both limited time and resources, the project manager must initially
assume that one or the other is flexible. OR, renegotiations will need to take place.
Time Limited Scheduling
Objectives:
▪ Determine exactly what resources the project requires;
▪ Make these resources available for when they are needed;
▪ Use each resource as efficiently as possible
– Resource Smoothing: this defines the act of maximising resources efficiency. Despite having
‘umlimited’ resorurces, it is still necessary to try to keep costs down as much as possible.
The Resources Loading Chart:
Activity

Description

Staff

Duration Earliest Start Time Float Latest Finish Time

A

Prepare offices

2

12

0

0

12

B

Procure equipment

2

8

0

4

12

C

Design tests

1

5

0

17

22

D

Install equiptment

4

10

12

0

22

E

Test system

3

10

22

0

32

F

Train users

1

5

12

15

32

Consider the
adjacent
example which
is adapted from
Field & Keller
‘Project
Management’
1998:
We will build the
previous information
into a ‘Resource
Loading Chart’
Observations:
▪ From the previous slide’s graph we can immediately tell how many
staff are needed at any one time.
▪ For example – in week 10, we can identify that only 2 staff members
are required. Whereas in week 14 there are 5 staff members required.

▪ The method of creating this chart, by positioning one activity at a
time, is called Serial Scheduling.
Note: The bottom row of the graph could also be described as the ‘critical
path’. Each of these items as Float=0. This row can be described as the
Base Line.
Resource Levelling:
▪ As identified in the previous slides, our chart contains
‘extreme peaks’. For example, weeks 1-5.
▪ Resource levelling helps to avoid this.
▪ As we have several activities which contain float, we can try
to move these activities to ‘level’ out the staff distribution:
Obviously this still
isn’t ideal as we still
have a ‘peak’ during
week 13. However we
have levelled s much
as possible, and in
turn we have reduced
costs.
Resource Limited Scheduling
Objectives:
▪ To adjust the project’s time to adapt to fixed level of
resources.
▪ In the previous example, we realised it would take 5 staff to
create the office in 32 weeks.

▪ Now, let’s consider how long it would take if the staff level
were fixed at 4.
Parallel Scheduling:
▪ Definition: Starting at the beginning of a project and
considering all the eligible activities, in a parallel manner.
▪ An eligible activity would be one which could be started if
the resources were available.
Let’s re-consider the example….
Activity

Dependency

Staff

Duration

Latest Start
Time

Float Latest Finish Time

A

N/A

2

12

0

0

12

B

N/A

2

8

4

4

12

C

N/A

1

5

17

17

22

D

A and B

4

10

12

0

22

E

C and D

3

10

22

0

32

F

A and B

1

5

27

15

32

Example
In Excel, Have a
go at plotting
the chart with
the strict
resource limit of
4:
The Result
Sources and Further Reading:
▪ Fiiled, M. and Keller, M. (1998), Croatia: Thomson Learning
– Chapter 3.4

▪ Moder, J., Philips, C. and Davis, E. (1983), Project management with CPM, PERT and
project diagramming, New York: Van Nostrand Reinhold Publishers
▪ Kerzner, H. (2009) Project Management, New Jersey: John Wiley & Sons, 10th edn.
– Chapter 12

Resource Scheduling

  • 1.
  • 2.
    The Need forResource Scheduling: The previous Project Scheduling methods that we have covered have not considered the constraint of resources. Generally, there are 2 types of projects….. 1. Projects that MUST meet a certain deadline and have ‘unlimited’ resources in order to meet this. This would use Time Limited Scheduling. 2. Projects that have limited availability of the required resources, however the project deadline is more flexible. The would use Resource Limited Scheduling. Note: if a project has both limited time and resources, the project manager must initially assume that one or the other is flexible. OR, renegotiations will need to take place.
  • 3.
  • 4.
    Objectives: ▪ Determine exactlywhat resources the project requires; ▪ Make these resources available for when they are needed; ▪ Use each resource as efficiently as possible – Resource Smoothing: this defines the act of maximising resources efficiency. Despite having ‘umlimited’ resorurces, it is still necessary to try to keep costs down as much as possible.
  • 5.
    The Resources LoadingChart: Activity Description Staff Duration Earliest Start Time Float Latest Finish Time A Prepare offices 2 12 0 0 12 B Procure equipment 2 8 0 4 12 C Design tests 1 5 0 17 22 D Install equiptment 4 10 12 0 22 E Test system 3 10 22 0 32 F Train users 1 5 12 15 32 Consider the adjacent example which is adapted from Field & Keller ‘Project Management’ 1998:
  • 6.
    We will buildthe previous information into a ‘Resource Loading Chart’
  • 7.
    Observations: ▪ From theprevious slide’s graph we can immediately tell how many staff are needed at any one time. ▪ For example – in week 10, we can identify that only 2 staff members are required. Whereas in week 14 there are 5 staff members required. ▪ The method of creating this chart, by positioning one activity at a time, is called Serial Scheduling. Note: The bottom row of the graph could also be described as the ‘critical path’. Each of these items as Float=0. This row can be described as the Base Line.
  • 8.
    Resource Levelling: ▪ Asidentified in the previous slides, our chart contains ‘extreme peaks’. For example, weeks 1-5. ▪ Resource levelling helps to avoid this. ▪ As we have several activities which contain float, we can try to move these activities to ‘level’ out the staff distribution:
  • 9.
    Obviously this still isn’tideal as we still have a ‘peak’ during week 13. However we have levelled s much as possible, and in turn we have reduced costs.
  • 10.
  • 11.
    Objectives: ▪ To adjustthe project’s time to adapt to fixed level of resources. ▪ In the previous example, we realised it would take 5 staff to create the office in 32 weeks. ▪ Now, let’s consider how long it would take if the staff level were fixed at 4.
  • 12.
    Parallel Scheduling: ▪ Definition:Starting at the beginning of a project and considering all the eligible activities, in a parallel manner. ▪ An eligible activity would be one which could be started if the resources were available. Let’s re-consider the example….
  • 13.
    Activity Dependency Staff Duration Latest Start Time Float LatestFinish Time A N/A 2 12 0 0 12 B N/A 2 8 4 4 12 C N/A 1 5 17 17 22 D A and B 4 10 12 0 22 E C and D 3 10 22 0 32 F A and B 1 5 27 15 32 Example
  • 14.
    In Excel, Havea go at plotting the chart with the strict resource limit of 4:
  • 15.
  • 16.
    Sources and FurtherReading: ▪ Fiiled, M. and Keller, M. (1998), Croatia: Thomson Learning – Chapter 3.4 ▪ Moder, J., Philips, C. and Davis, E. (1983), Project management with CPM, PERT and project diagramming, New York: Van Nostrand Reinhold Publishers ▪ Kerzner, H. (2009) Project Management, New Jersey: John Wiley & Sons, 10th edn. – Chapter 12