Download to read offline
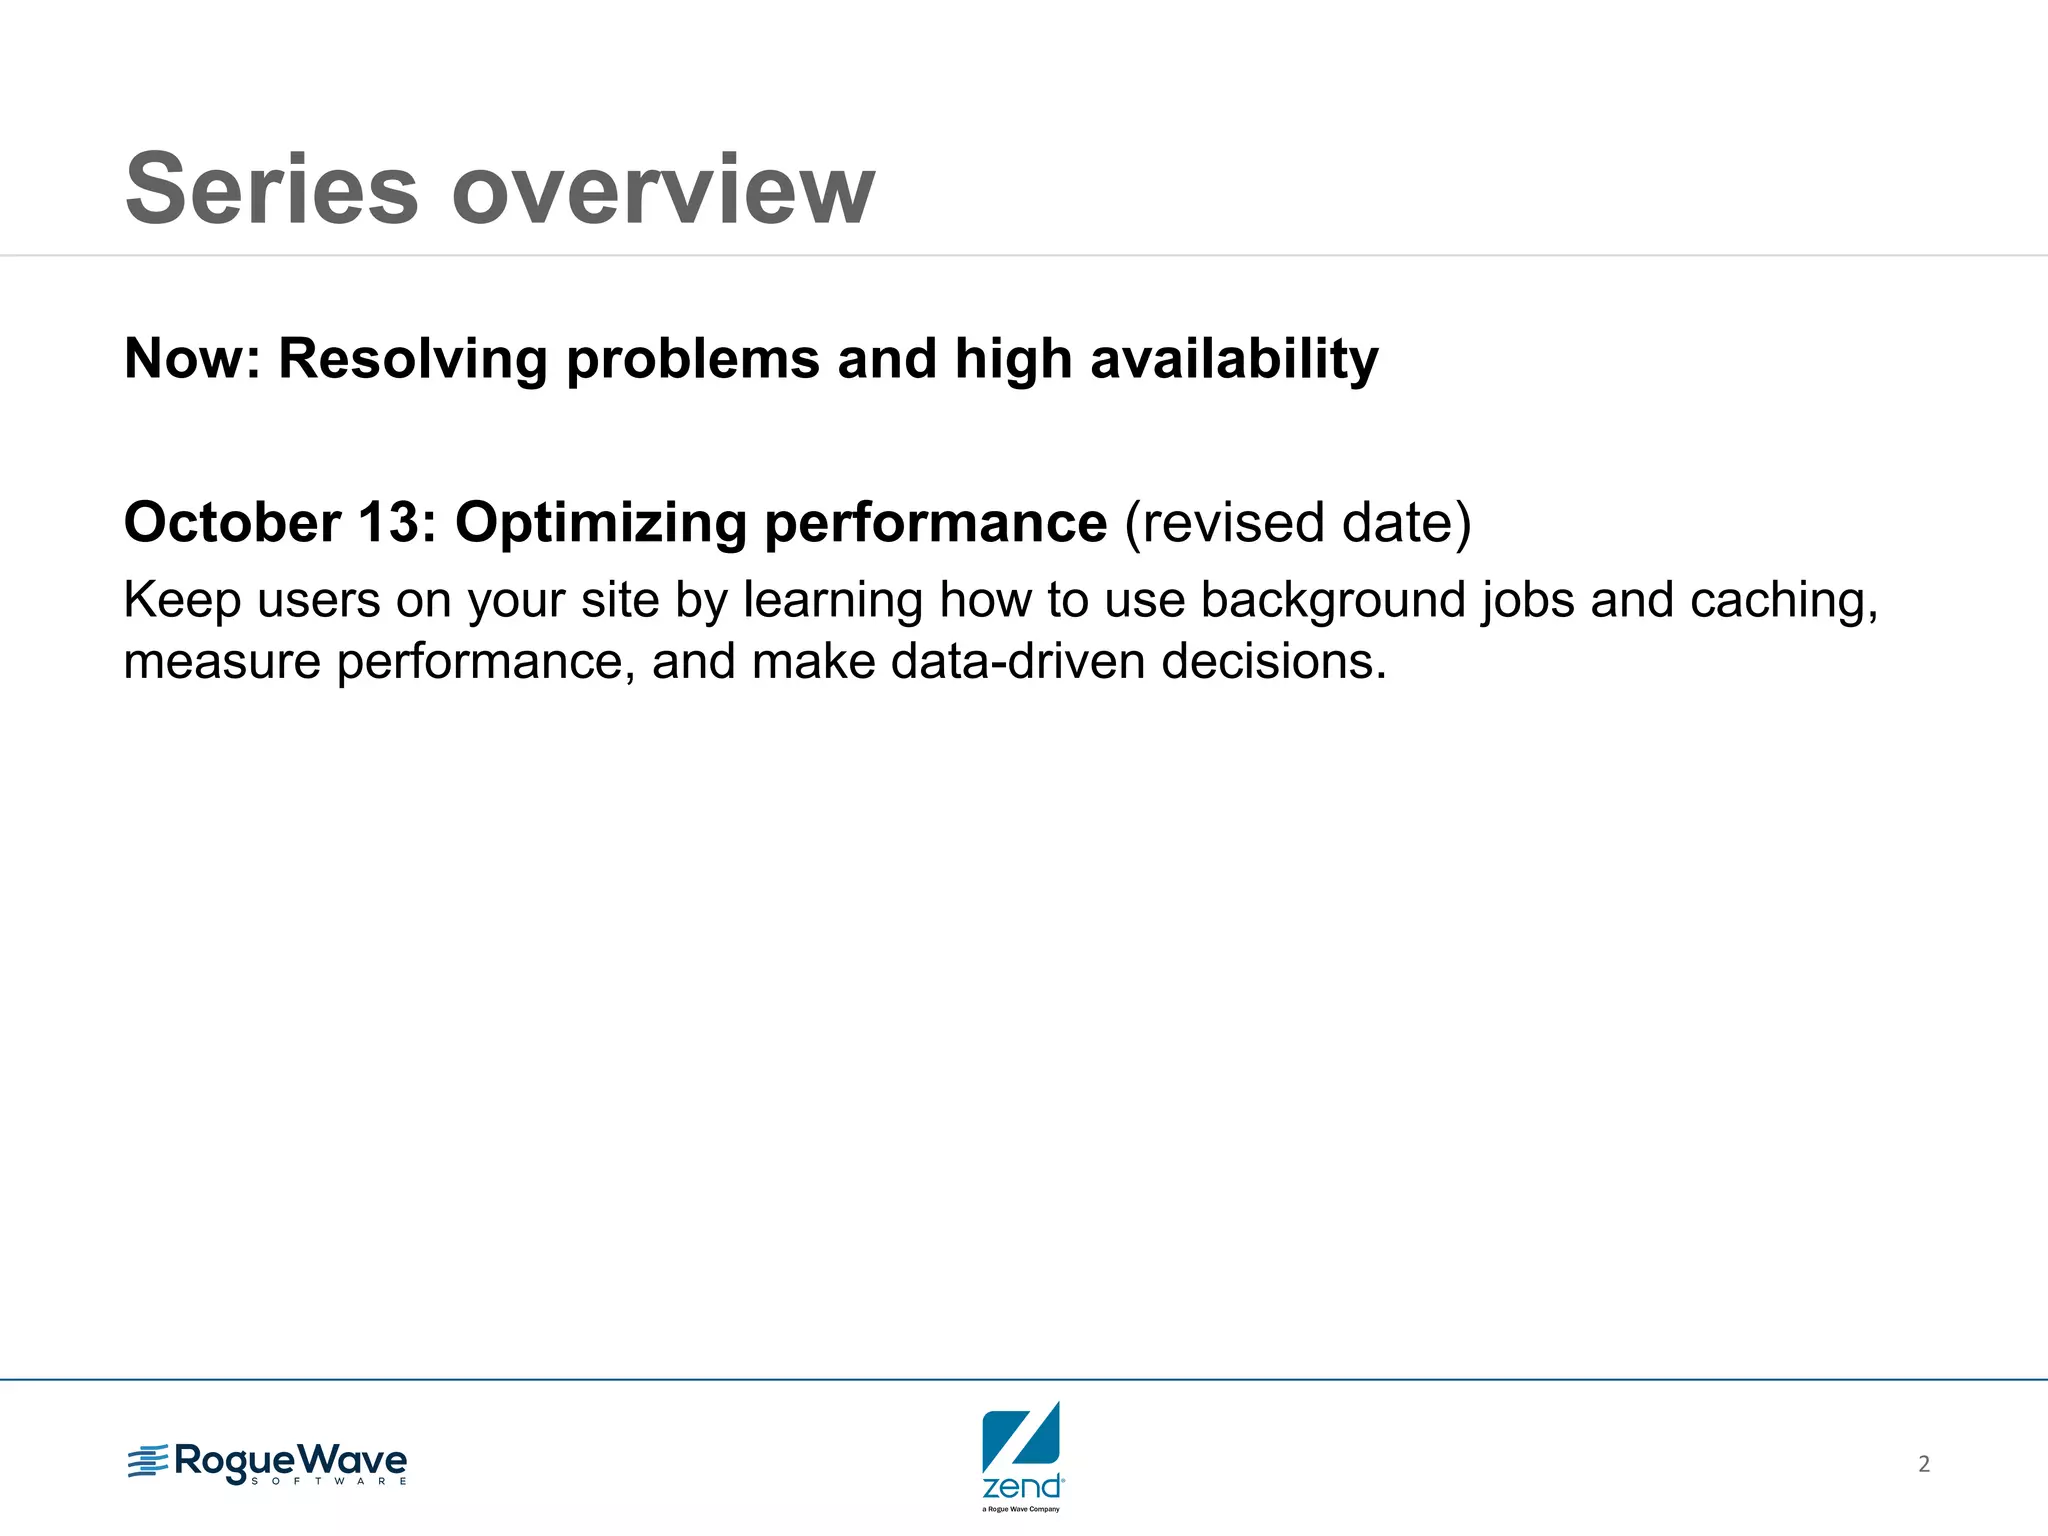
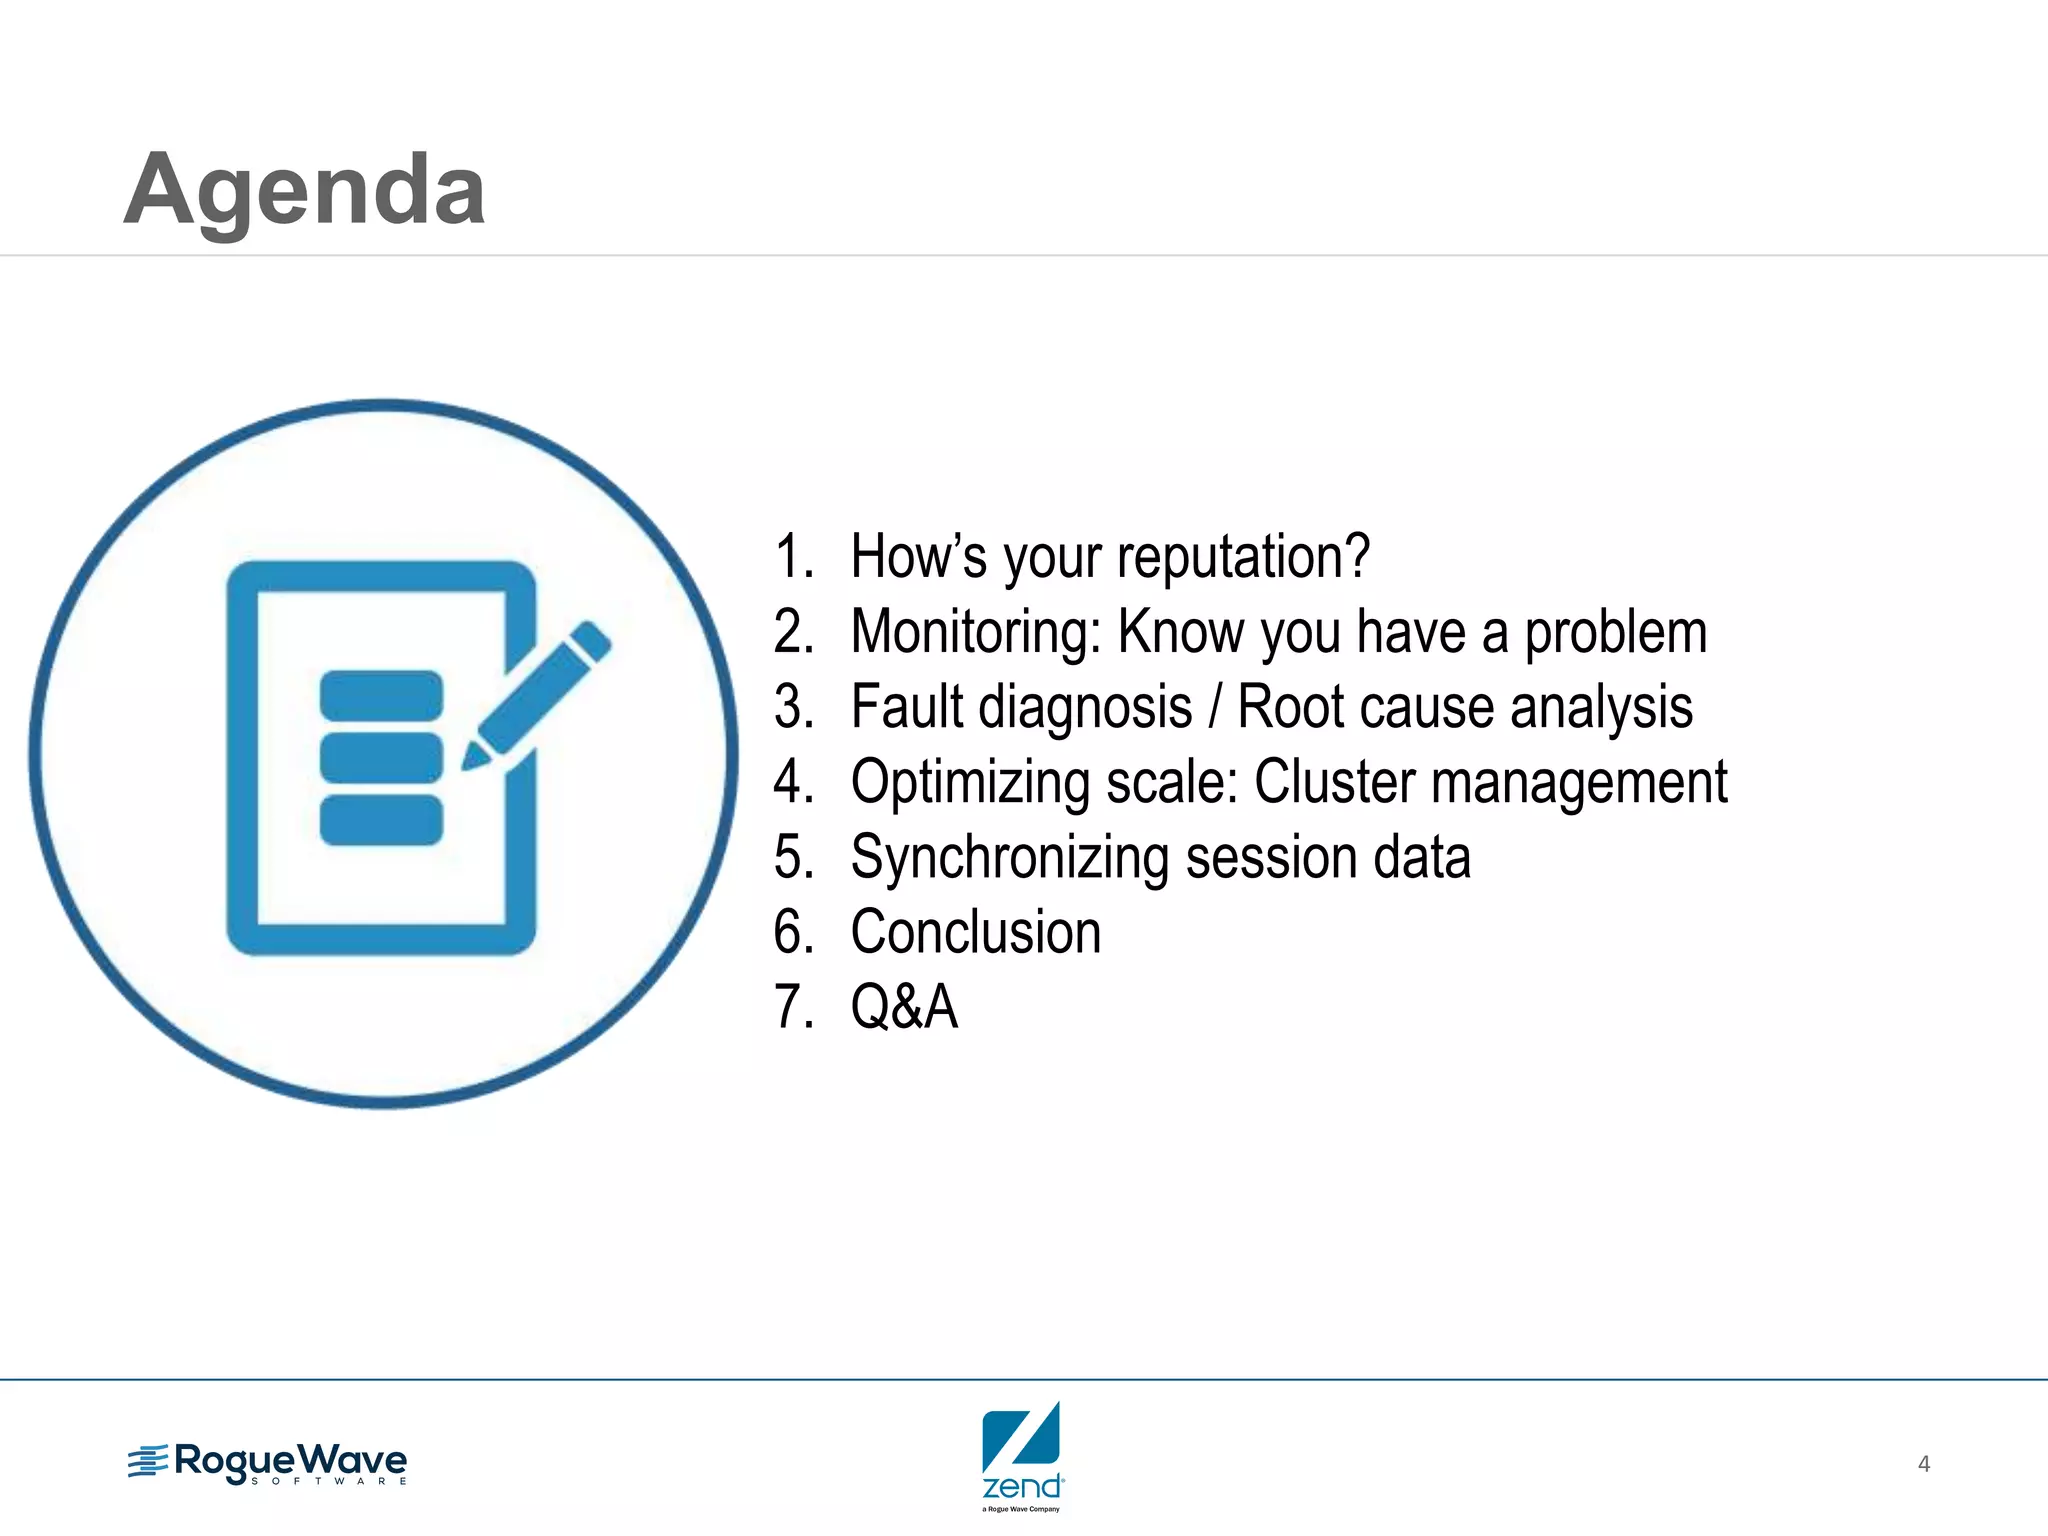

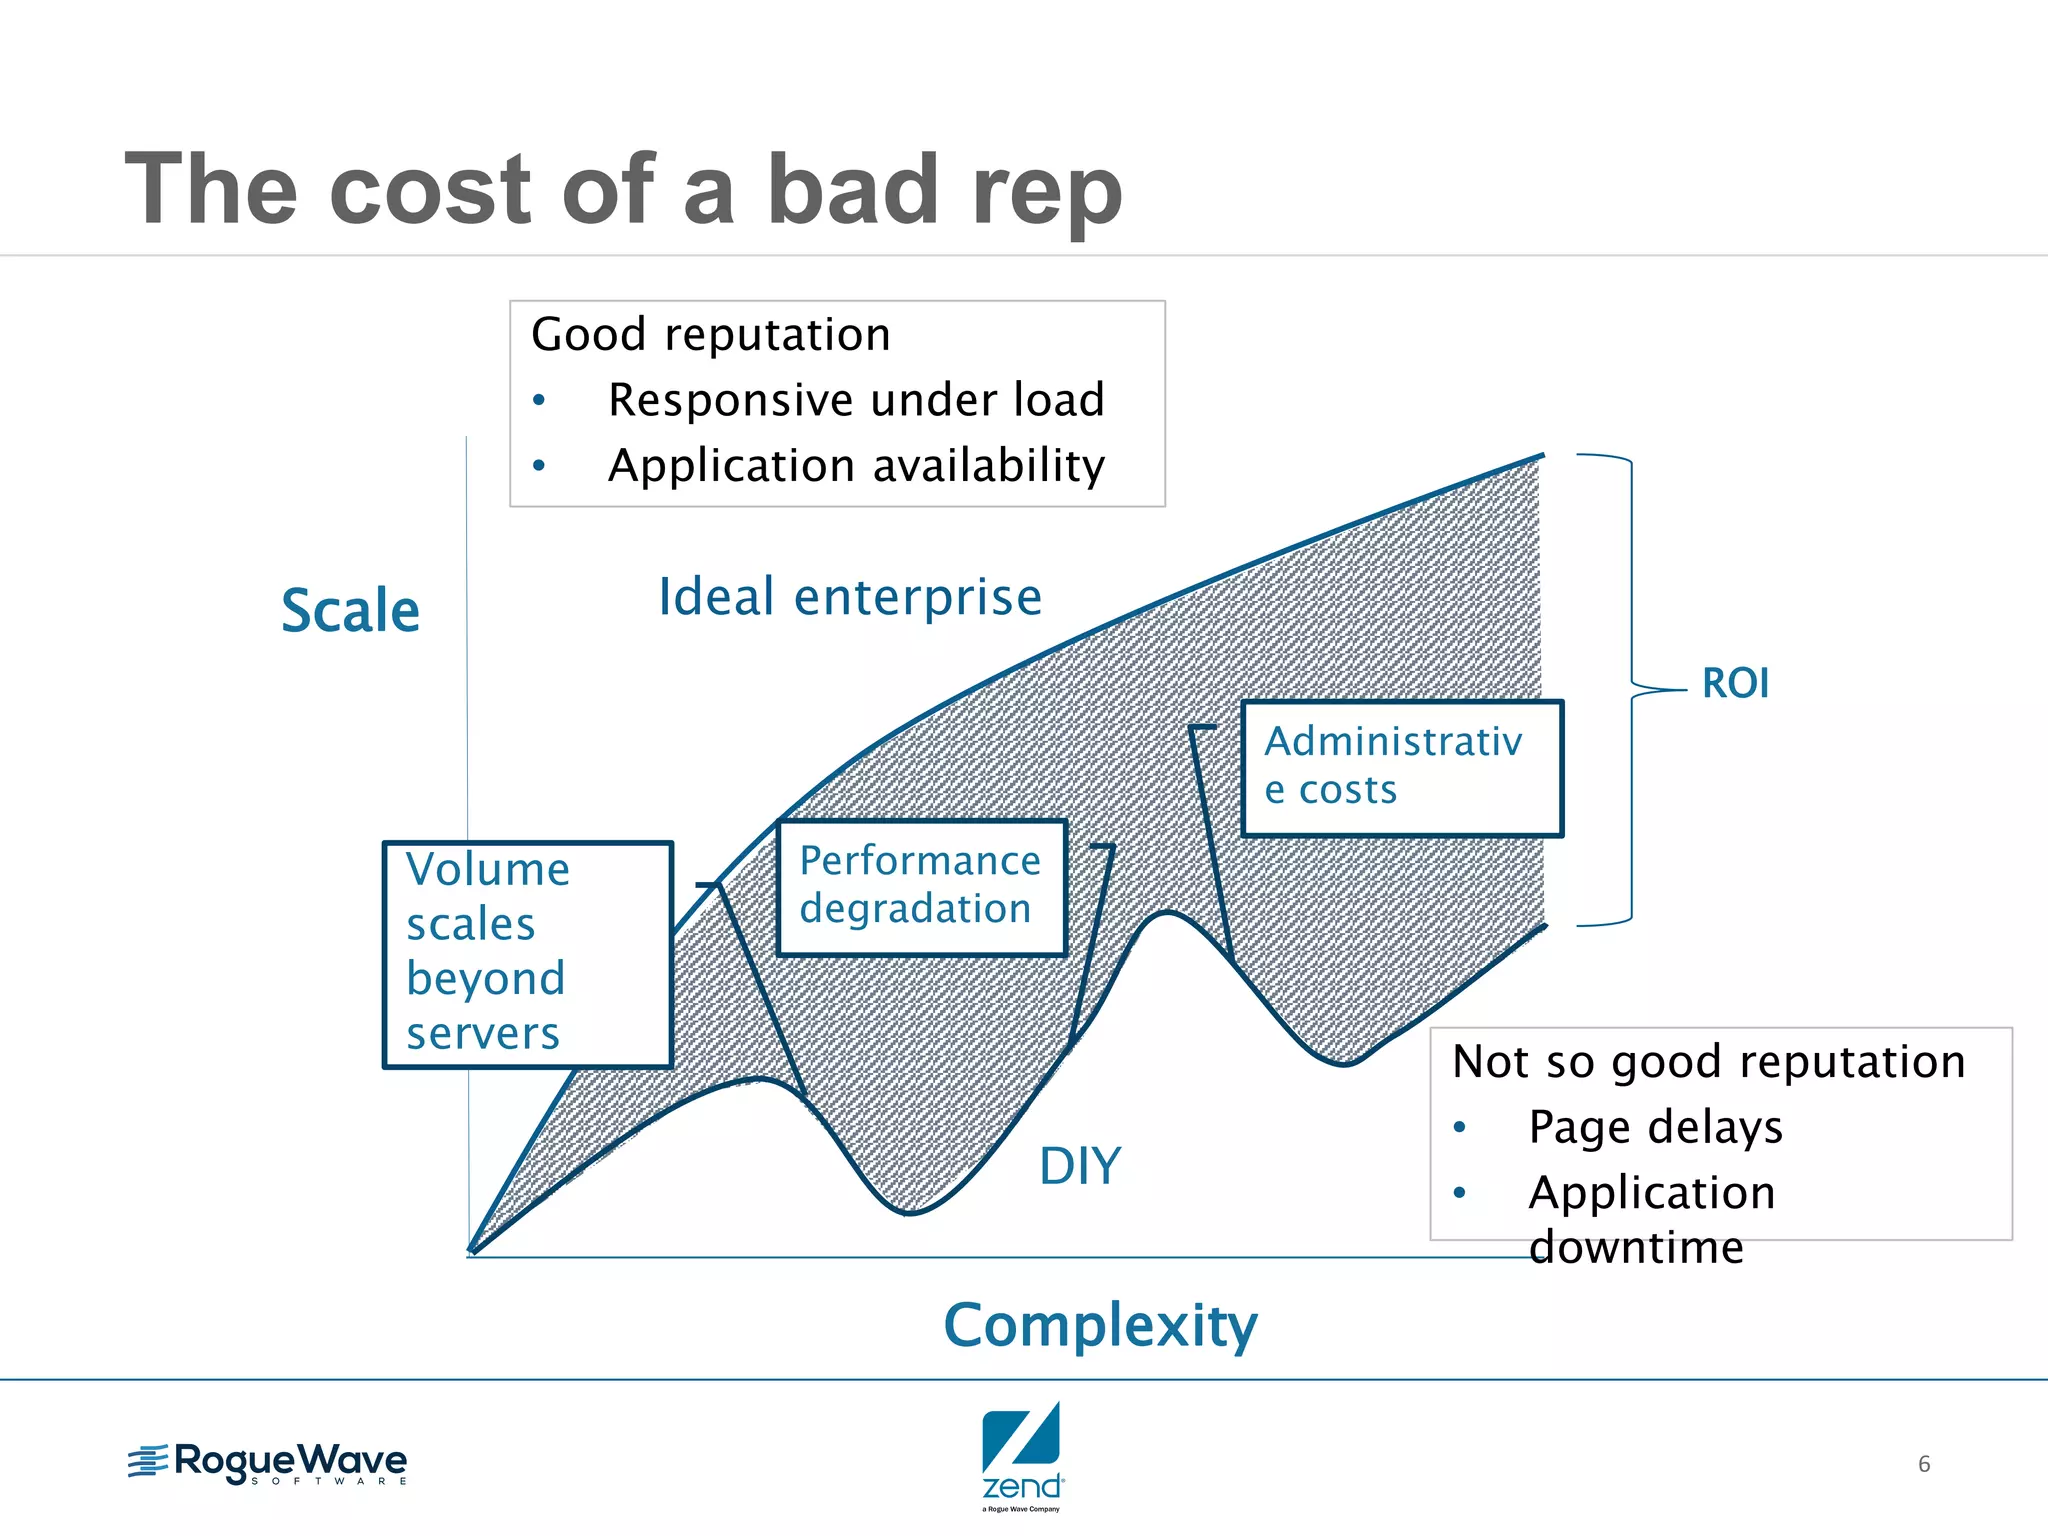
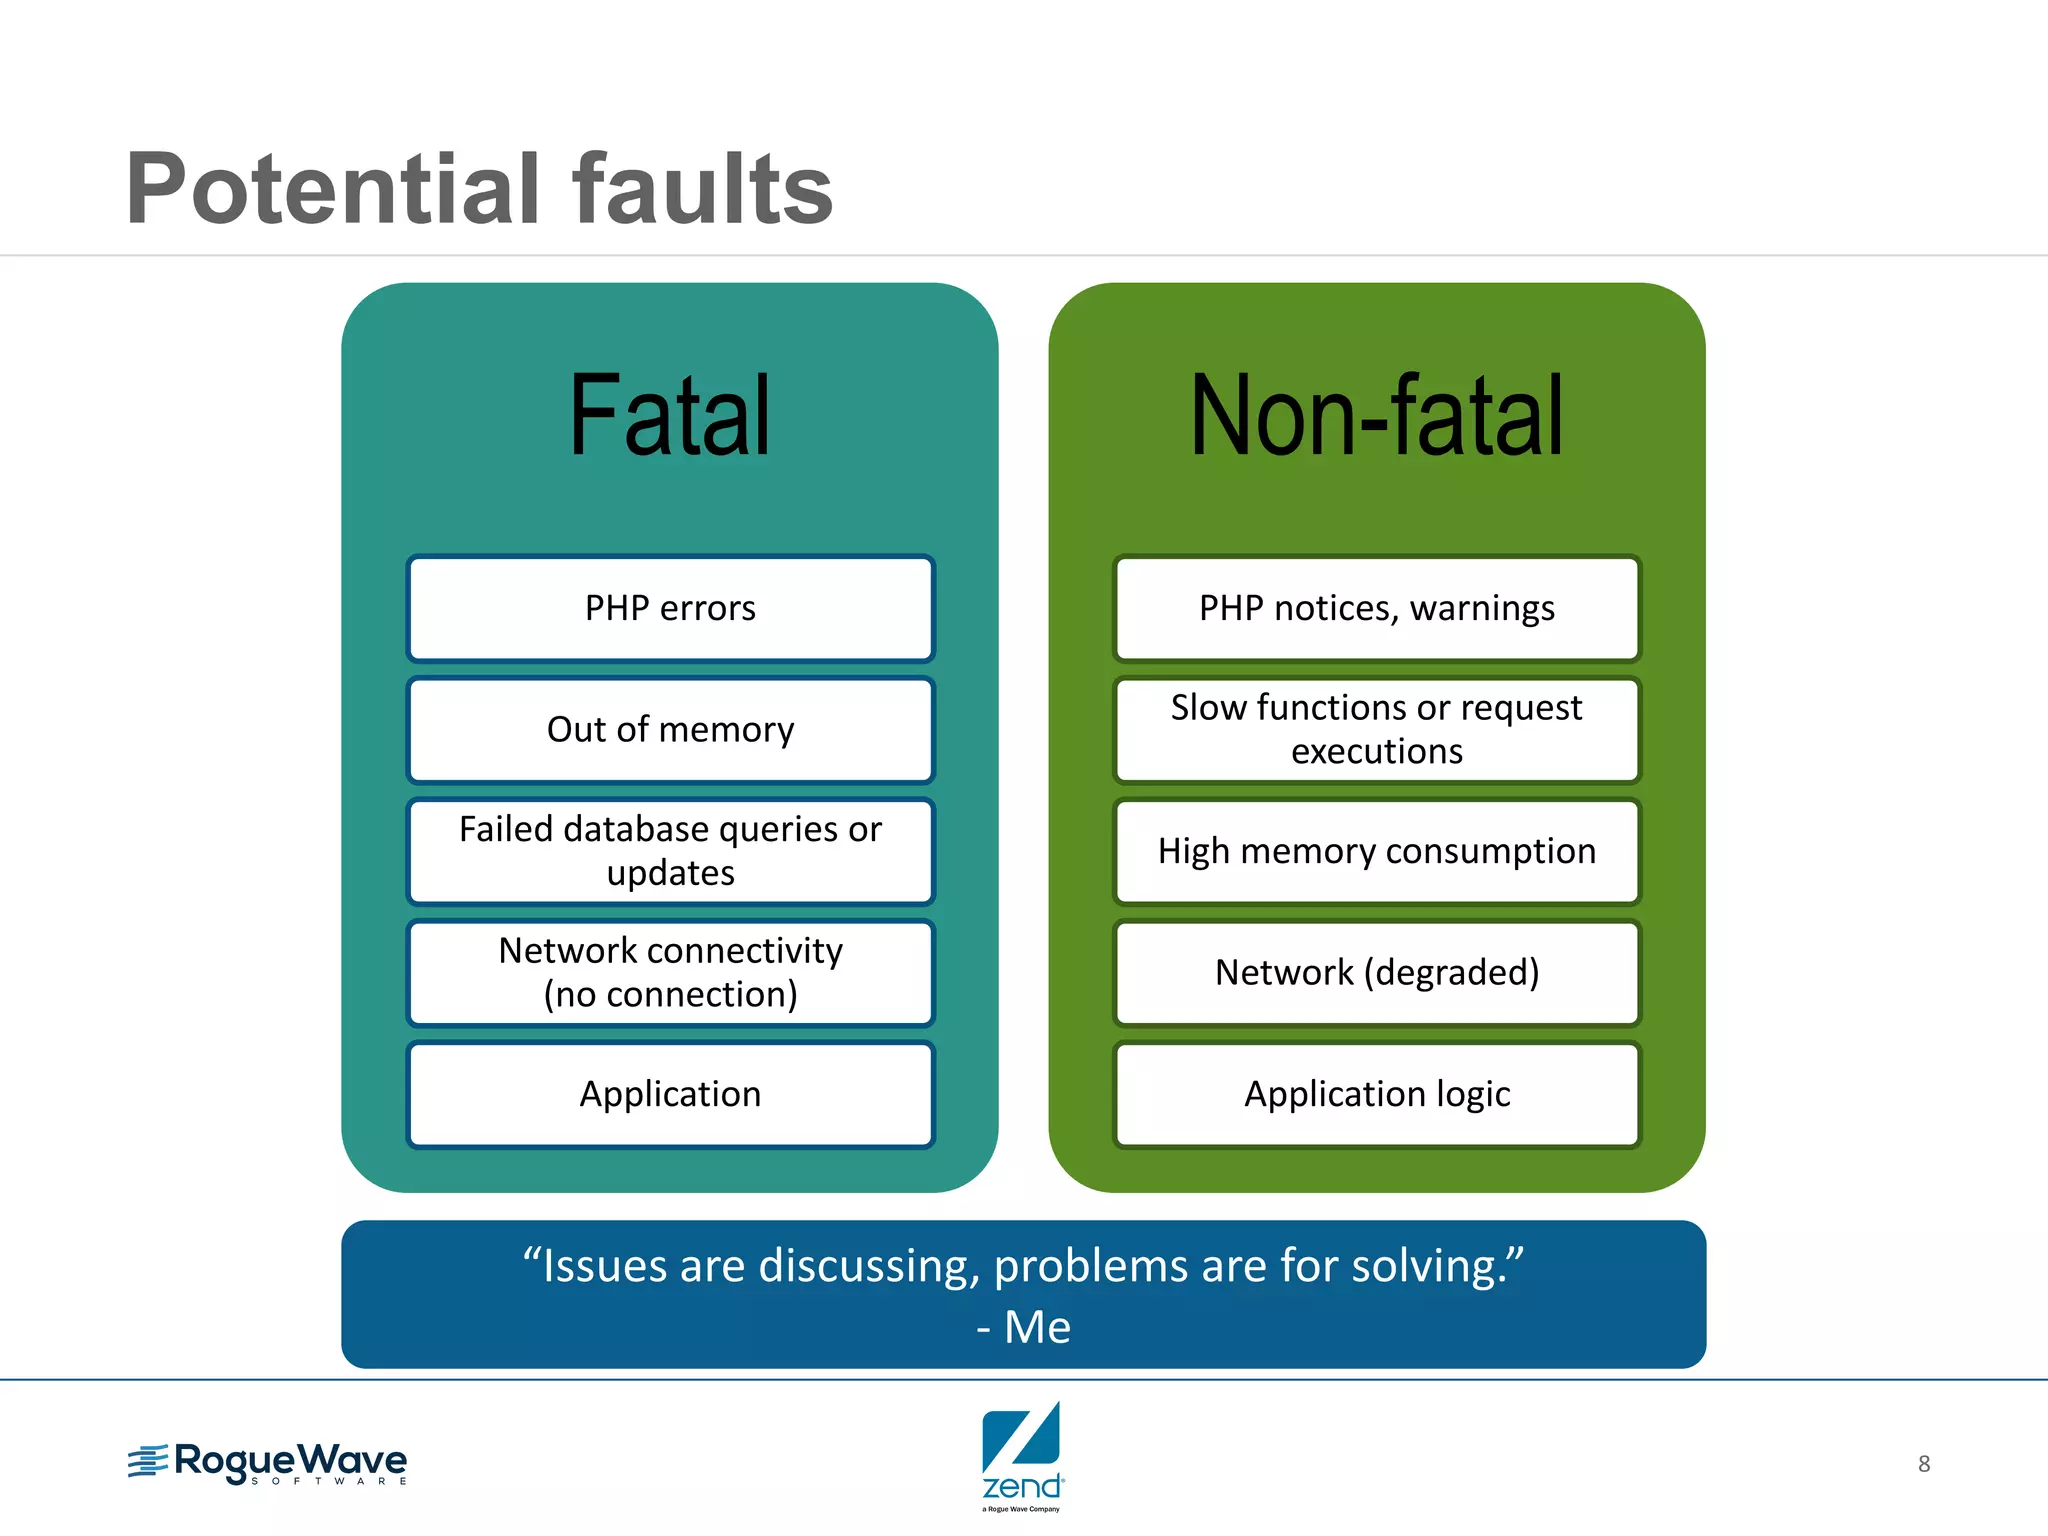
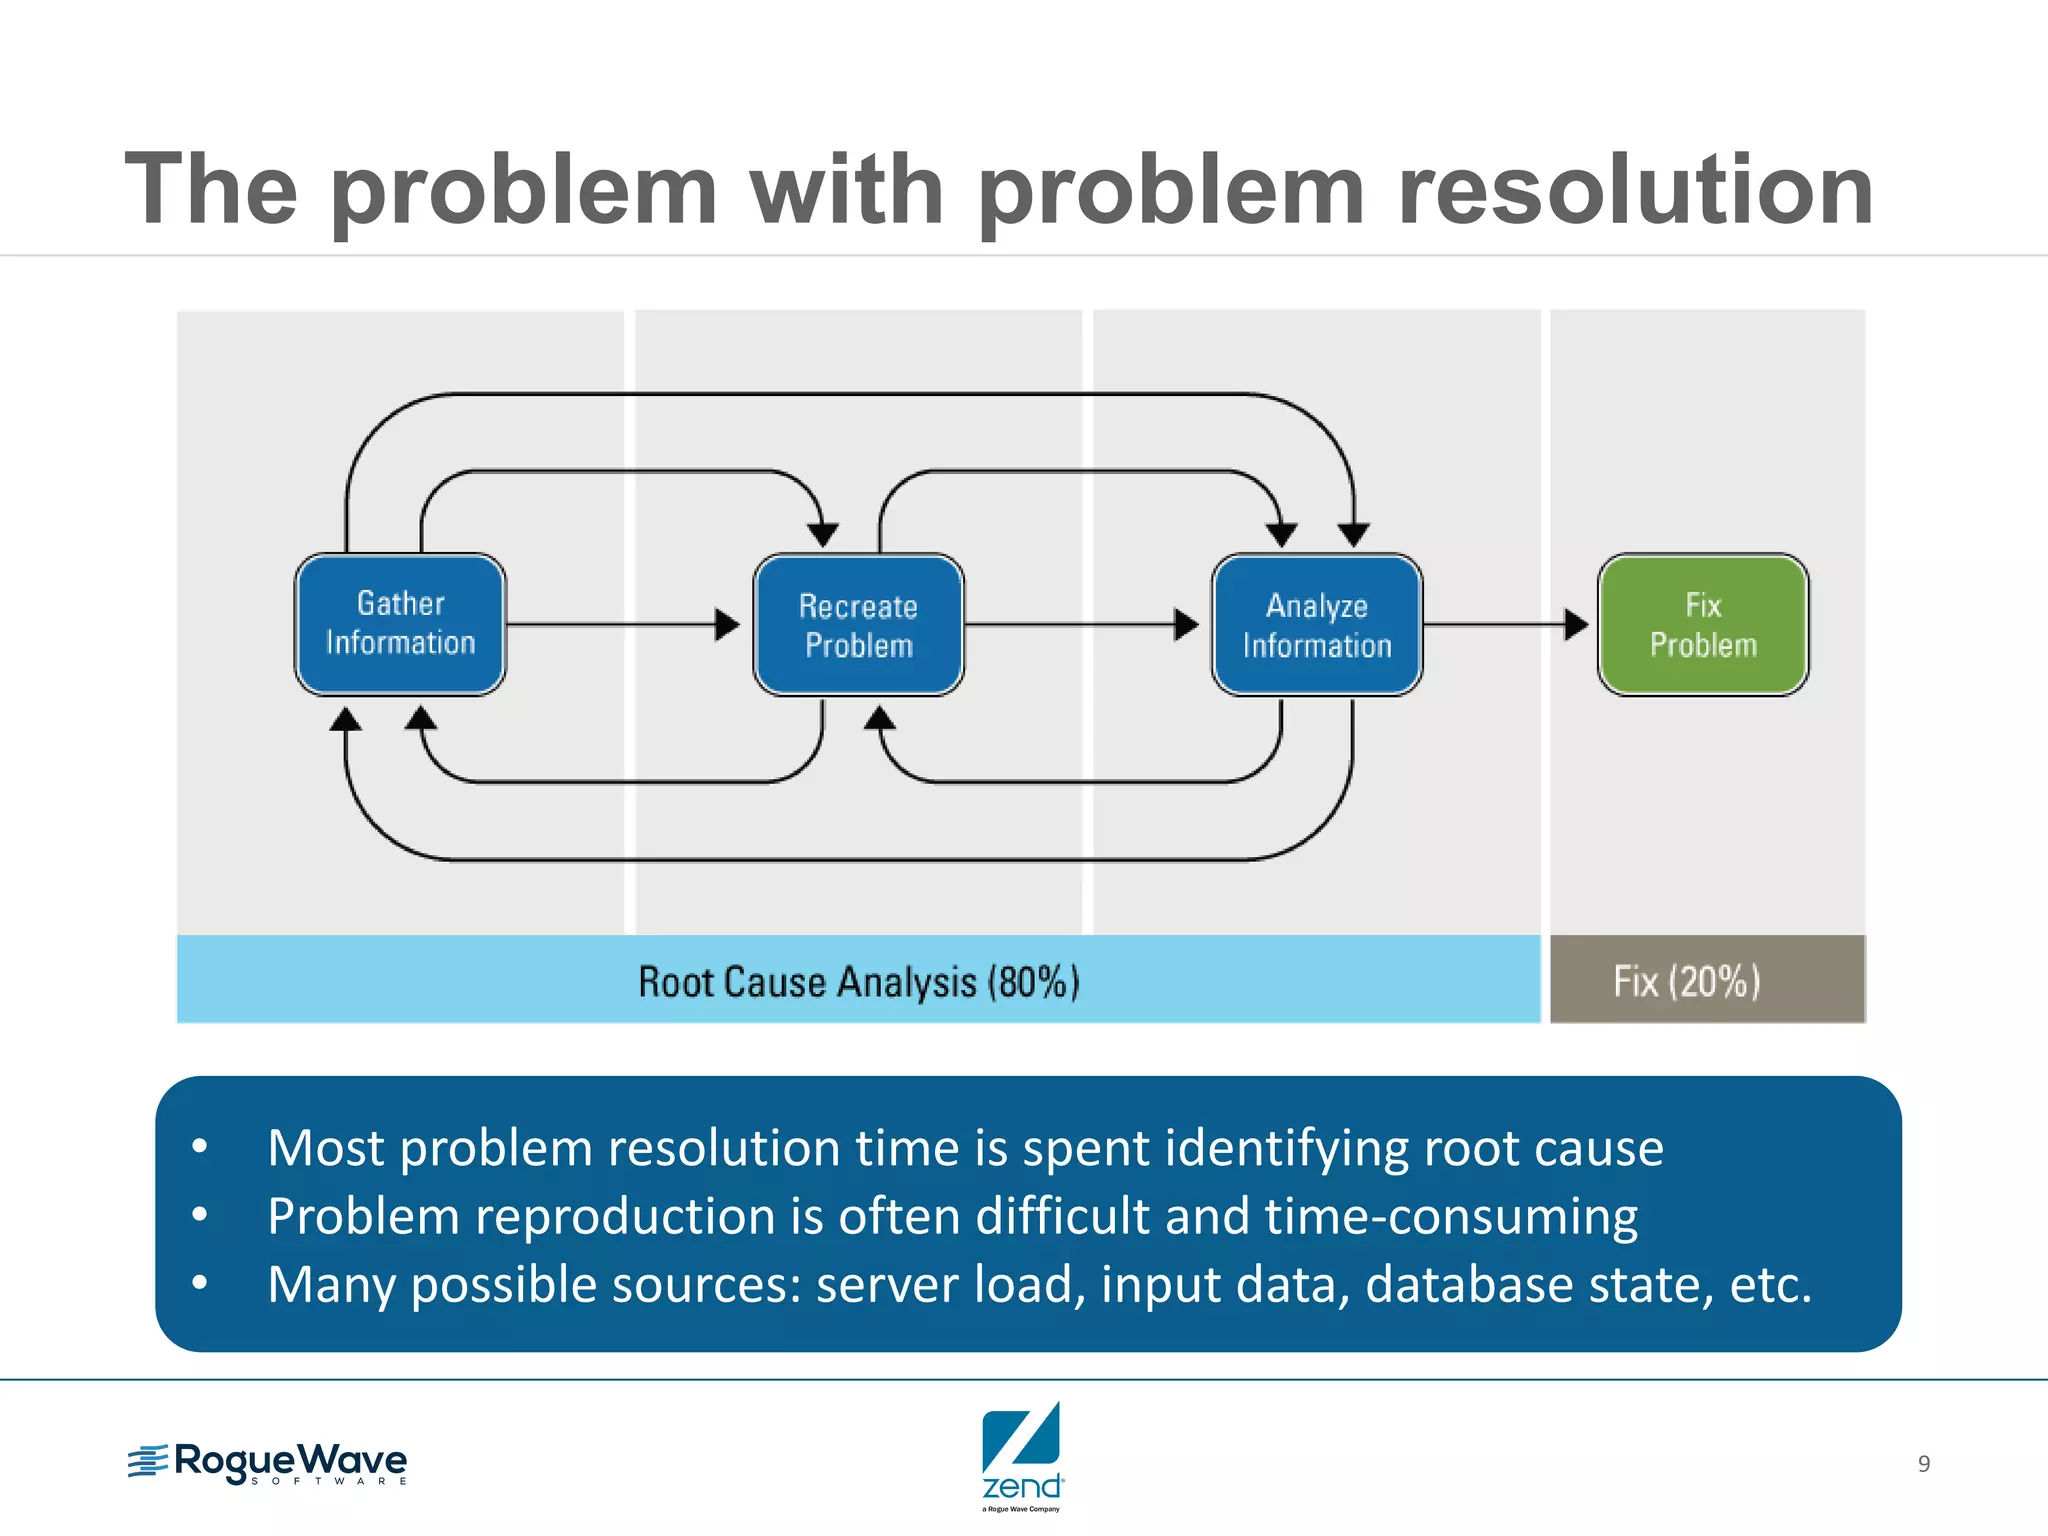
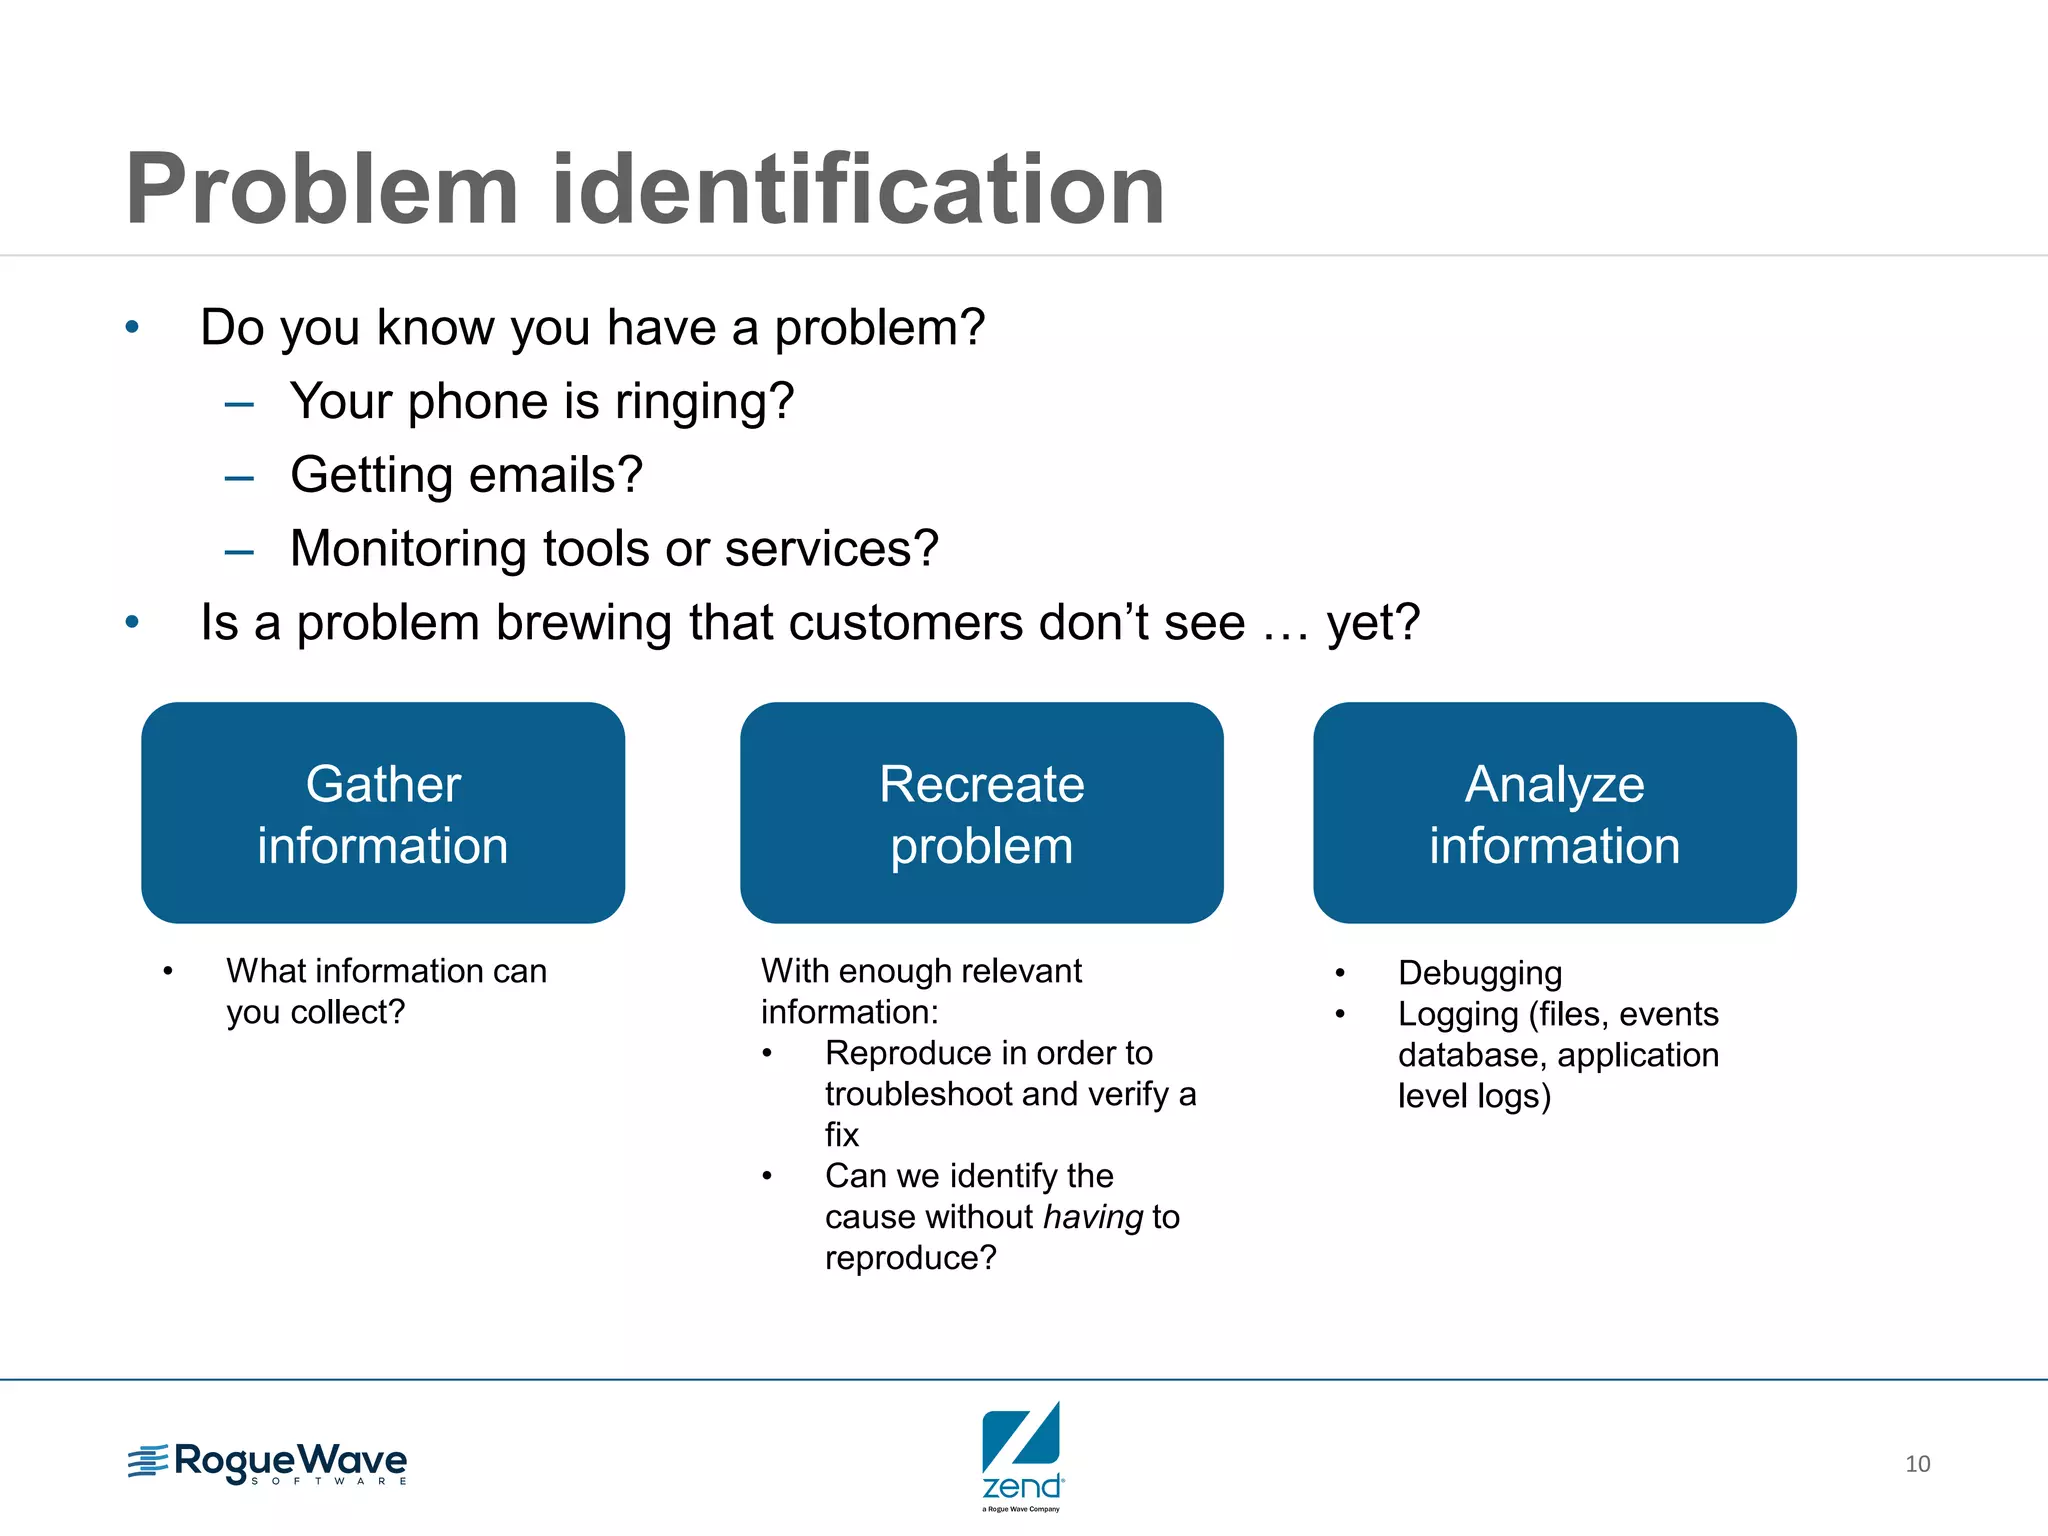
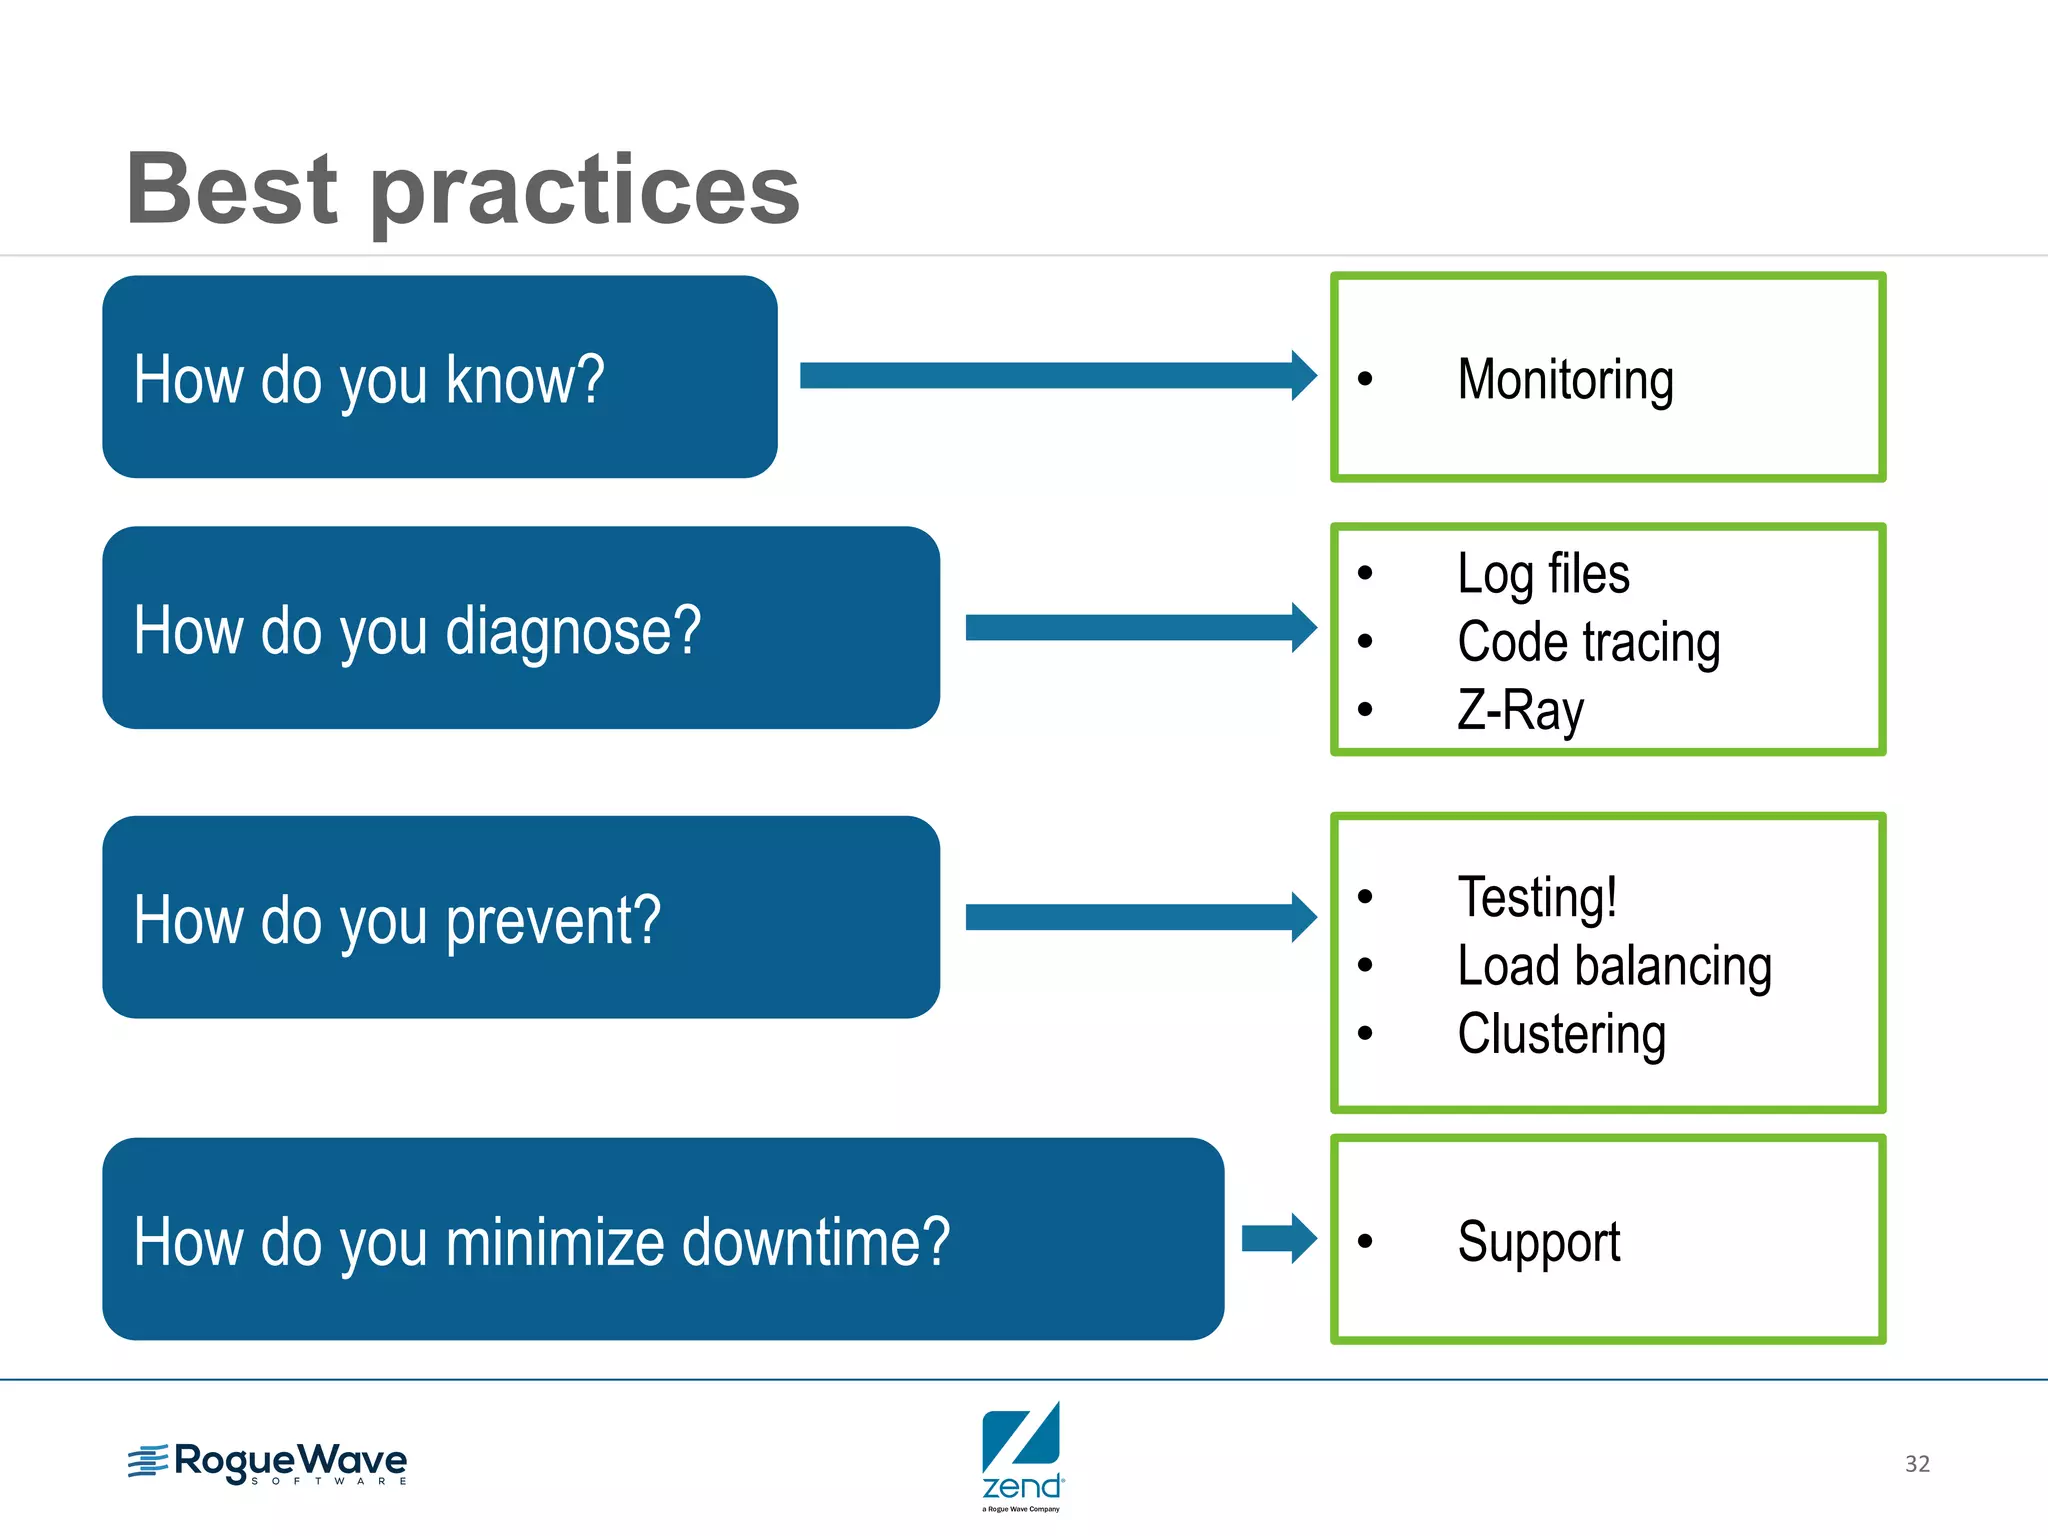


This document outlines strategies for resolving problems and ensuring high availability in enterprise PHP applications, featuring key topics like monitoring for faults, fault diagnosis, and optimizing scalability through clustering. It emphasizes the importance of maintaining a good reputation by minimizing performance degradation and application downtime while providing insights into effective monitoring and debugging techniques. The session also includes a Q&A section and promotes upcoming webinars on performance optimization.