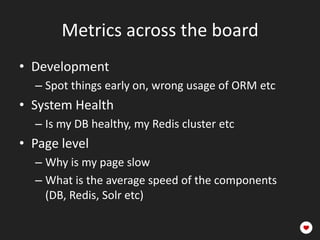
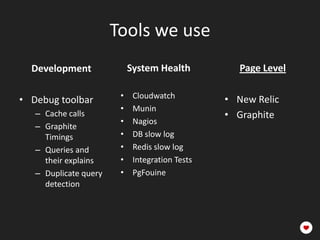
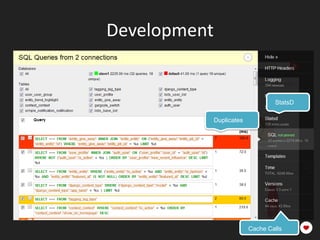
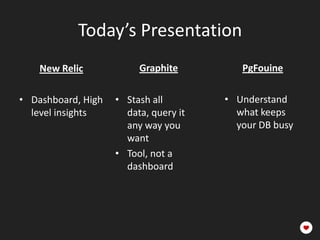
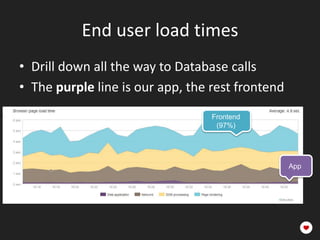
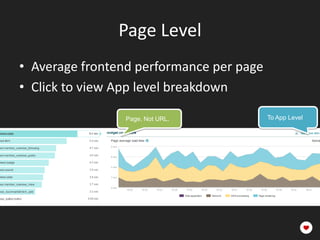
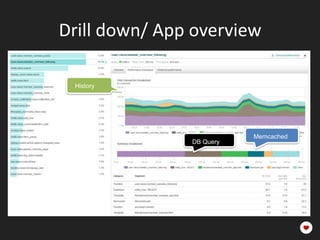
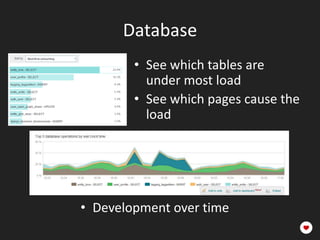
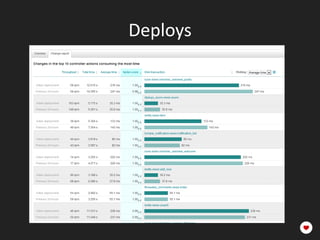
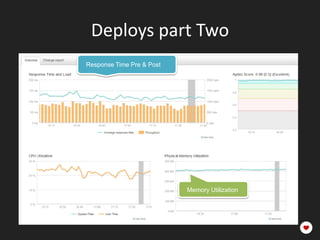
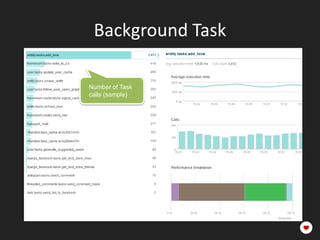
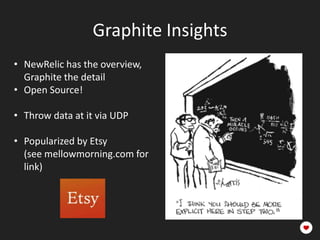
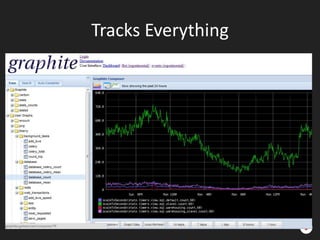
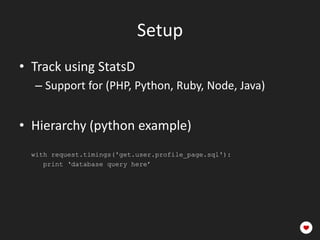
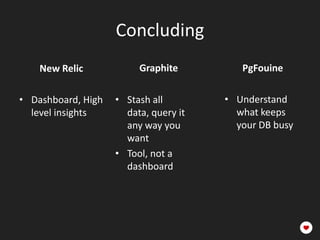
Performance metrics
for a social network
About Me

•   Thierry Schellenbach
•   Founder/ CTO Fashiolista
•   Author of Django Facebook
•   Github/tschellenbach

• Blog: mellowmorning.com
• @tschellenbach
Global Fashion Discovery
5.000.000+
8.000.000+
Growth

2nd largest fashion community

• 1mln members
• 17mln loves/month
• 94mln non-bot pageviews
Powered By

•   Django/Python
•   PostgreSQL
•   Solr
•   Redis
•   Celery
•   AWS/ Ubuntu
•   Nginx/ Gunicorn/ Supervisor
Sexy Metrics driven optimization
Hard Because

• All content is personalized

• Activity is clustered around a few
  users (>100k followers)

• Individual users are insanely
  active (7 hours in a day is
  normal)

• Social network, can’t easily shard
  data
Speed is a Feature
Metrics across the board
• Development
  – Spot things early on, wrong usage of ORM etc
• System Health
  – Is my DB healthy, my Redis cluster etc
• Page level
  – Why is my page slow
  – What is the average speed of the components
    (DB, Redis, Solr etc)
Tools we use
  Development               System Health           Page Level

                        •    Cloudwatch          • New Relic
• Debug toolbar
                        •    Munin
   – Cache calls                                 • Graphite
                        •    Nagios
   – Graphite
     Timings            •    DB slow log
   – Queries and        •    Redis slow log
     their explains     •    Integration Tests
   – Duplicate query    •    PgFouine
     detection
Development


                                   StatsD

              Duplicates


                           Cache Calls
Today’s Presentation
    New Relic            Graphite           PgFouine

• Dashboard, High   • Stash all data,    • Understand
  level insights      query it any way     what keeps
                      you want             your DB busy
                    • Tool, not a
                      dashboard
New Relic

• Frontend -> App ->
  Components (DB, Solr, etc.)
• Breaks page performance
  down into it’s components
• Tracks deploys and compares
  before and after
Are you Supported?

•   Ruby              •   Pip install newrelic
•   Java              •   Edit the .ini
•   .NET              •   Add the WSGI middleware
•   PHP               •   Wait for Magic
•   Python
End user load times
• Drill down all the way to Database calls
• The purple line is our app, the rest frontend
                                  Frontend
                                   (97%)


                                                  App
Global page loads
Page Level
• Average frontend performance per page
• Click to view App level breakdown

                 Page. Not URL.           To App Level
Drill down/ App overview

 History


                          Memcached
               DB Query
Database
        • See which tables are
          under most load
        • See which pages cause the
          load


• Development over time
Deploys
Deploys part Two
Response Time Pre & Post


                           Memory Utilization
Background Task

Number of Task
calls (sample)
Graphite Insights
• NewRelic has the overview,
  Graphite the detail
• Open Source!

• Throw data at it via UDP

• Popularized by Etsy
  (see mellowmorning.com for
  link)
It’s Complicated
Tracks Everything
Setup
• Track using StatsD
   – Support for (PHP, Python, Ruby, Node, Java)

• Hierarchy (python example)
• get.<app>.<view>.<component>
  with request.timings('get.user.profile_page.sql'):
     print ‘database query here’
Data tool/ Not a dashboard

• Wildcards
  – get.<app>.<view>.*.upper_90

  – get.<app>.*.redis.zadd.upper_90

  – limit(sortByMaxima(get.<app>.<view>.*.up
    per_90),4)
/style/<user>/ performance


                   Memcached
                   Slowdown


            ZADD


                       Set Many
Including Functional parts of Pages

• More like this part is
  tracked

• Solr & Redis Cache
What we Track

•   Loadtime per bit of functionality
•   Database calls per DB
•   90th percentile load times
•   Task broker roundtrip times
•   Facebook API calls
PgFouine
• Run on samples of all queries (say 5m)
• Not just slow queries
• Repeating a simple query many times is also
  wrong, PgFouine finds it

• See Instagram’s fabric snippet
• https://gist.github.com/2307647
PgFouine Continued
Queries that took up
the most time (N)

• Spots issues with
  many small queries                Normalized

Compare multiple
reports
PgFouine Tips

• My colleague wrote a fast C++ version
• github.com/WoLpH/pg_query_analyser

  Also look at:
• Pg Stat Statement
• Pg Badger
Concluding
    New Relic            Graphite           PgFouine

• Dashboard, High   • Stash all data,    • Understand
  level insights      query it any way     what keeps
                      you want             your DB busy
                    • Tool, not a
                      dashboard
Q&A

We’re Searching for Django Developers & Linux
system administrators!

              Fashiolista.com/jobs

Open source projects:

            Github.com/tschellenbach
               Try Django Facebook!

Performance metrics for a social network

  • 1.
  • 2.
    About Me • Thierry Schellenbach • Founder/ CTO Fashiolista • Author of Django Facebook • Github/tschellenbach • Blog: mellowmorning.com • @tschellenbach
  • 3.
  • 7.
  • 8.
    Growth 2nd largest fashioncommunity • 1mln members • 17mln loves/month • 94mln non-bot pageviews
  • 9.
    Powered By • Django/Python • PostgreSQL • Solr • Redis • Celery • AWS/ Ubuntu • Nginx/ Gunicorn/ Supervisor
  • 10.
    Sexy Metrics drivenoptimization Hard Because • All content is personalized • Activity is clustered around a few users (>100k followers) • Individual users are insanely active (7 hours in a day is normal) • Social network, can’t easily shard data
  • 11.
    Speed is aFeature
  • 12.
    Metrics across theboard • Development – Spot things early on, wrong usage of ORM etc • System Health – Is my DB healthy, my Redis cluster etc • Page level – Why is my page slow – What is the average speed of the components (DB, Redis, Solr etc)
  • 13.
    Tools we use Development System Health Page Level • Cloudwatch • New Relic • Debug toolbar • Munin – Cache calls • Graphite • Nagios – Graphite Timings • DB slow log – Queries and • Redis slow log their explains • Integration Tests – Duplicate query • PgFouine detection
  • 14.
    Development StatsD Duplicates Cache Calls
  • 15.
    Today’s Presentation New Relic Graphite PgFouine • Dashboard, High • Stash all data, • Understand level insights query it any way what keeps you want your DB busy • Tool, not a dashboard
  • 16.
    New Relic • Frontend-> App -> Components (DB, Solr, etc.) • Breaks page performance down into it’s components • Tracks deploys and compares before and after
  • 17.
    Are you Supported? • Ruby • Pip install newrelic • Java • Edit the .ini • .NET • Add the WSGI middleware • PHP • Wait for Magic • Python
  • 18.
    End user loadtimes • Drill down all the way to Database calls • The purple line is our app, the rest frontend Frontend (97%) App
  • 19.
  • 20.
    Page Level • Averagefrontend performance per page • Click to view App level breakdown Page. Not URL. To App Level
  • 21.
    Drill down/ Appoverview History Memcached DB Query
  • 22.
    Database • See which tables are under most load • See which pages cause the load • Development over time
  • 23.
  • 24.
    Deploys part Two ResponseTime Pre & Post Memory Utilization
  • 25.
    Background Task Number ofTask calls (sample)
  • 26.
    Graphite Insights • NewRelichas the overview, Graphite the detail • Open Source! • Throw data at it via UDP • Popularized by Etsy (see mellowmorning.com for link)
  • 27.
  • 28.
  • 29.
    Setup • Track usingStatsD – Support for (PHP, Python, Ruby, Node, Java) • Hierarchy (python example) • get.<app>.<view>.<component> with request.timings('get.user.profile_page.sql'): print ‘database query here’
  • 30.
    Data tool/ Nota dashboard • Wildcards – get.<app>.<view>.*.upper_90 – get.<app>.*.redis.zadd.upper_90 – limit(sortByMaxima(get.<app>.<view>.*.up per_90),4)
  • 31.
    /style/<user>/ performance Memcached Slowdown ZADD Set Many
  • 32.
    Including Functional partsof Pages • More like this part is tracked • Solr & Redis Cache
  • 33.
    What we Track • Loadtime per bit of functionality • Database calls per DB • 90th percentile load times • Task broker roundtrip times • Facebook API calls
  • 34.
    PgFouine • Run onsamples of all queries (say 5m) • Not just slow queries • Repeating a simple query many times is also wrong, PgFouine finds it • See Instagram’s fabric snippet • https://gist.github.com/2307647
  • 35.
    PgFouine Continued Queries thattook up the most time (N) • Spots issues with many small queries Normalized Compare multiple reports
  • 36.
    PgFouine Tips • Mycolleague wrote a fast C++ version • github.com/WoLpH/pg_query_analyser Also look at: • Pg Stat Statement • Pg Badger
  • 37.
    Concluding New Relic Graphite PgFouine • Dashboard, High • Stash all data, • Understand level insights query it any way what keeps you want your DB busy • Tool, not a dashboard
  • 38.
    Q&A We’re Searching forDjango Developers & Linux system administrators! Fashiolista.com/jobs Open source projects: Github.com/tschellenbach Try Django Facebook!

Editor's Notes

  • #2 Fashiolista
  • #5 Users of Fashiolista install the so called “love button”. While browsing around the web they can use this button to add their favourite fashion finds to Fashiolista.
  • #6 Once they click the button, we figure out the relevant image on the page and allow you to add it to your profile.
  • #7 The find is added to your profile and other people can follow the items you love.
  • #9 Over the past 2 years thing have moved along rapidly.Currently we’re the second largest fashion community worldwide.With close to 1mln members, and massive monthly engagement.So, a quick check.Who In this room is a member of Fashiolista
  • #10 So, let’s focus on the tech side of things.Powered by
  • #11 On to the topic of this talkTracking the right things to optimize your web application.Now, optimizing a social network is hard.I won’t go into the techniques we use at Fashiolista for speeding up the application, today we’ll focus on the metrics enabling us to focus on the bottlenecks.
  • #12 Why does it matter?We’ve consistently seen massive growth in pageviews after speeding up the site.You can often add 20% to the number of pageviews, just by making the site faster.Once you have an initial audience, making your product work well is really powerfull.
  • #13 We can divide most of our measurement tools into 3 categoriesdevelopment, system health, page level- Answering the specific questions
  • #14 Some of the tools we use.We care mainly about the page level.CPU on the database is interesting, but tells you more about when you’ll run into system limits.While working on optimizing you application you want to focus on the page level.How fast are the applications used to generate this page.Did we wait on the database, or was it solr.
  • #15 Small interlude, because I’m really happy with the Django debug toolbar.I used to work with Symonfy and Django borrowed this, but it’s awesome.Duplicate queriesStatsd Functional reportingCache calls
  • #16 A few tools are really slick and definitely deserve a little demo.NewRelicGraphitePgFouineExplain their use cases
  • #17 New Relic gives you the full drilldown. Starting from frontend to the app to the components.The apdex score tells you the percentage of users which had a good experience (page generated under 500ms).
  • #20 Useful to see how your CDN is doing it’s job.We’ve recently switched from Akamai to Cloudfront.Which seems to work quite well in most countries.
  • #22 At the page level you get a lot of cool information.You see the load times per component.- Such as the the time spent querying the db. (Entity_love table in this case)Or the time spent querying memcached (Which is quite substantial about 20ms)In addition you see the development over time.Which is great for spotting problems which are recently introduced.
  • #23 New Relic also offers database level components.Tables under most loadThe awesome bit, it relates this to pages cause the loadShow again the development over time. For fun try dropping an index and you’ll see it popping up immediately here.
  • #24 That nicely brings me to the deploy overview of newrelic.Every deploy gives you a nice change report.Showing what happened to the speed before and after your deploy.This allows you to quickly spot mistakes landing in production.
  • #25 Shows the average response time before and after your deploy.Also shows things like memory or CPU utilization which will pick major mistakes in those areas.
  • #26 Newrelic does pretty much the same thing for background tasks as for views.You can zoom into the specific components.If yourautoscaling suddenly boots up twice the number of task workers, NewRelic tells you why.
  • #28 So It’s clear I’m exited about New Relic. It’s an awesome tool and helped us a lot with scaling the site.However sometimes you have questions about your data which NewRelic can’t answer.We stick all the metrics we can think of in Graphite.Now NewRelic is really slick. Graphite is designed by engineers and, well looks like this.
  • #29 But it tracks everything you throw at it.And has a very powerful querying interface.Graphite is a data analysis tool. It’s not a dashboard.For instance in this case calls per database server.
  • #31 It’s however a data tool though. And not a dashboard.It has a really techy interface.You use * for wildcardsAnd call functions to run on your data.Quite ugly.
  • #32 You can also retrieve data similar to new relic load time breakdowns.With the added advantage that Graphite is a free tool.
  • #33 It also tracks functional parts of pages.So we see which part of the page is slowing down load times.
  • #34 We track things like loadtime per functionality.We track all database calls.We track 90th percentile loadtimes.Adding new measurements is super easy.
  • #35 Lastly we’re using PgFouineIt’s an awesome tool to get a complete understanding on what your database is actually doing.