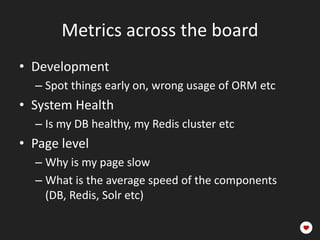
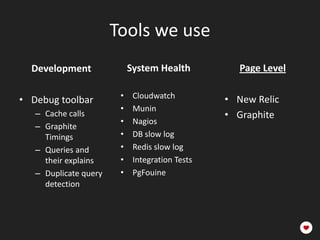
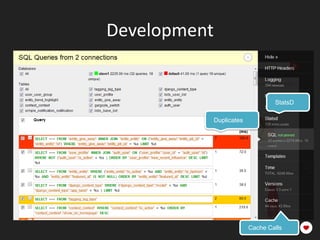
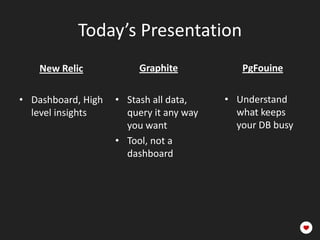
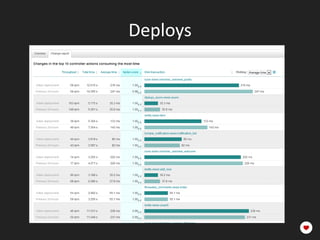
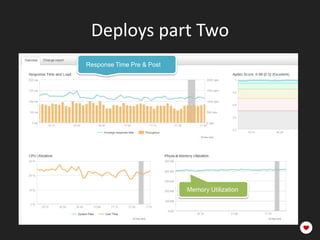
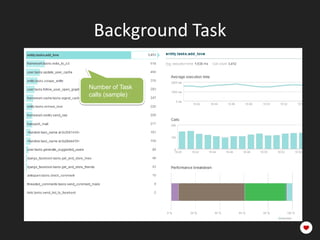
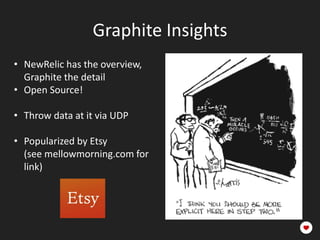
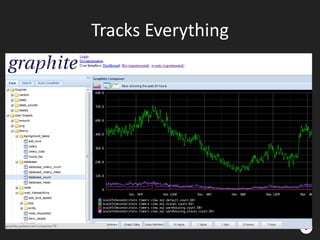
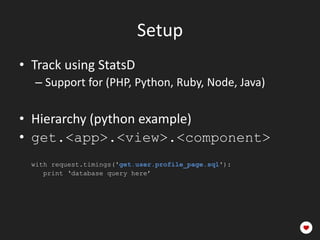
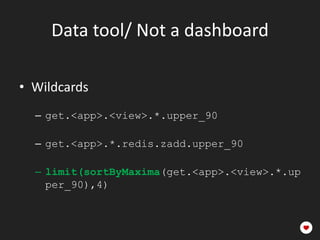
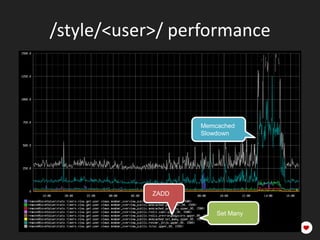
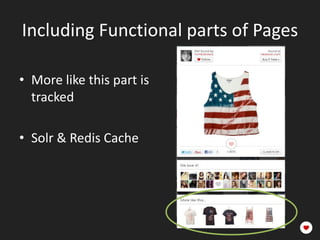
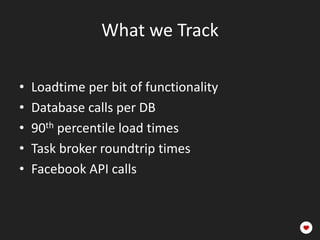
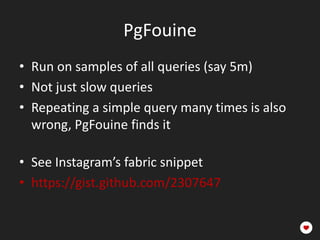
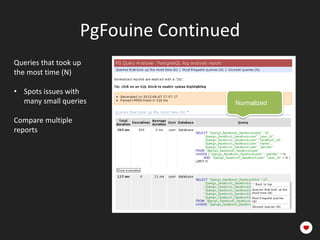
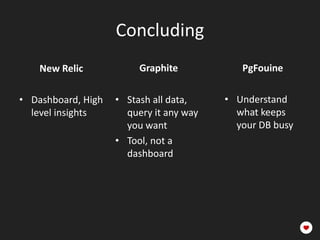
Performance metrics
for a social network
About Me

•   Thierry Schellenbach
•   Founder/ CTO Fashiolista
•   Author of Django Facebook
•   Github/tschellenbach

• Blog: mellowmorning.com
• @tschellenbach
Global Fashion Discovery
5.000.000+
8.000.000+
Growth

2nd largest fashion community

• 1mln members
• 17mln loves/month
• 94mln non-bot pageviews
Powered By

•   Django/Python
•   PostgreSQL
•   Solr
•   Redis
•   Celery
•   AWS/ Ubuntu
•   Nginx/ Gunicorn/ Supervisor
Sexy Metrics driven optimization
Hard Because

• All content is personalized

• Activity is clustered around a few
  users (>100k followers)

• Individual users are insanely
  active (7 hours in a day is
  normal)

• Social network, can’t easily shard
  data
Speed is a Feature
Metrics across the board
• Development
  – Spot things early on, wrong usage of ORM etc
• System Health
  – Is my DB healthy, my Redis cluster etc
• Page level
  – Why is my page slow
  – What is the average speed of the components
    (DB, Redis, Solr etc)
Tools we use
  Development               System Health           Page Level

                        •    Cloudwatch          • New Relic
• Debug toolbar
                        •    Munin
   – Cache calls                                 • Graphite
                        •    Nagios
   – Graphite
     Timings            •    DB slow log
   – Queries and        •    Redis slow log
     their explains     •    Integration Tests
   – Duplicate query    •    PgFouine
     detection
Development


                                   StatsD

              Duplicates


                           Cache Calls
Today’s Presentation
    New Relic            Graphite           PgFouine

• Dashboard, High   • Stash all data,    • Understand
  level insights      query it any way     what keeps
                      you want             your DB busy
                    • Tool, not a
                      dashboard
New Relic

• Frontend -> App ->
  Components (DB, Solr, etc.)
• Breaks page performance
  down into it’s components
• Tracks deploys and compares
  before and after
Are you Supported?

•   Ruby              •   Pip install newrelic
•   Java              •   Edit the .ini
•   .NET              •   Add the WSGI middleware
•   PHP               •   Wait for Magic
•   Python
End user load times
• Drill down all the way to Database calls
• The purple line is our app, the rest frontend
                                  Frontend
                                   (97%)


                                                  App
Global page loads
Page Level
• Average frontend performance per page
• Click to view App level breakdown

                 Page. Not URL.           To App Level
Drill down/ App overview

 History


                          Memcached
               DB Query
Database
        • See which tables are
          under most load
        • See which pages cause the
          load


• Development over time
Deploys
Deploys part Two
Response Time Pre & Post


                           Memory Utilization
Background Task

Number of Task
calls (sample)
Graphite Insights
• NewRelic has the overview,
  Graphite the detail
• Open Source!

• Throw data at it via UDP

• Popularized by Etsy
  (see mellowmorning.com for
  link)
It’s Complicated
Tracks Everything
Setup
• Track using StatsD
  – Support for (PHP, Python, Ruby, Node, Java)

• Hierarchy (python example)
• get.<app>.<view>.<component>
  with request.timings('get.user.profile_page.sql'):
     print ‘database query here’
Data tool/ Not a dashboard

• Wildcards
  – get.<app>.<view>.*.upper_90

  – get.<app>.*.redis.zadd.upper_90

  – limit(sortByMaxima(get.<app>.<view>.*.up
    per_90),4)
/style/<user>/ performance


                   Memcached
                   Slowdown


            ZADD


                       Set Many
Including Functional parts of Pages

• More like this part is
  tracked

• Solr & Redis Cache
What we Track

•   Loadtime per bit of functionality
•   Database calls per DB
•   90th percentile load times
•   Task broker roundtrip times
•   Facebook API calls
PgFouine
• Run on samples of all queries (say 5m)
• Not just slow queries
• Repeating a simple query many times is also
  wrong, PgFouine finds it

• See Instagram’s fabric snippet
• https://gist.github.com/2307647
PgFouine Continued
Queries that took up
the most time (N)

• Spots issues with
  many small queries                Normalized

Compare multiple
reports
PgFouine Tips

• My colleague wrote a fast C++ version
• github.com/WoLpH/pg_query_analyser

  Also look at:
• Pg Stat Statement
• Pg Badger
Concluding
    New Relic            Graphite           PgFouine

• Dashboard, High   • Stash all data,    • Understand
  level insights      query it any way     what keeps
                      you want             your DB busy
                    • Tool, not a
                      dashboard
Q&A

We’re Searching for Django Developers & Linux
system administrators!

              Fashiolista.com/jobs

Open source projects:

            Github.com/tschellenbach
               Try Django Facebook!

Fashiolista

  • 1.
  • 2.
    About Me • Thierry Schellenbach • Founder/ CTO Fashiolista • Author of Django Facebook • Github/tschellenbach • Blog: mellowmorning.com • @tschellenbach
  • 3.
  • 7.
  • 8.
    Growth 2nd largest fashioncommunity • 1mln members • 17mln loves/month • 94mln non-bot pageviews
  • 9.
    Powered By • Django/Python • PostgreSQL • Solr • Redis • Celery • AWS/ Ubuntu • Nginx/ Gunicorn/ Supervisor
  • 10.
    Sexy Metrics drivenoptimization Hard Because • All content is personalized • Activity is clustered around a few users (>100k followers) • Individual users are insanely active (7 hours in a day is normal) • Social network, can’t easily shard data
  • 11.
    Speed is aFeature
  • 12.
    Metrics across theboard • Development – Spot things early on, wrong usage of ORM etc • System Health – Is my DB healthy, my Redis cluster etc • Page level – Why is my page slow – What is the average speed of the components (DB, Redis, Solr etc)
  • 13.
    Tools we use Development System Health Page Level • Cloudwatch • New Relic • Debug toolbar • Munin – Cache calls • Graphite • Nagios – Graphite Timings • DB slow log – Queries and • Redis slow log their explains • Integration Tests – Duplicate query • PgFouine detection
  • 14.
    Development StatsD Duplicates Cache Calls
  • 15.
    Today’s Presentation New Relic Graphite PgFouine • Dashboard, High • Stash all data, • Understand level insights query it any way what keeps you want your DB busy • Tool, not a dashboard
  • 16.
    New Relic • Frontend-> App -> Components (DB, Solr, etc.) • Breaks page performance down into it’s components • Tracks deploys and compares before and after
  • 17.
    Are you Supported? • Ruby • Pip install newrelic • Java • Edit the .ini • .NET • Add the WSGI middleware • PHP • Wait for Magic • Python
  • 18.
    End user loadtimes • Drill down all the way to Database calls • The purple line is our app, the rest frontend Frontend (97%) App
  • 19.
  • 20.
    Page Level • Averagefrontend performance per page • Click to view App level breakdown Page. Not URL. To App Level
  • 21.
    Drill down/ Appoverview History Memcached DB Query
  • 22.
    Database • See which tables are under most load • See which pages cause the load • Development over time
  • 23.
  • 24.
    Deploys part Two ResponseTime Pre & Post Memory Utilization
  • 25.
    Background Task Number ofTask calls (sample)
  • 26.
    Graphite Insights • NewRelichas the overview, Graphite the detail • Open Source! • Throw data at it via UDP • Popularized by Etsy (see mellowmorning.com for link)
  • 27.
  • 28.
  • 29.
    Setup • Track usingStatsD – Support for (PHP, Python, Ruby, Node, Java) • Hierarchy (python example) • get.<app>.<view>.<component> with request.timings('get.user.profile_page.sql'): print ‘database query here’
  • 30.
    Data tool/ Nota dashboard • Wildcards – get.<app>.<view>.*.upper_90 – get.<app>.*.redis.zadd.upper_90 – limit(sortByMaxima(get.<app>.<view>.*.up per_90),4)
  • 31.
    /style/<user>/ performance Memcached Slowdown ZADD Set Many
  • 32.
    Including Functional partsof Pages • More like this part is tracked • Solr & Redis Cache
  • 33.
    What we Track • Loadtime per bit of functionality • Database calls per DB • 90th percentile load times • Task broker roundtrip times • Facebook API calls
  • 34.
    PgFouine • Run onsamples of all queries (say 5m) • Not just slow queries • Repeating a simple query many times is also wrong, PgFouine finds it • See Instagram’s fabric snippet • https://gist.github.com/2307647
  • 35.
    PgFouine Continued Queries thattook up the most time (N) • Spots issues with many small queries Normalized Compare multiple reports
  • 36.
    PgFouine Tips • Mycolleague wrote a fast C++ version • github.com/WoLpH/pg_query_analyser Also look at: • Pg Stat Statement • Pg Badger
  • 37.
    Concluding New Relic Graphite PgFouine • Dashboard, High • Stash all data, • Understand level insights query it any way what keeps you want your DB busy • Tool, not a dashboard
  • 38.
    Q&A We’re Searching forDjango Developers & Linux system administrators! Fashiolista.com/jobs Open source projects: Github.com/tschellenbach Try Django Facebook!