Downloaded 200 times
![Department of Earth Sciences KFUPM Introduction to Seismology Reservoir Induced Seismicity ( Reading Assignment: pp.384-386 ) Introduction to Seismology-KFUPM Ali Oncel [email_address]](https://image.slidesharecdn.com/lecture16-091219191000-phpapp02/85/ONCEL-AKADEMI-INTRODUCTION-TO-SEISMOLOGY-1-320.jpg)
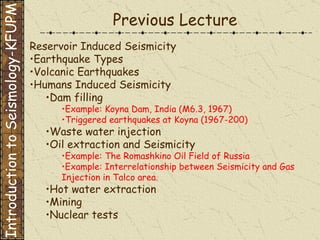
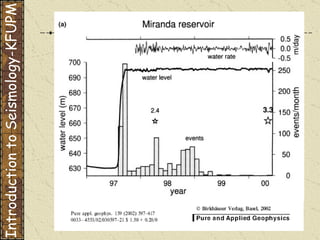
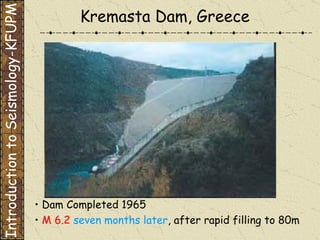
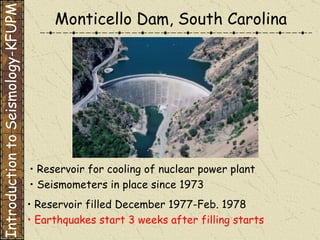
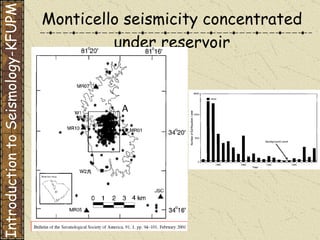


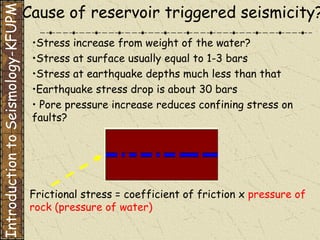

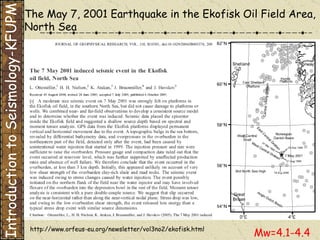
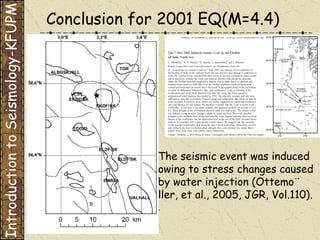
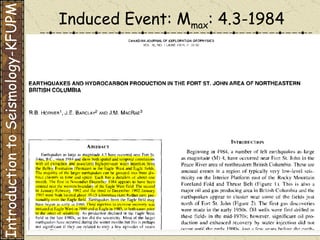


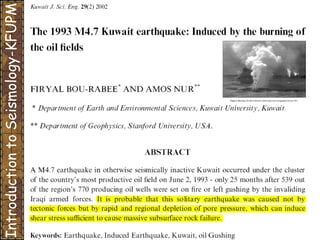
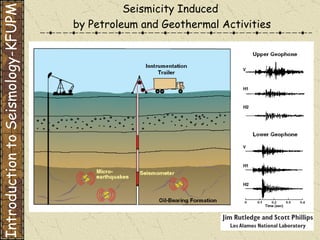


The document discusses different types of human-induced seismicity including reservoir-induced seismicity from dam filling and wastewater injection. It provides several examples of seismic events likely triggered by reservoir filling or fluid injection and withdrawal. These include the 1967 M6.3 earthquake in India following the filling of the Koyna Dam and smaller earthquakes at the Monticello Dam in South Carolina correlated with reservoir filling. The document also examines seismicity related to oil and gas extraction and links some events to changes in pore pressure and subsurface stress fields from these activities.