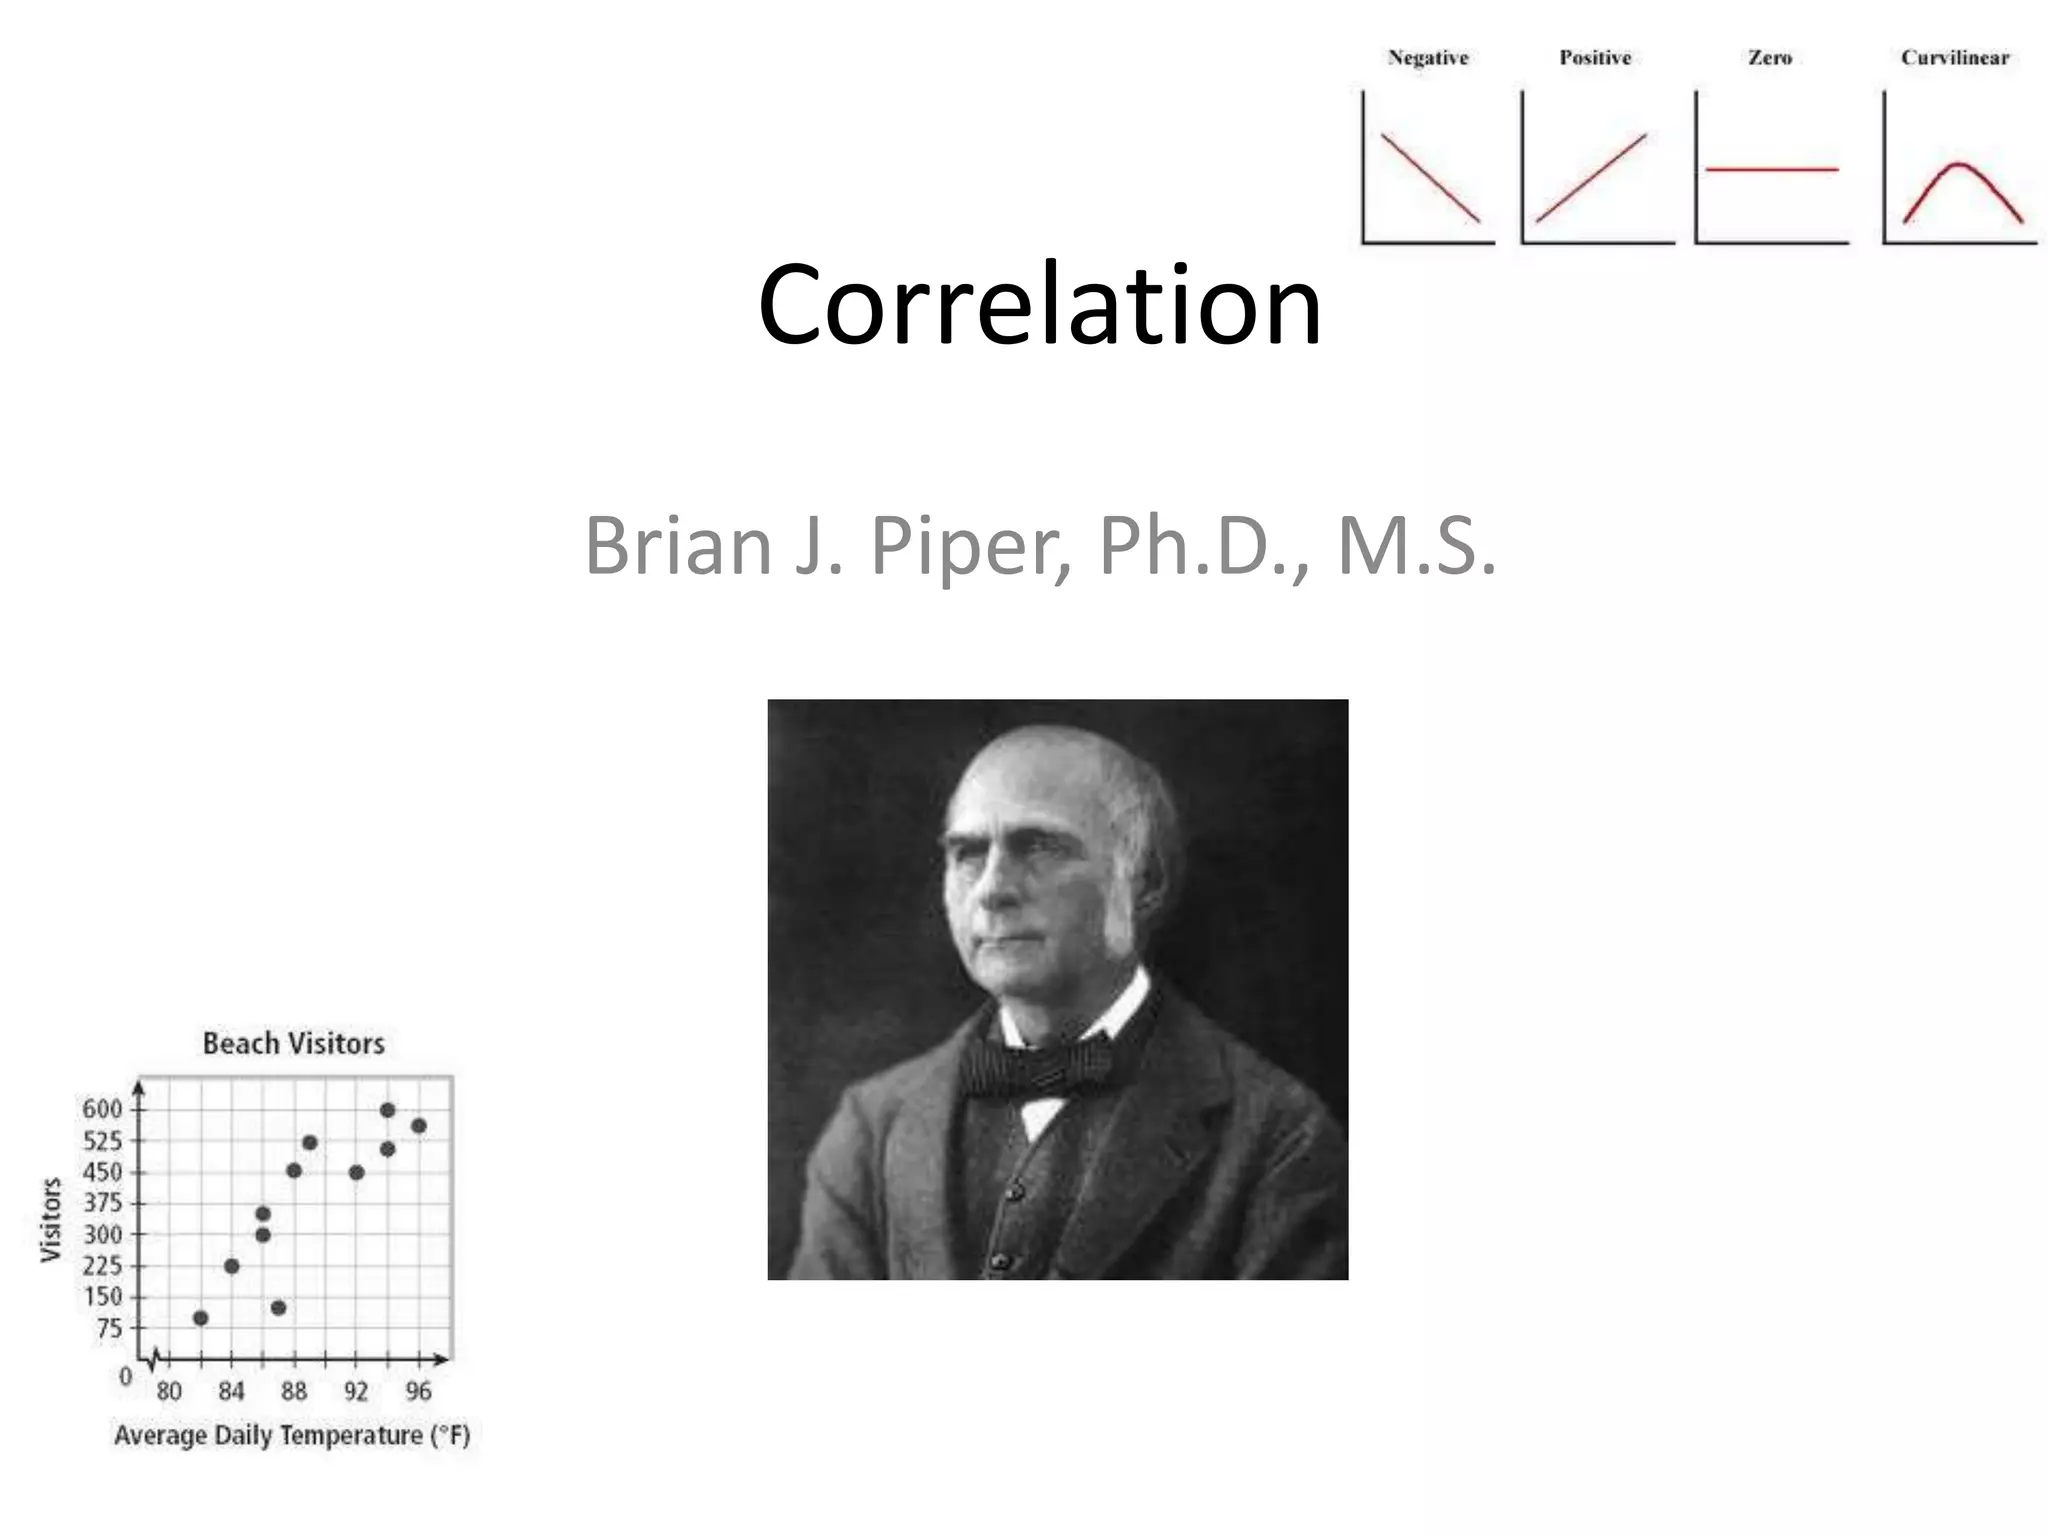
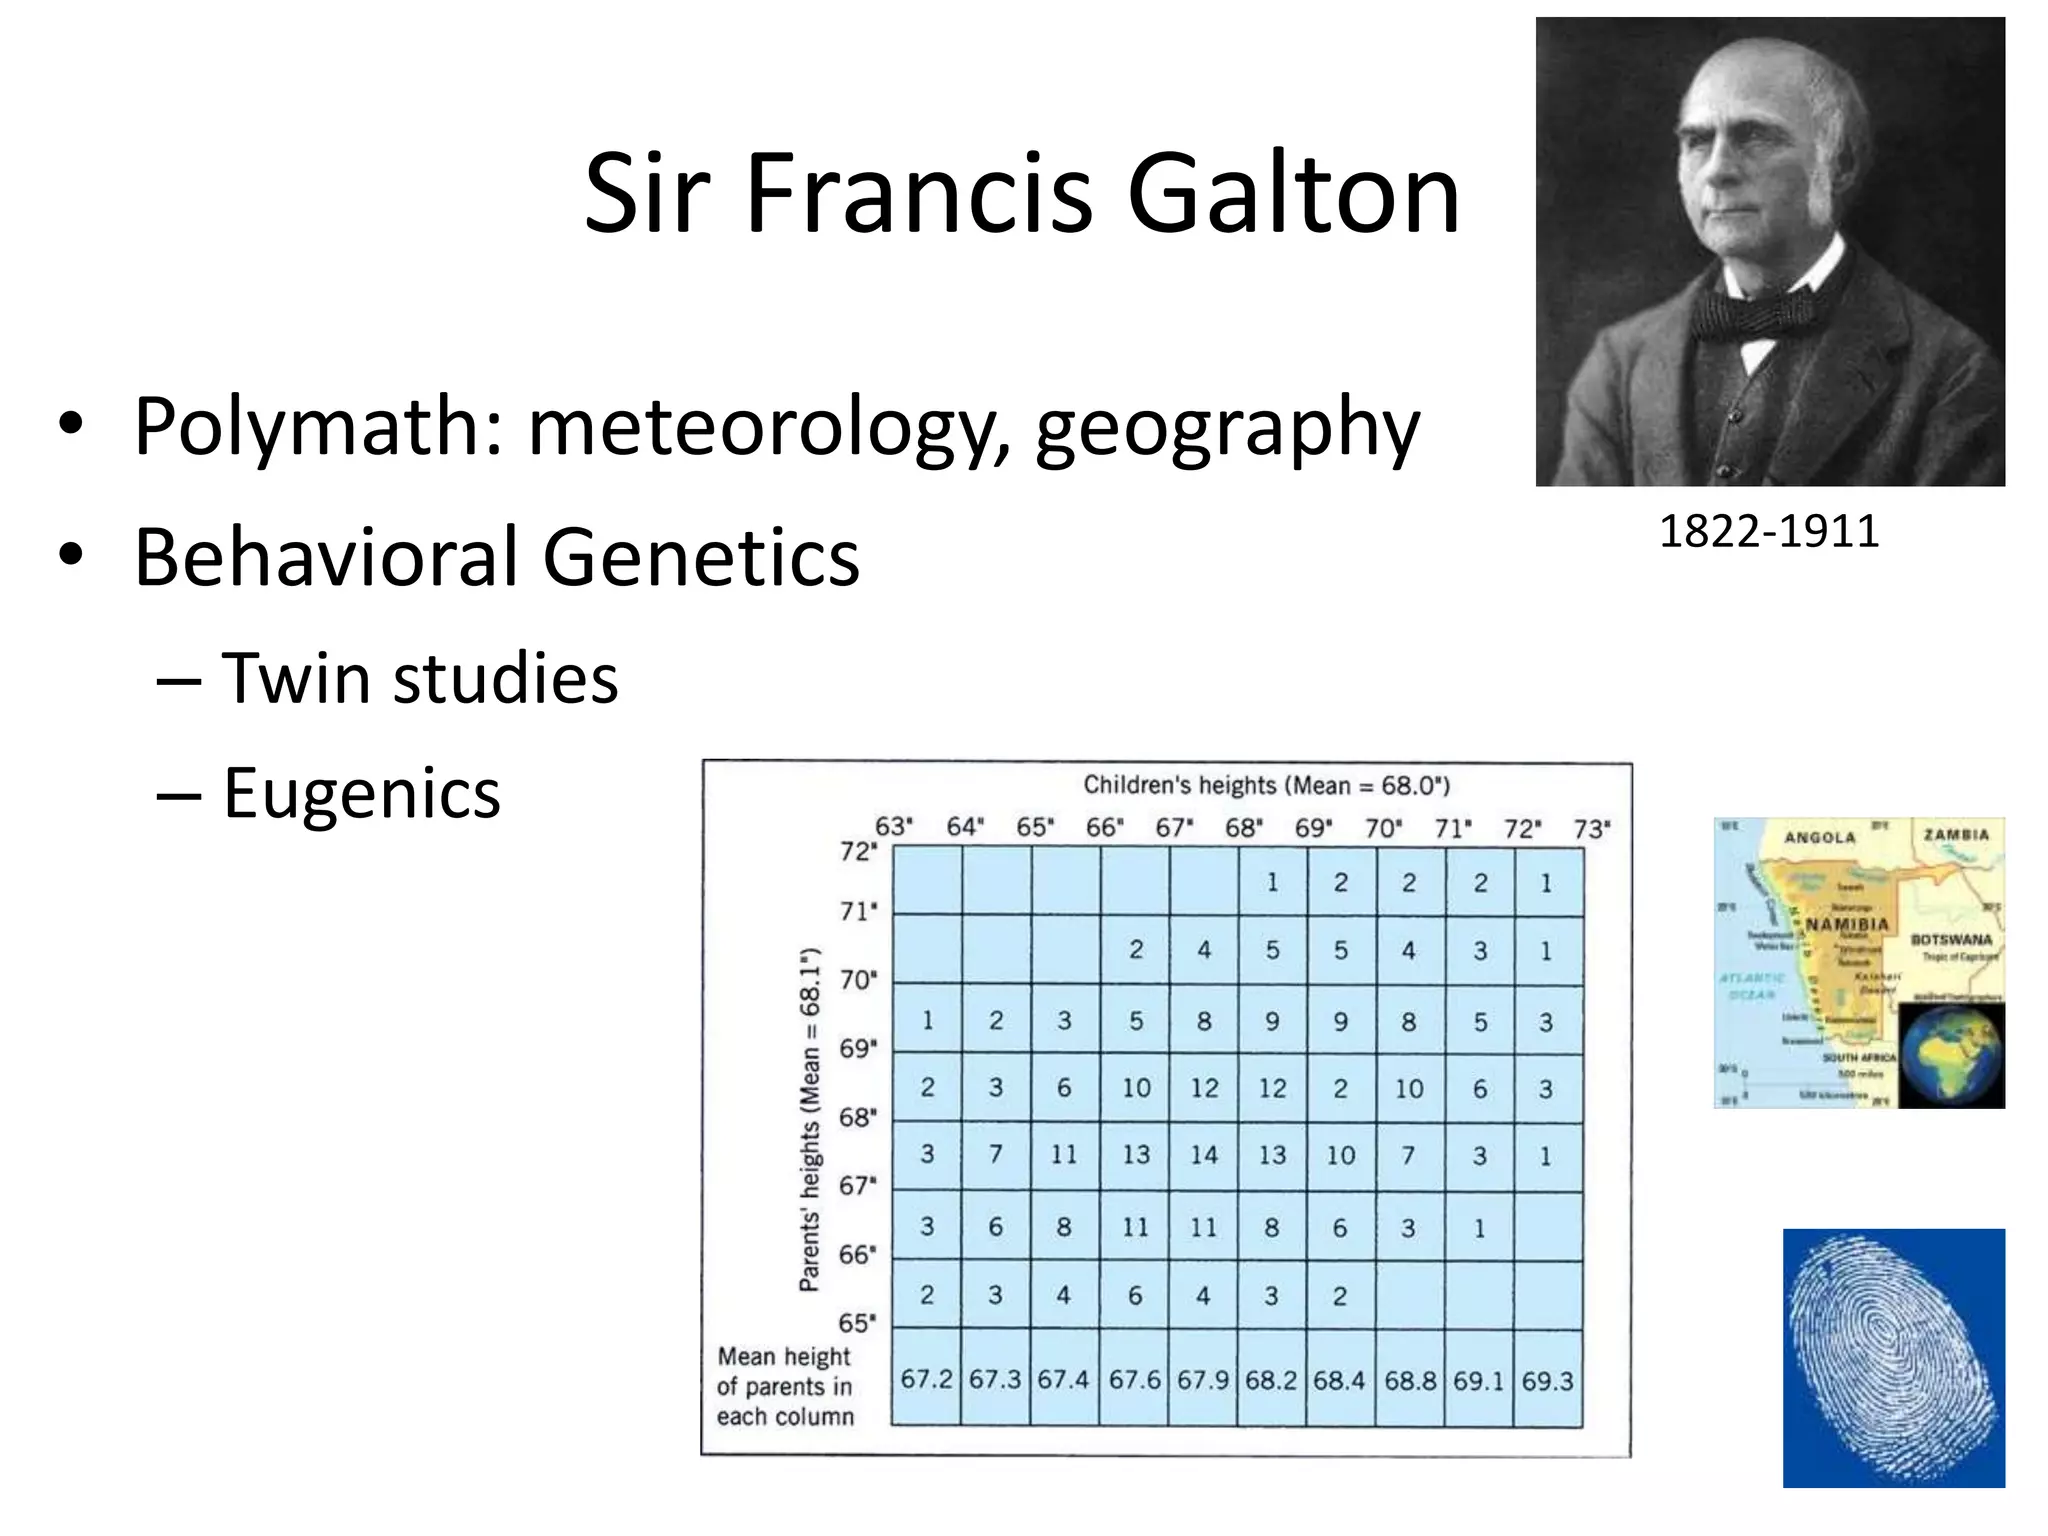
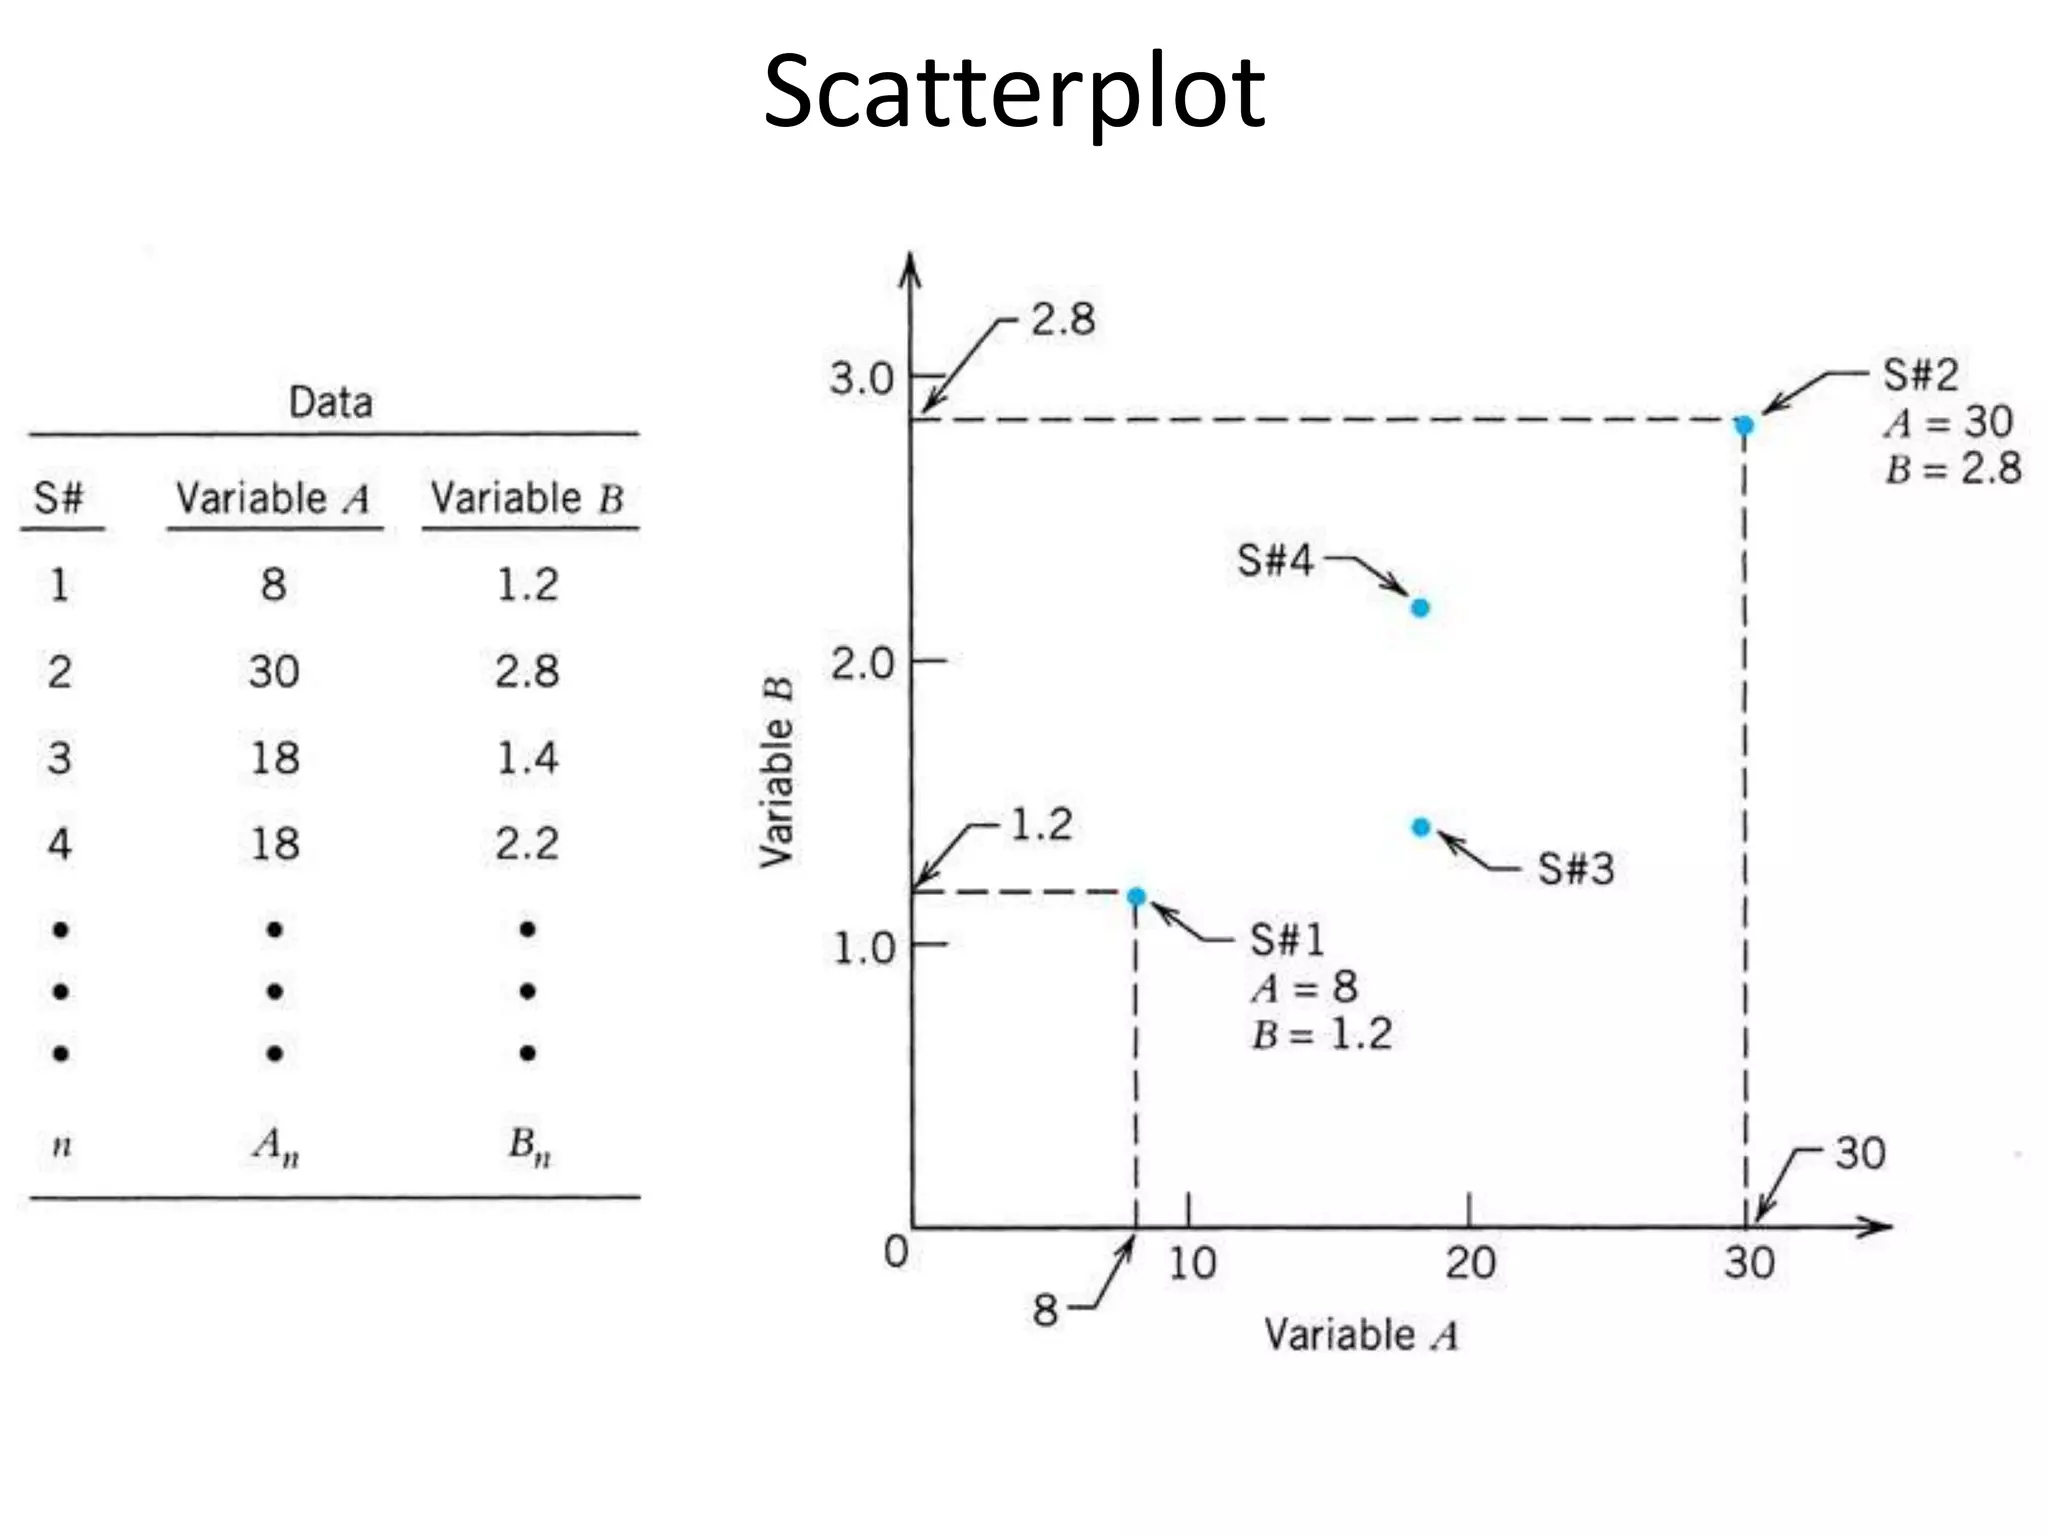
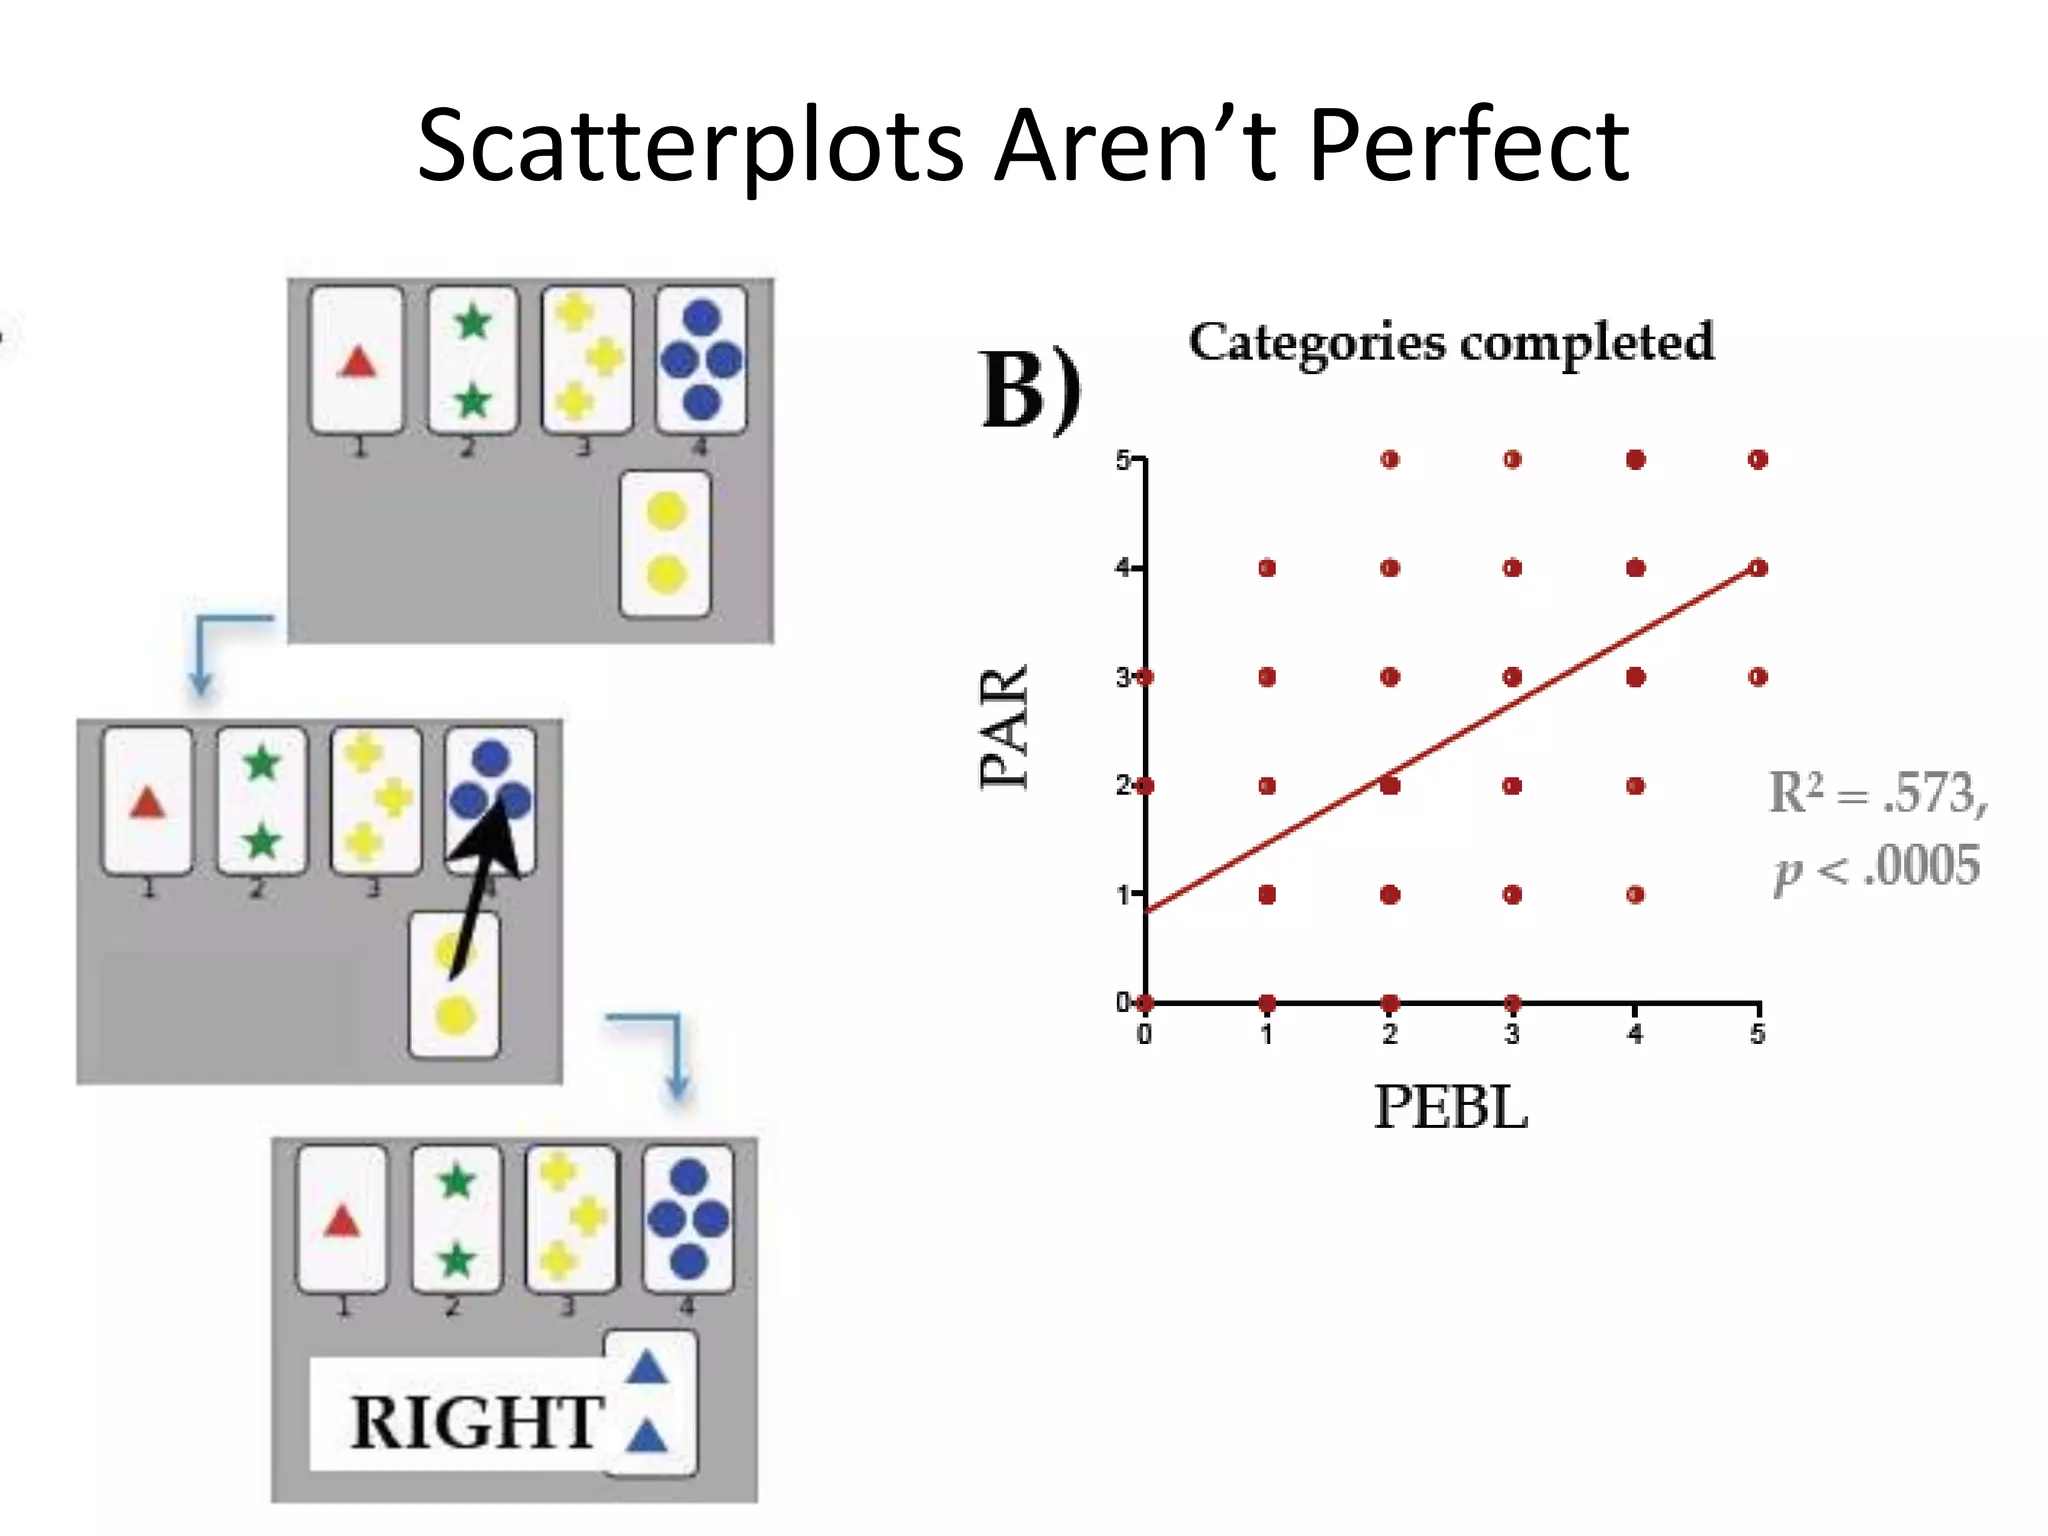
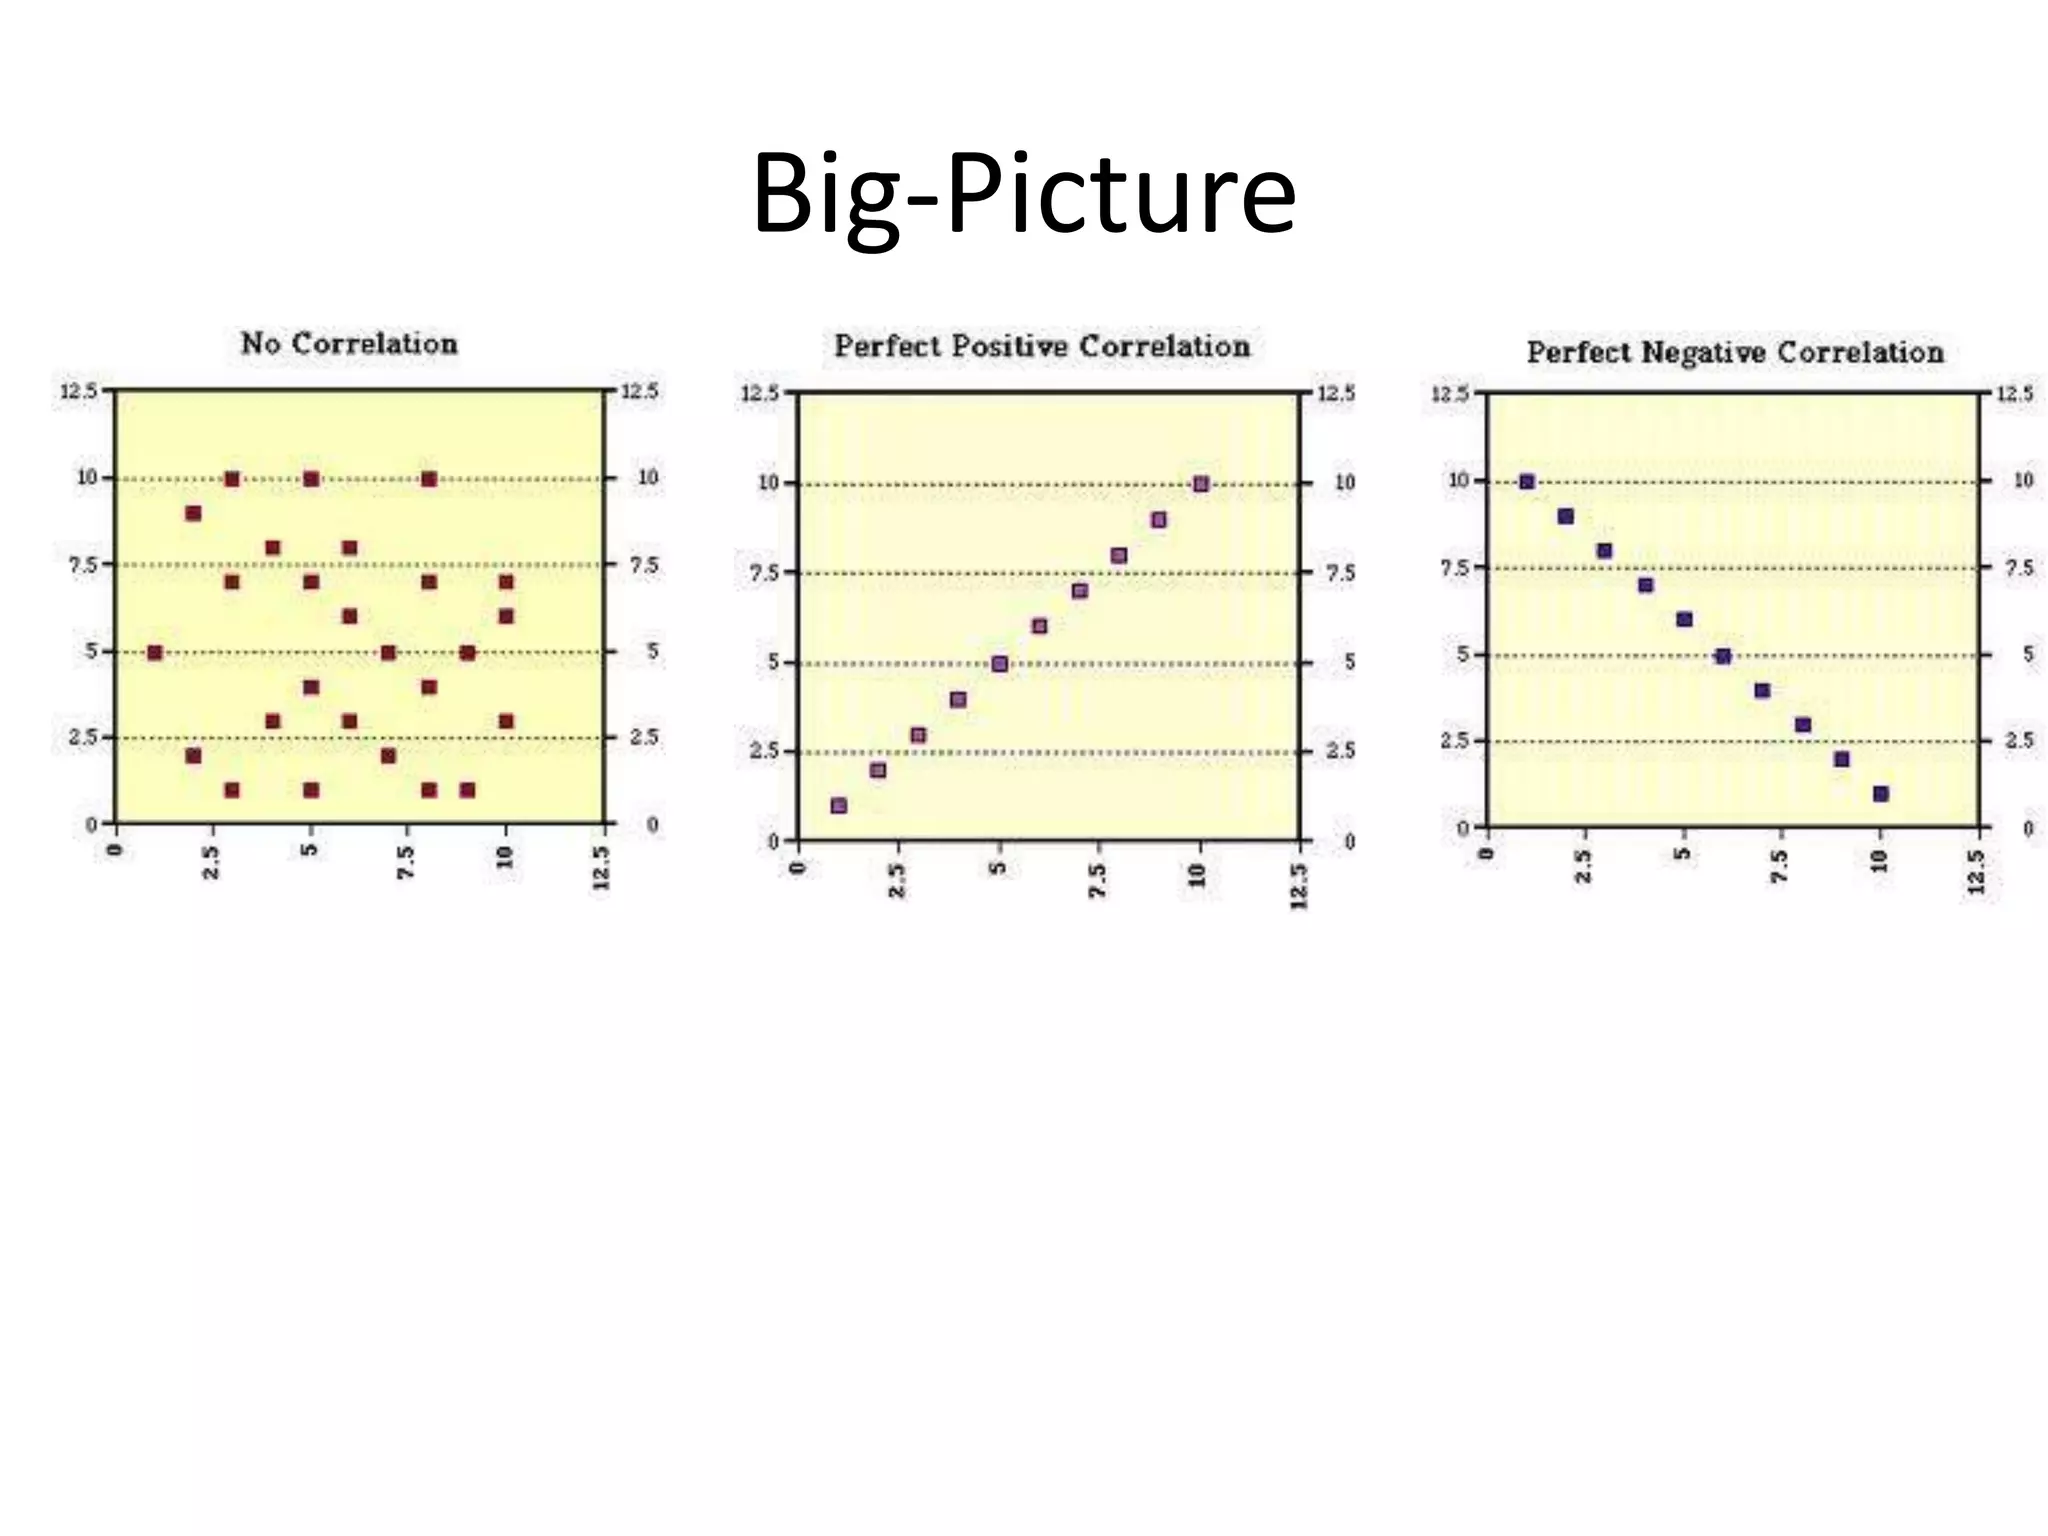
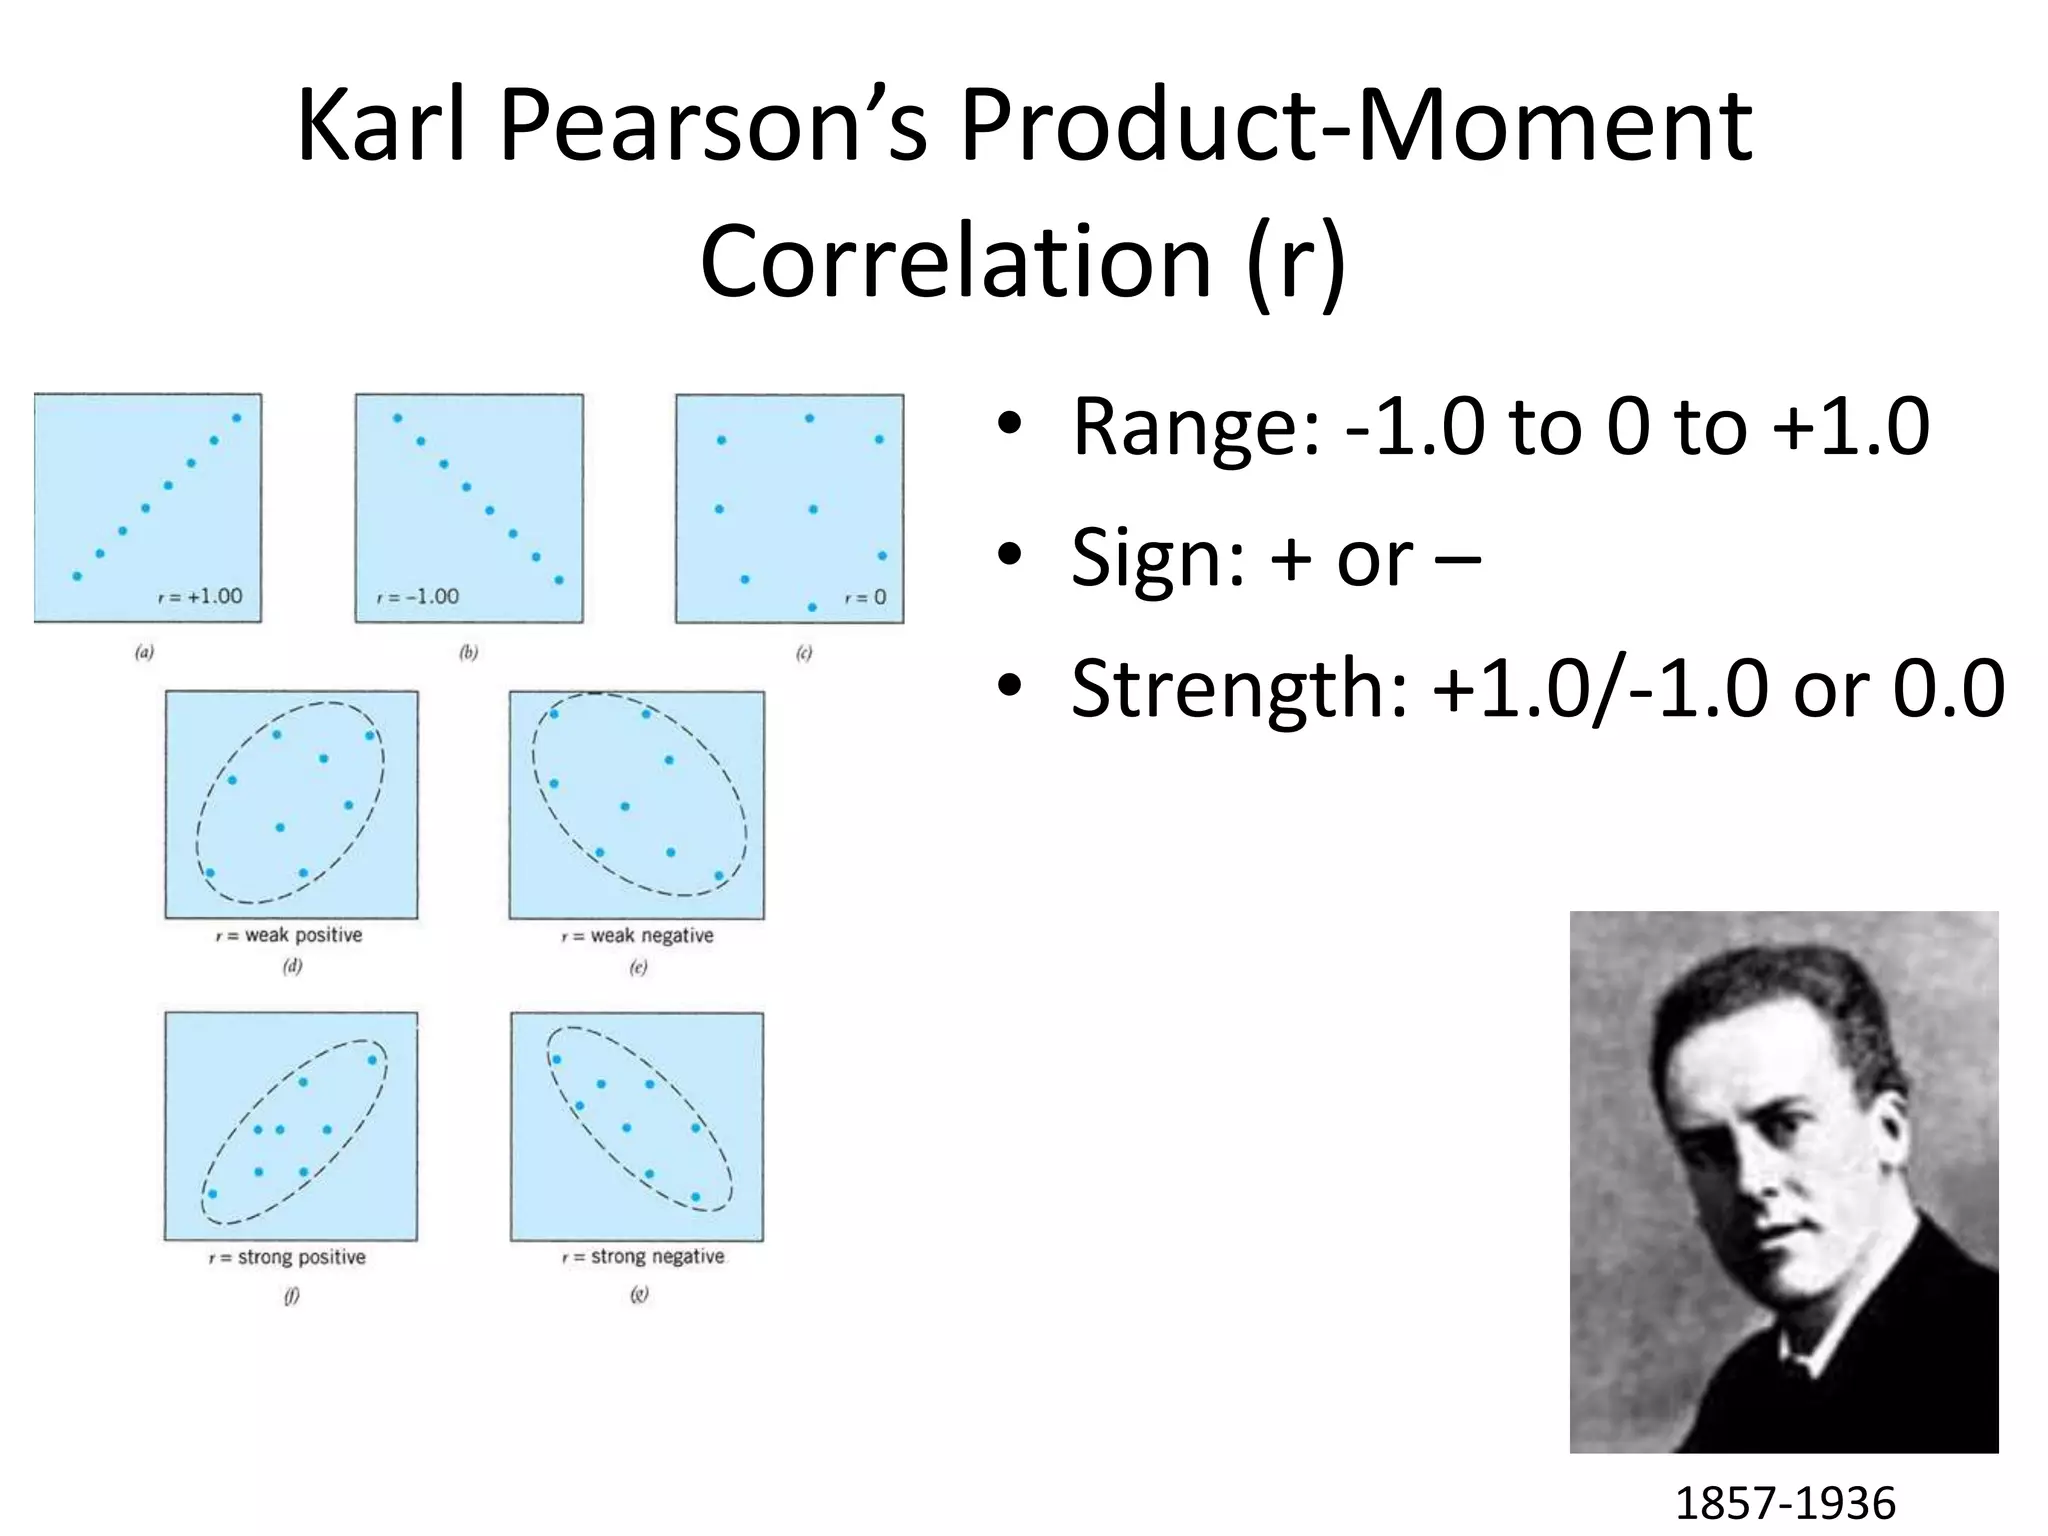
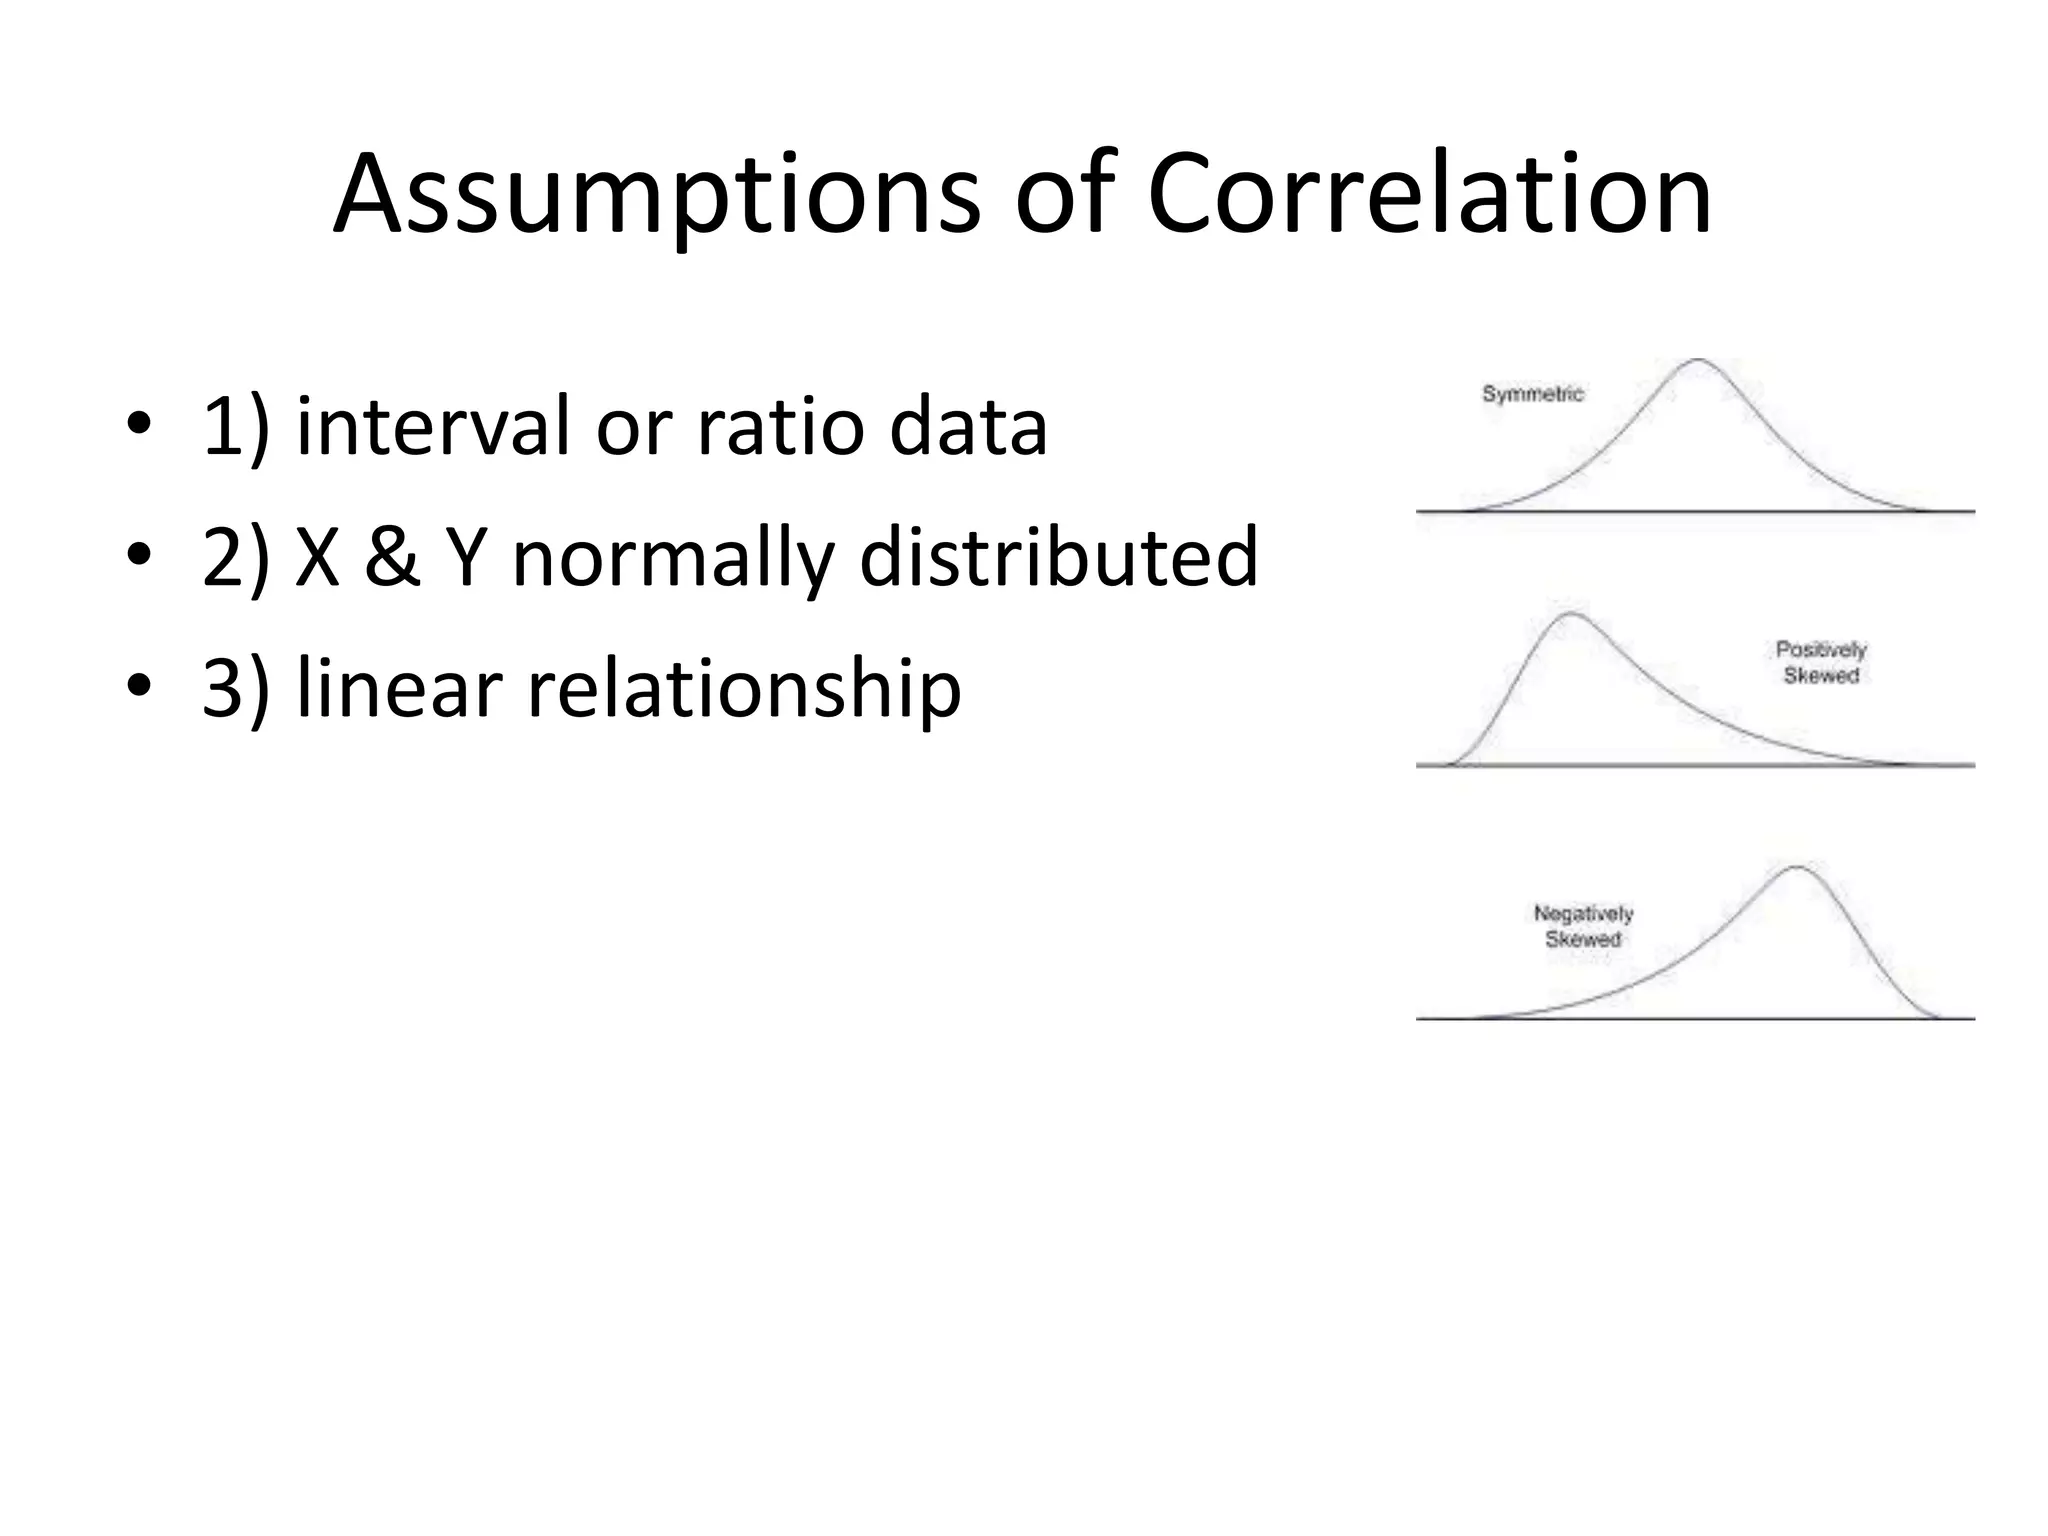
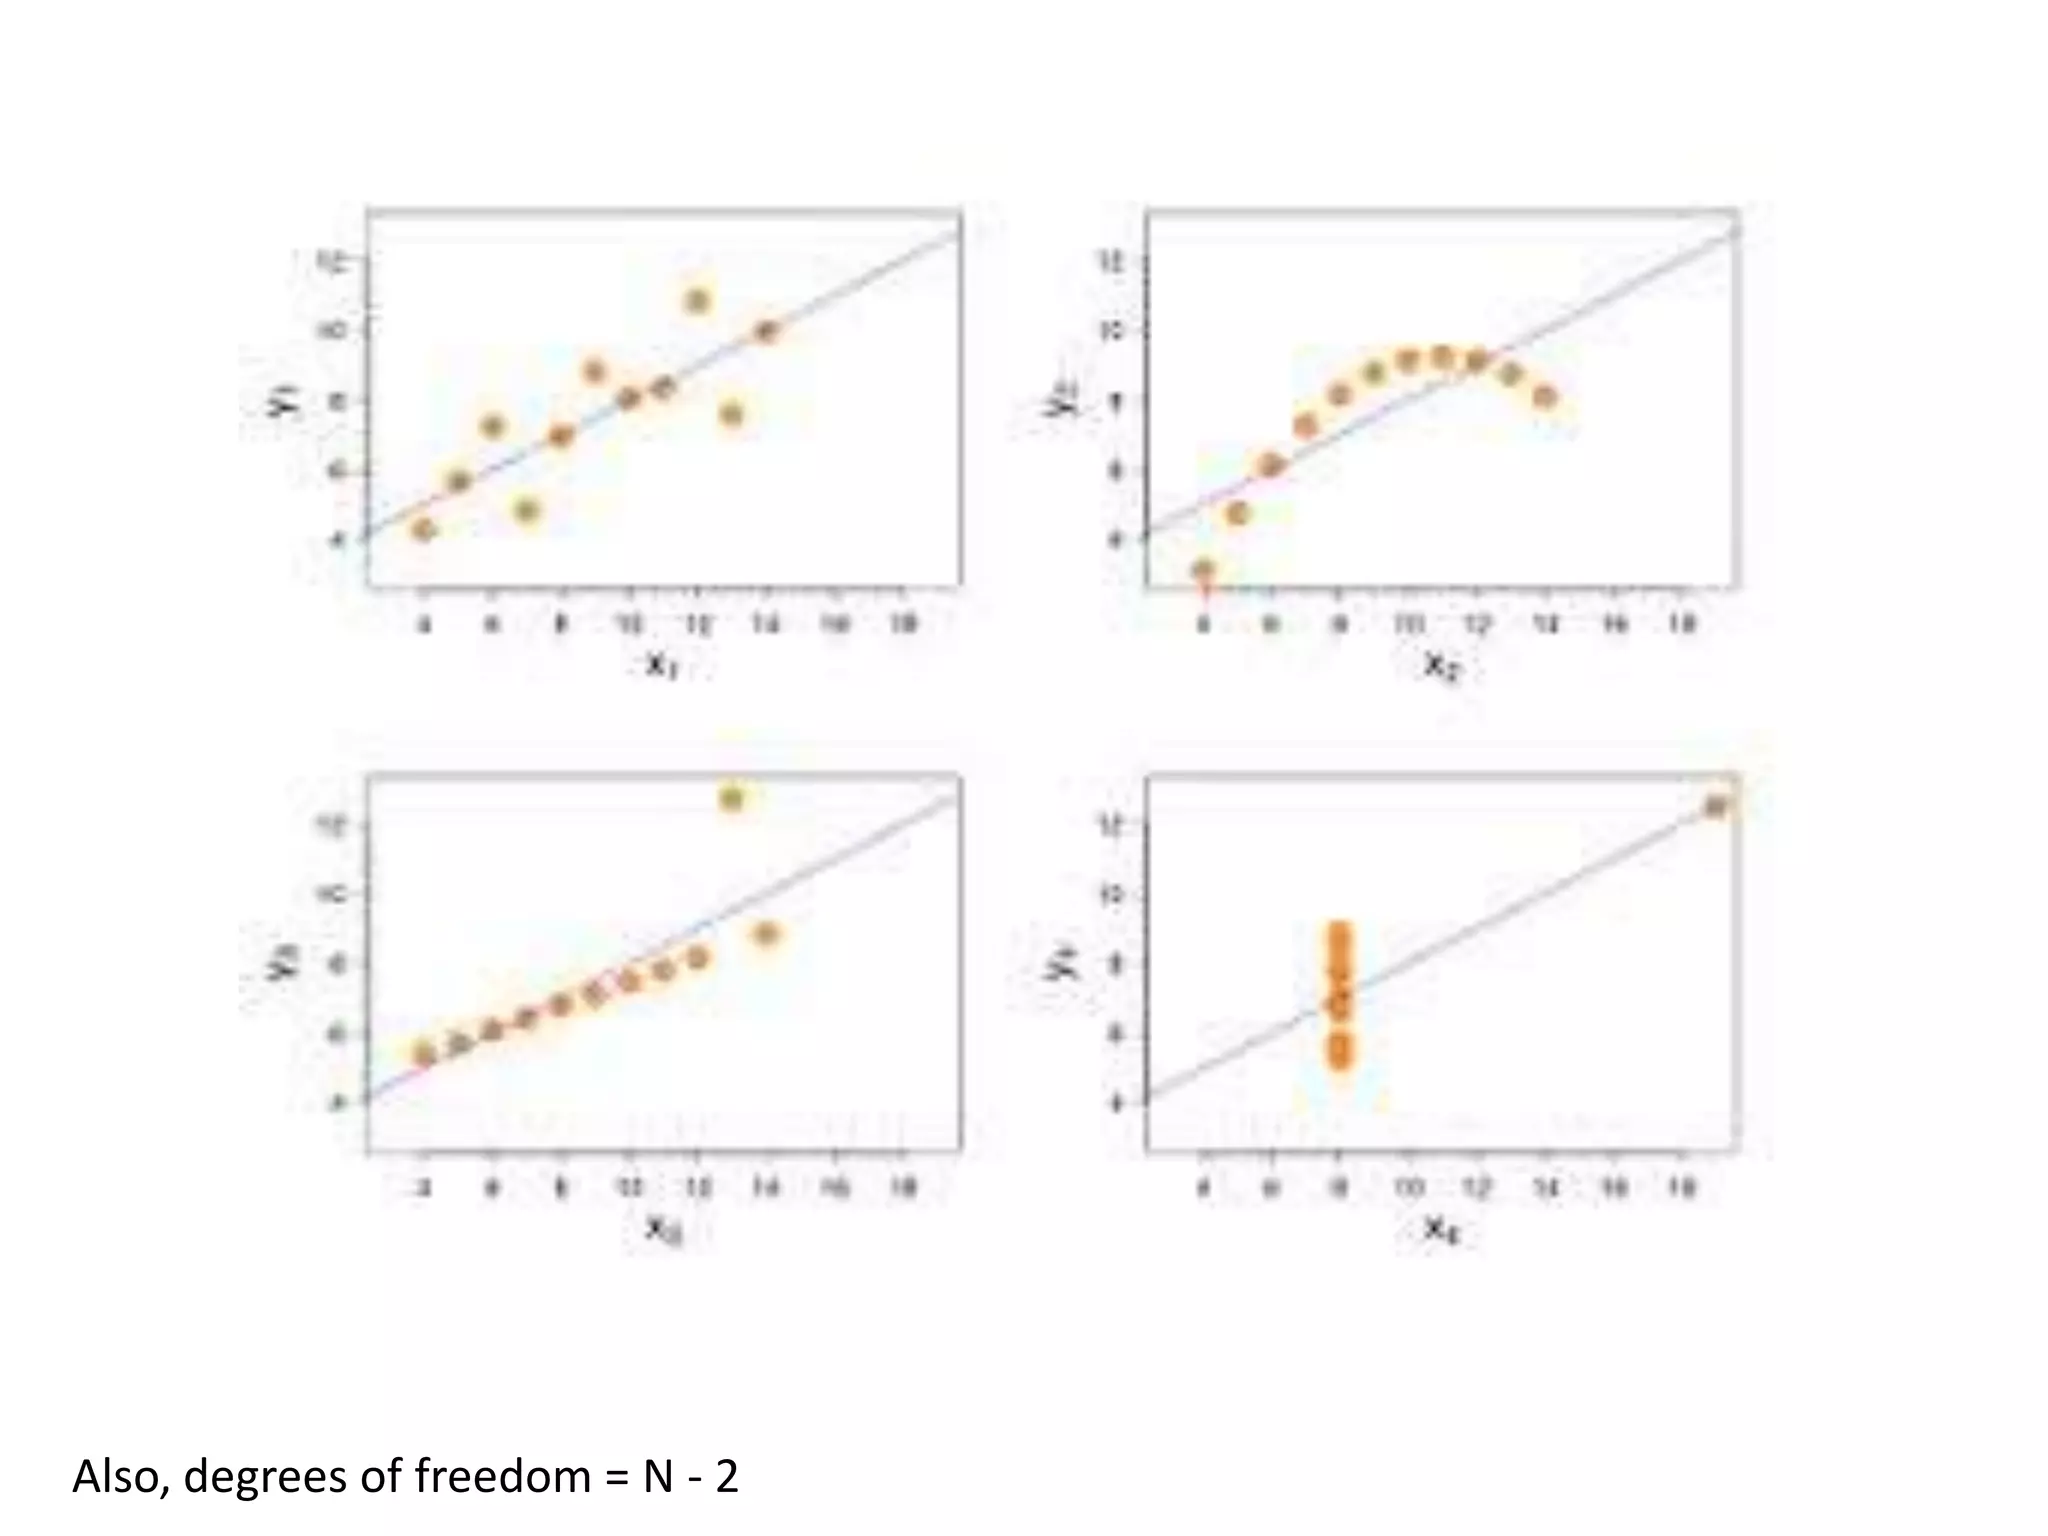
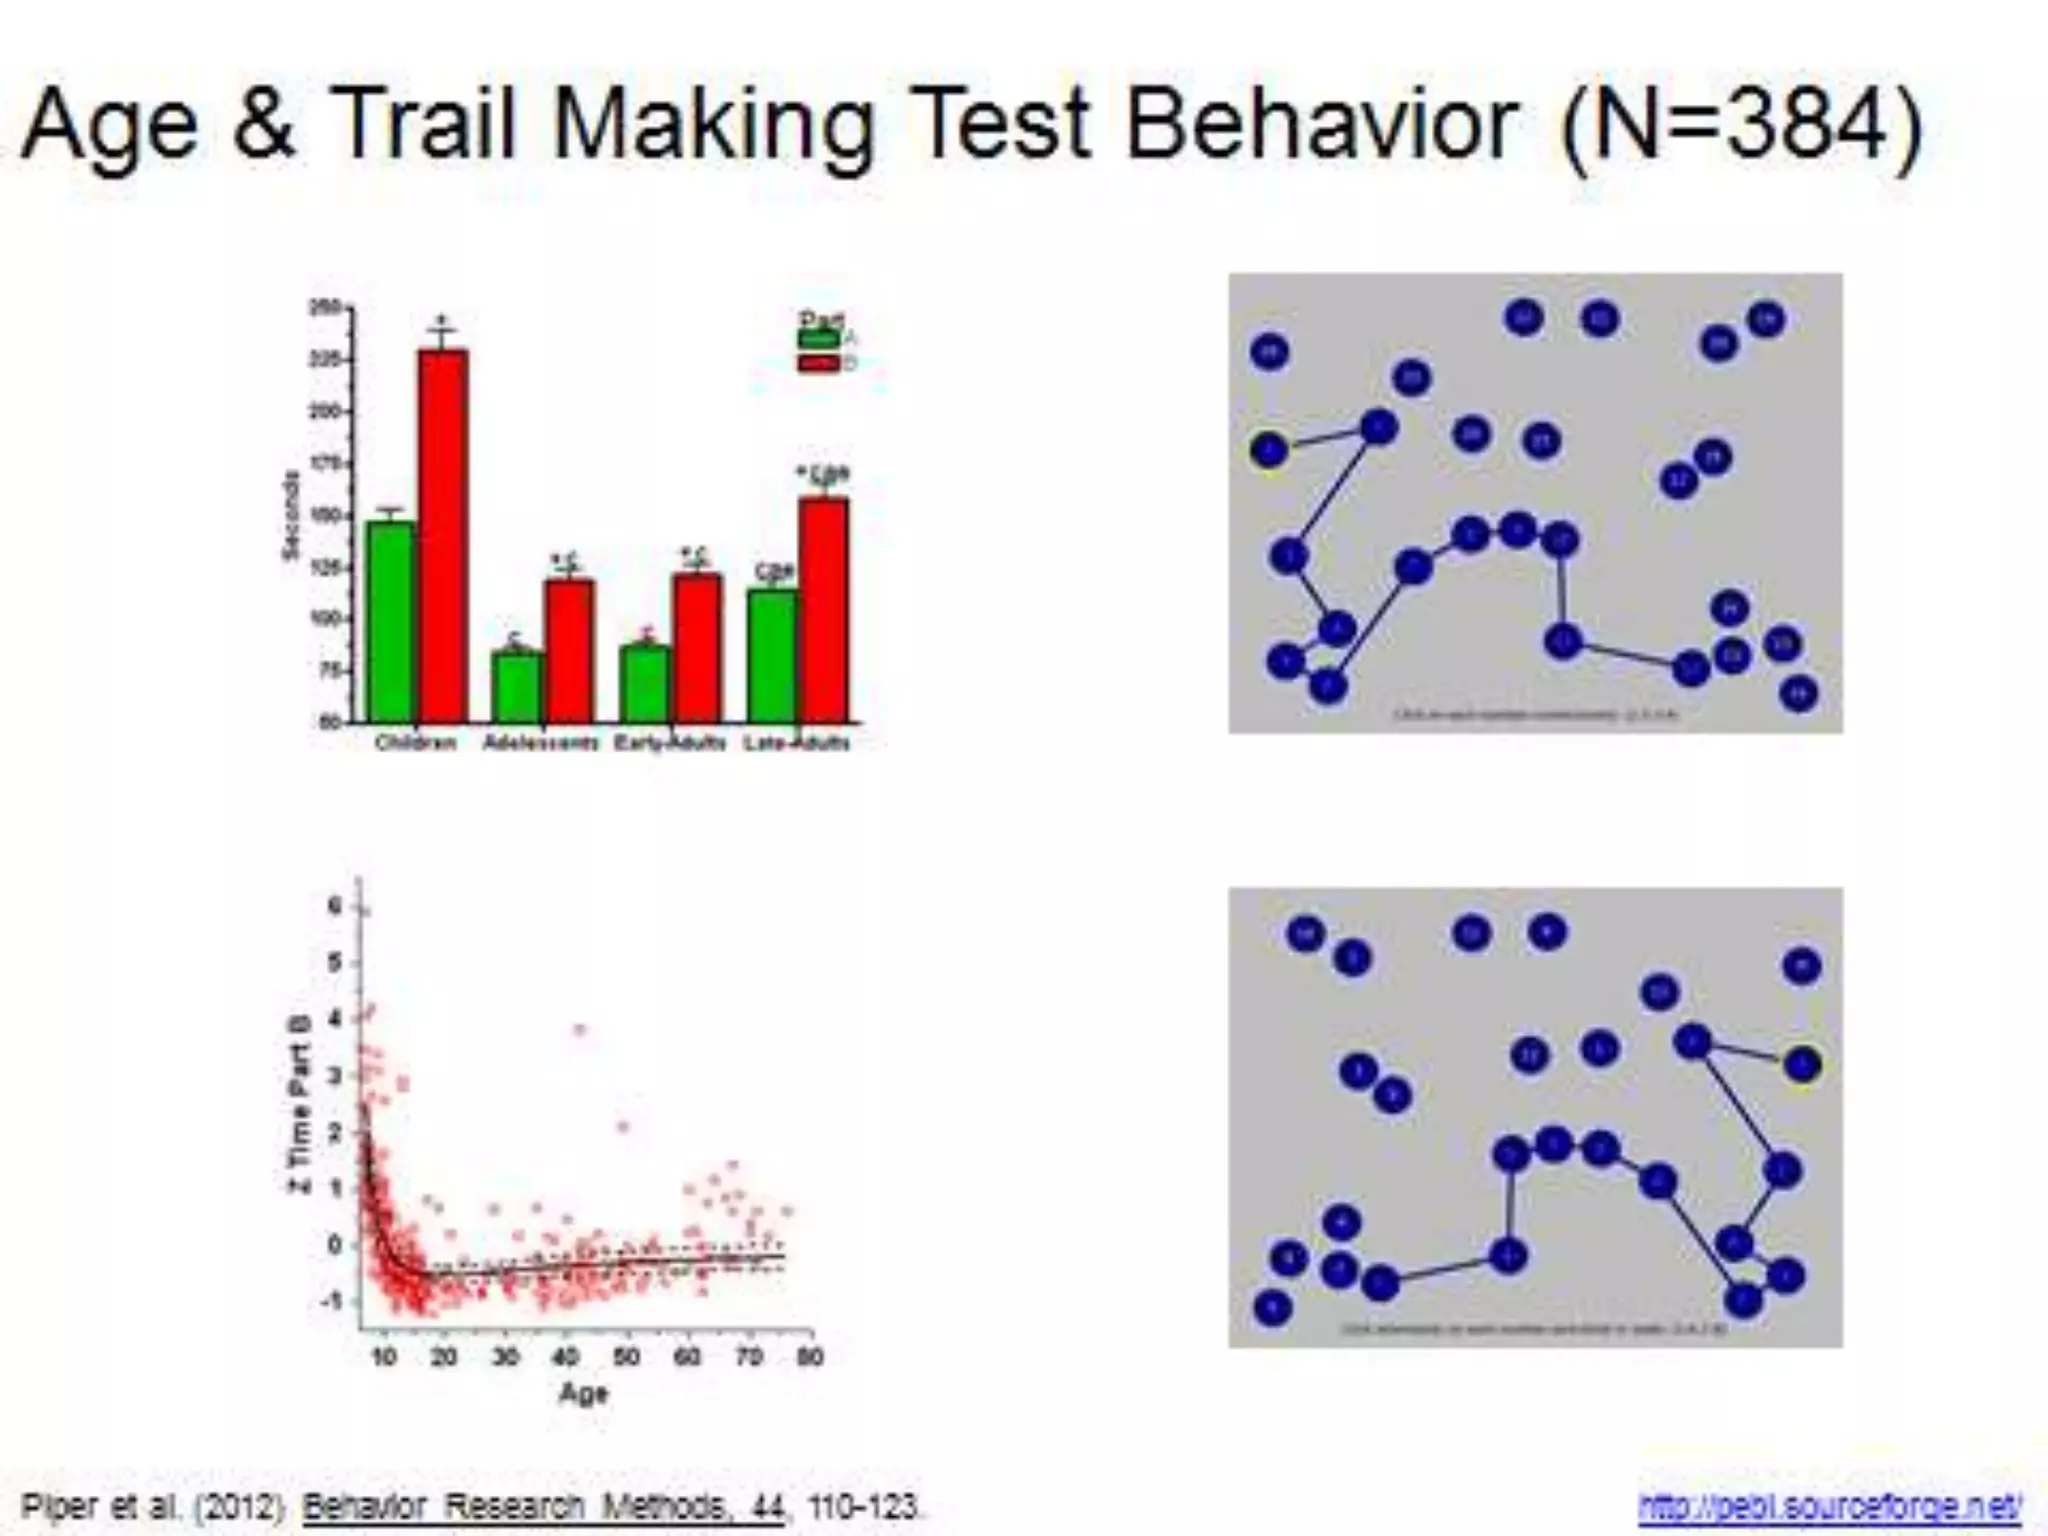
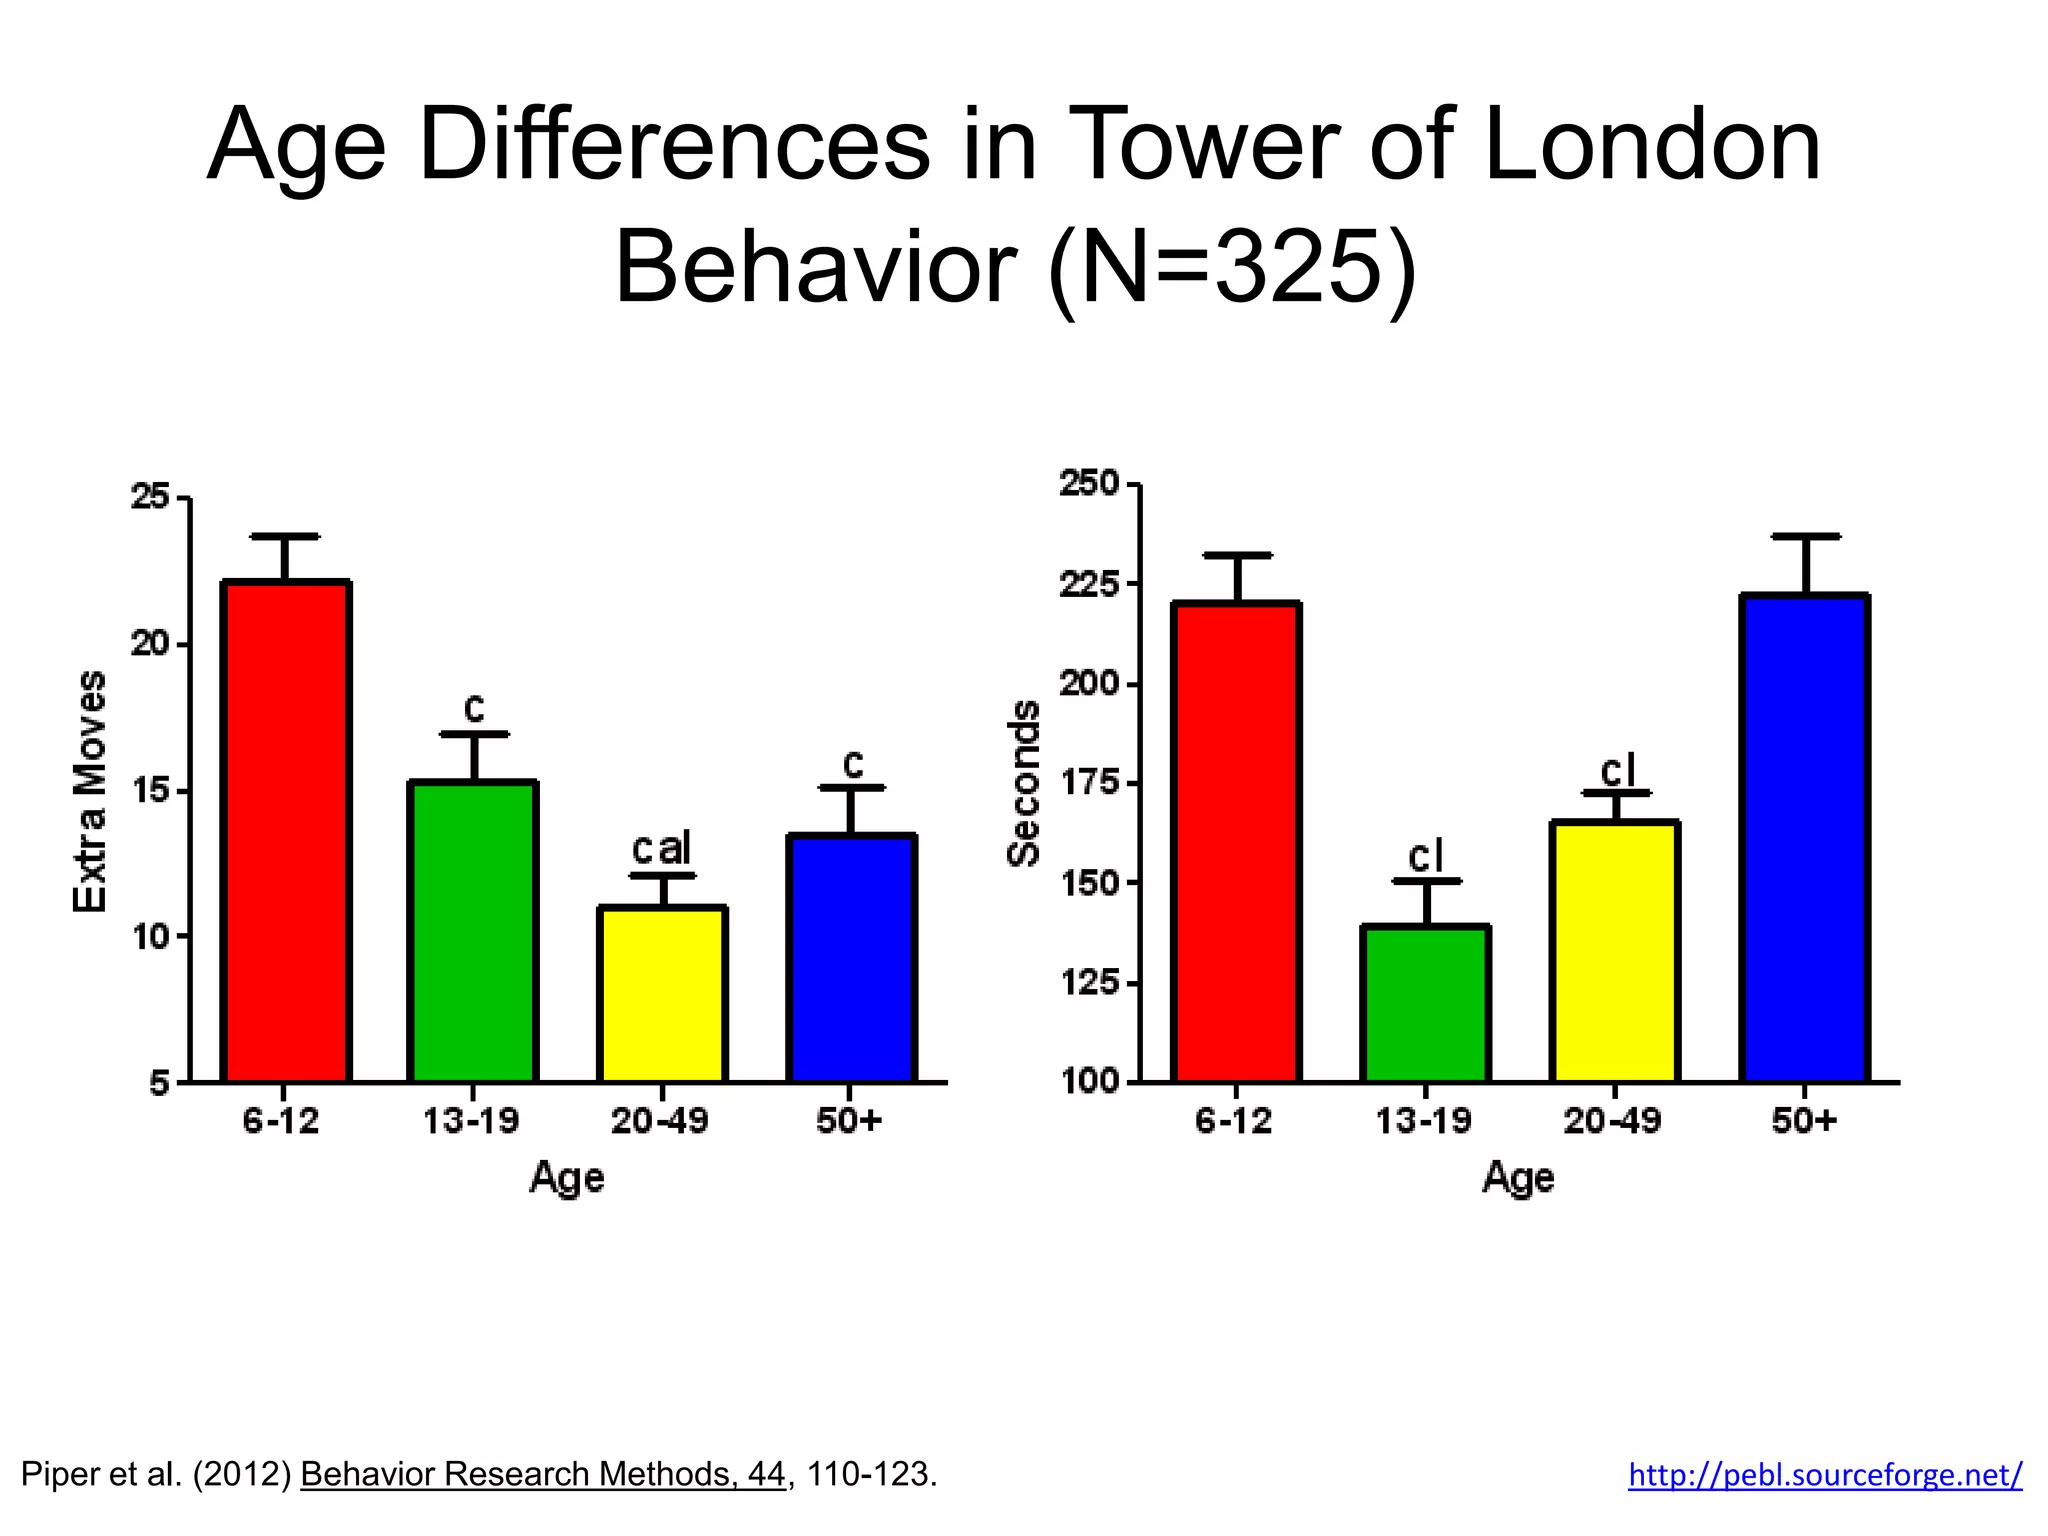
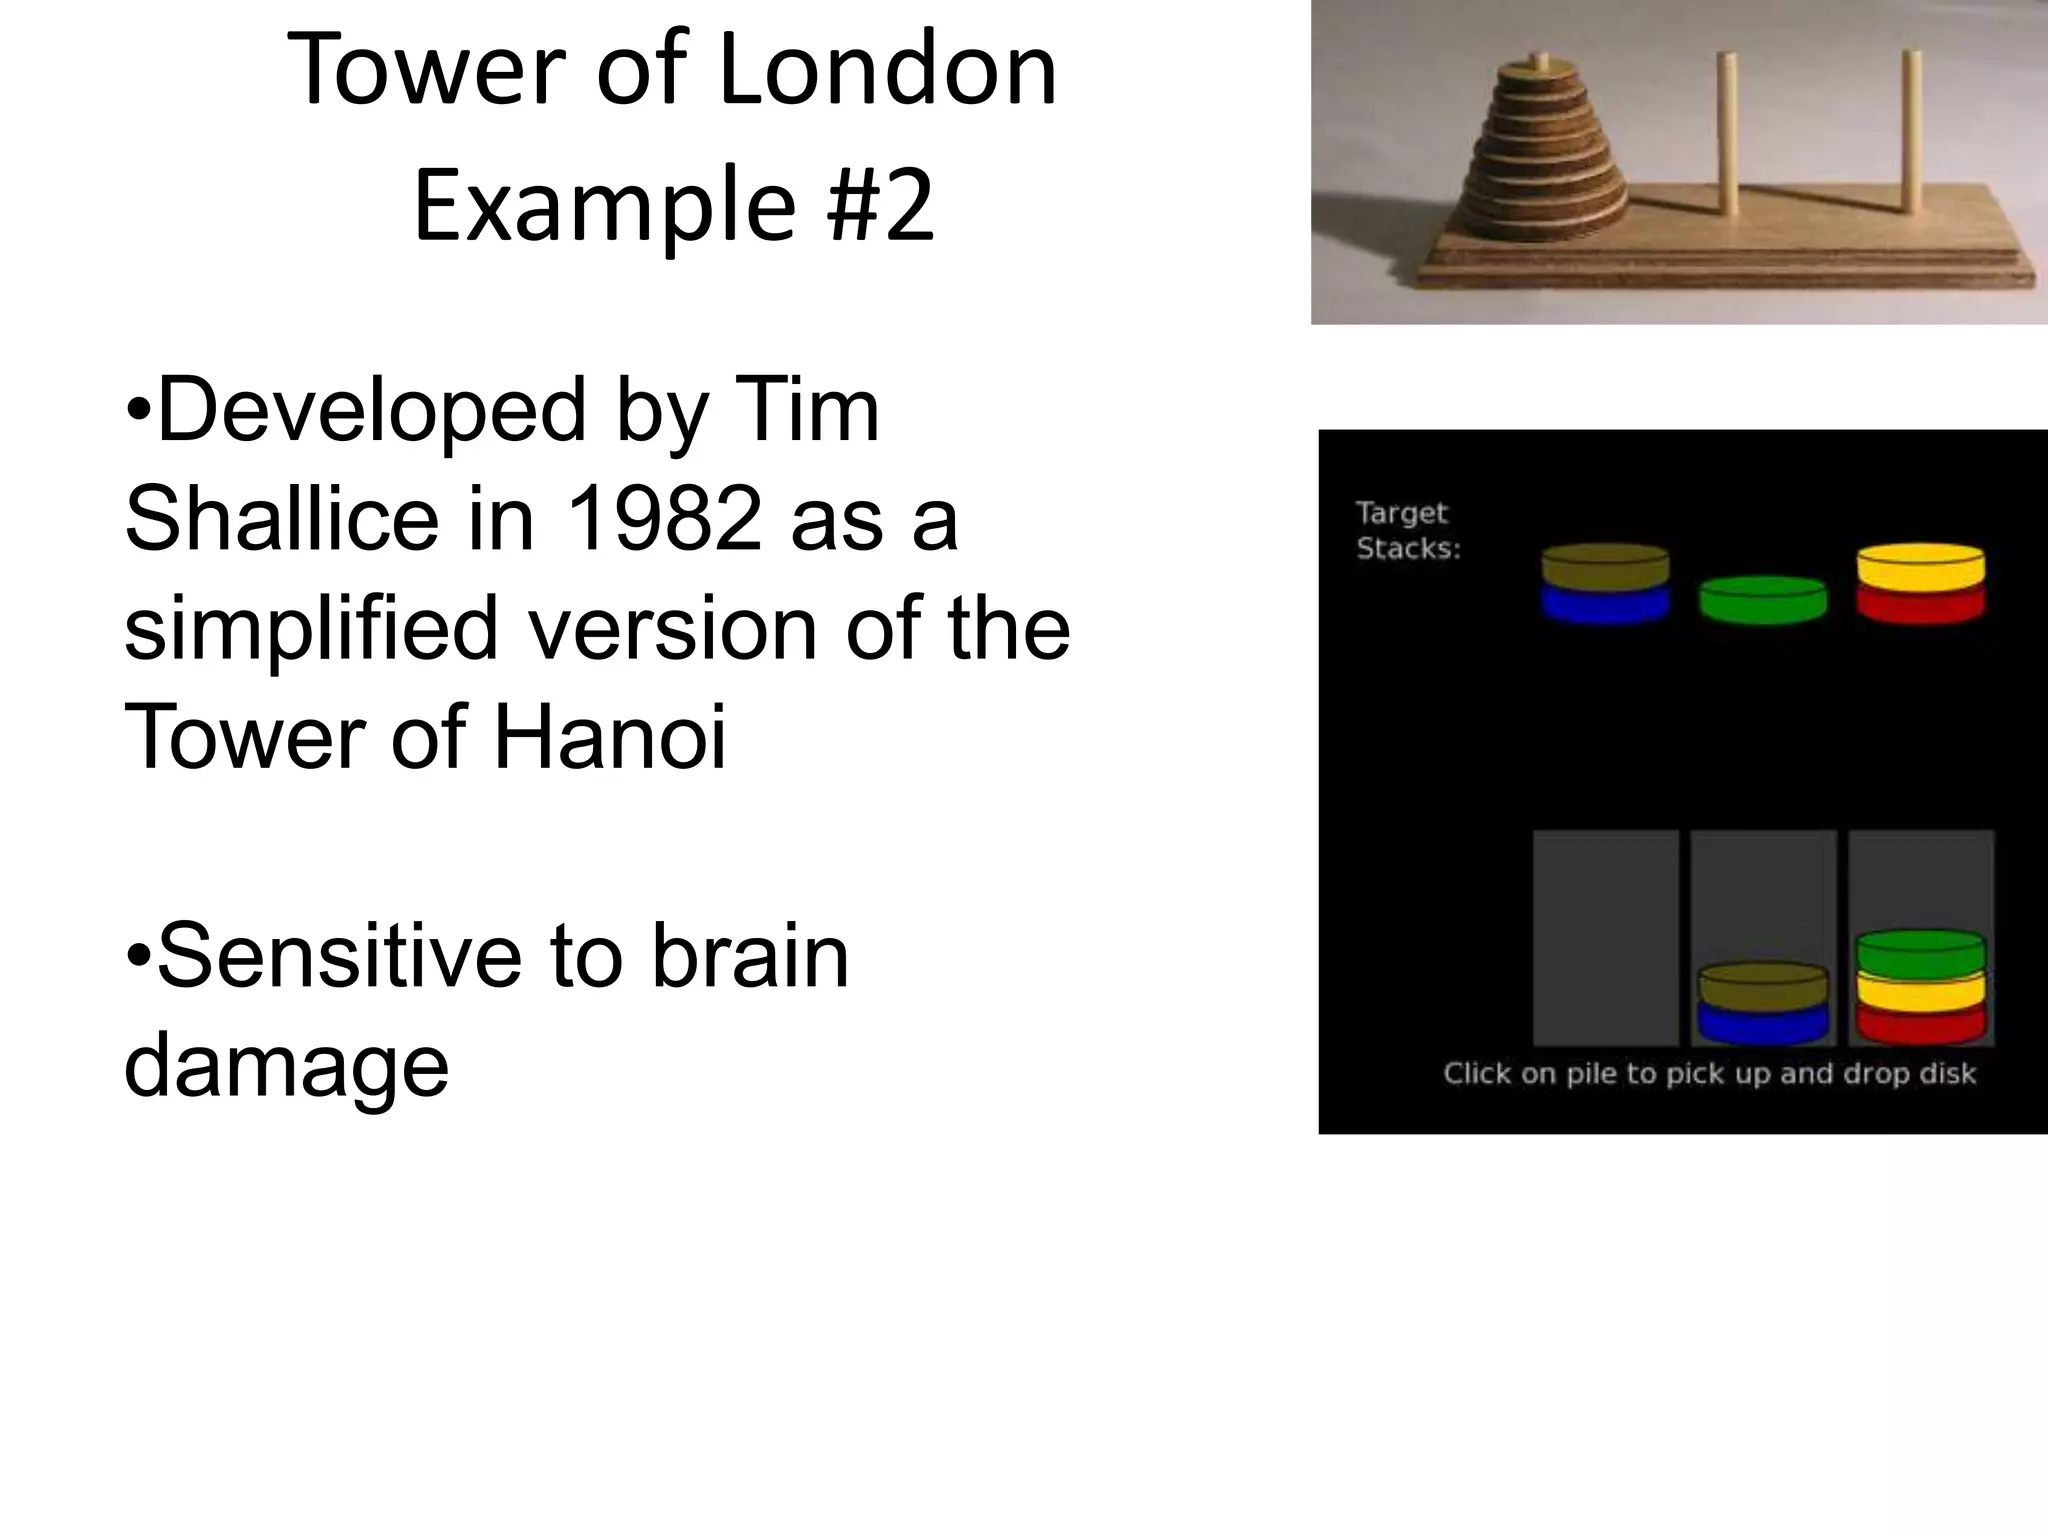
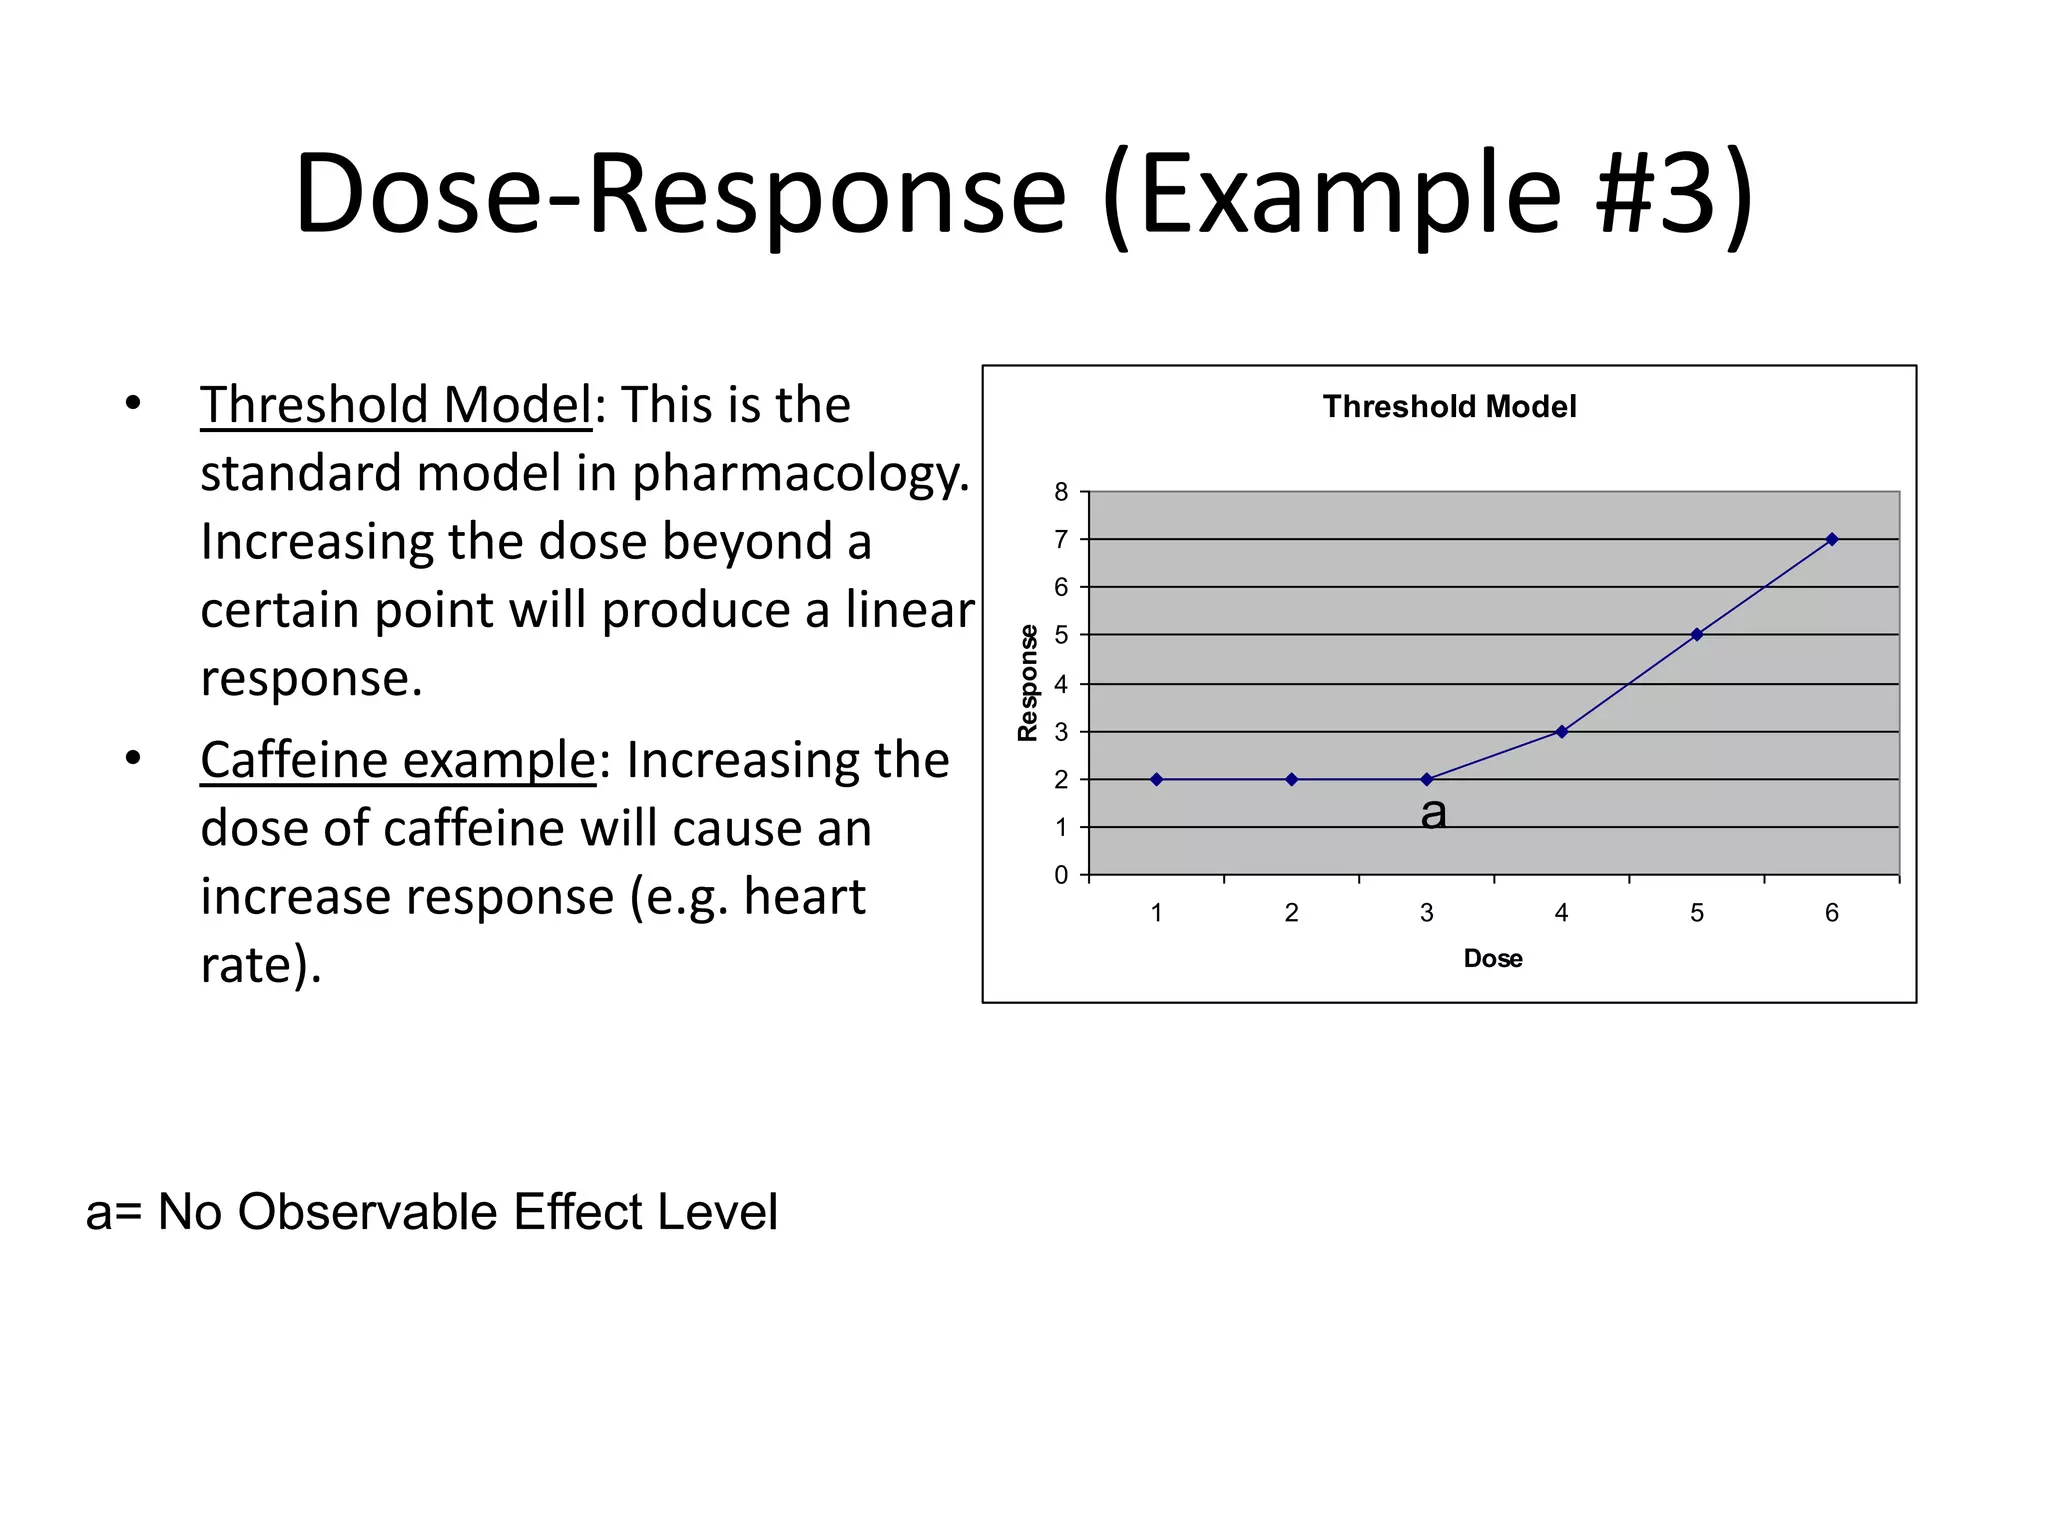
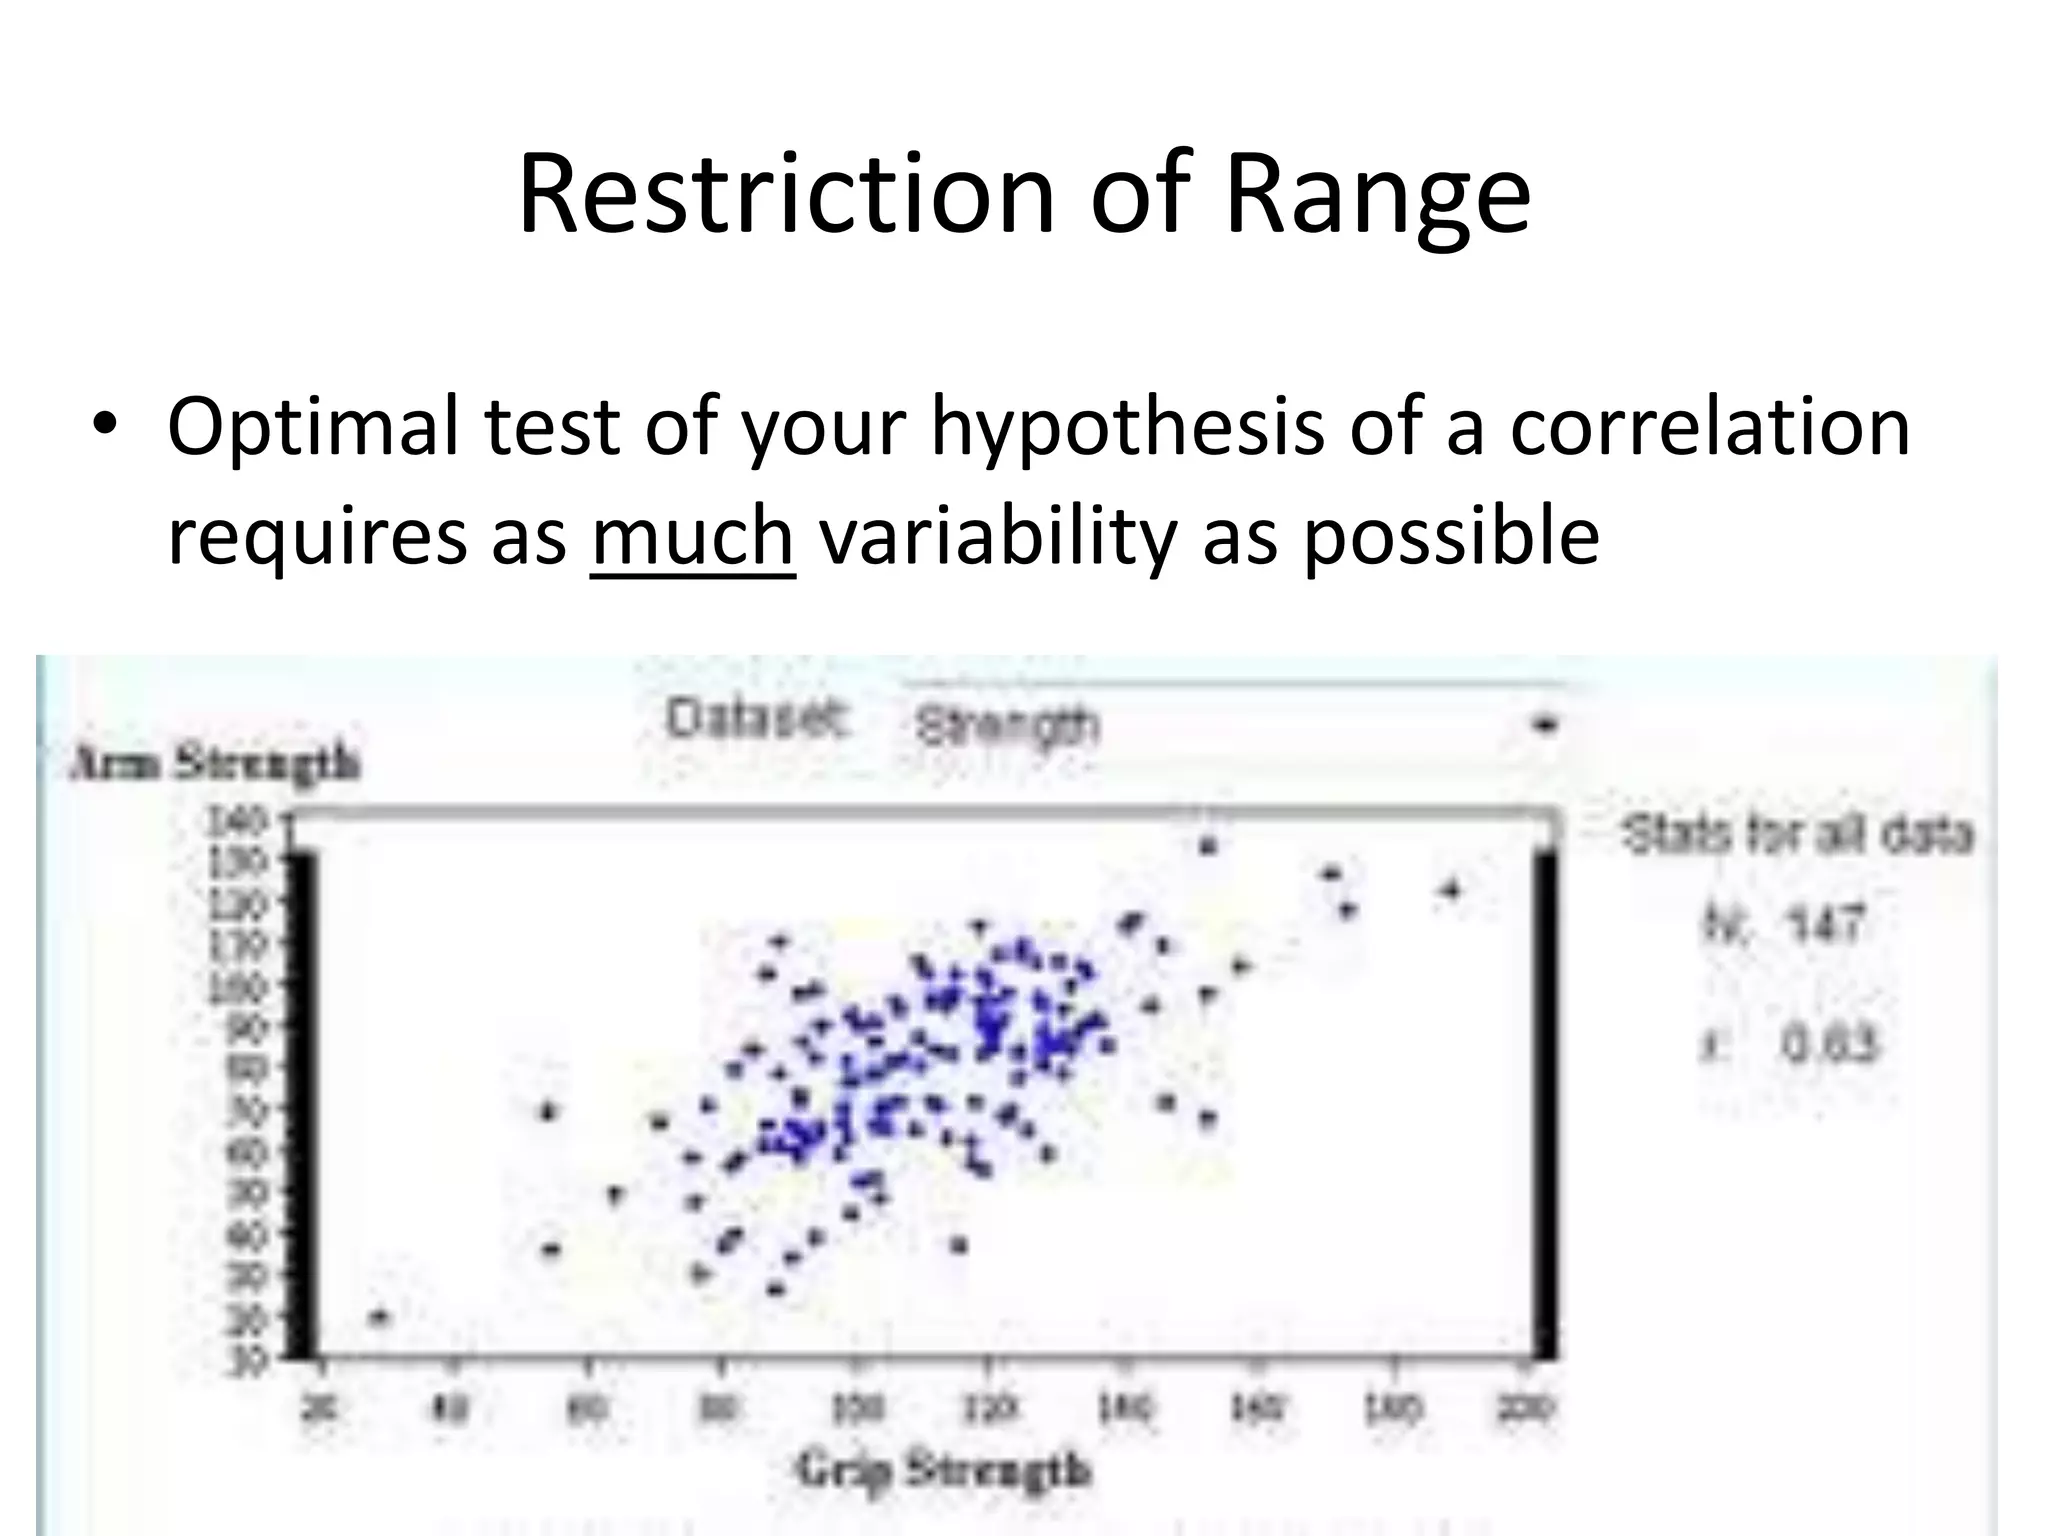
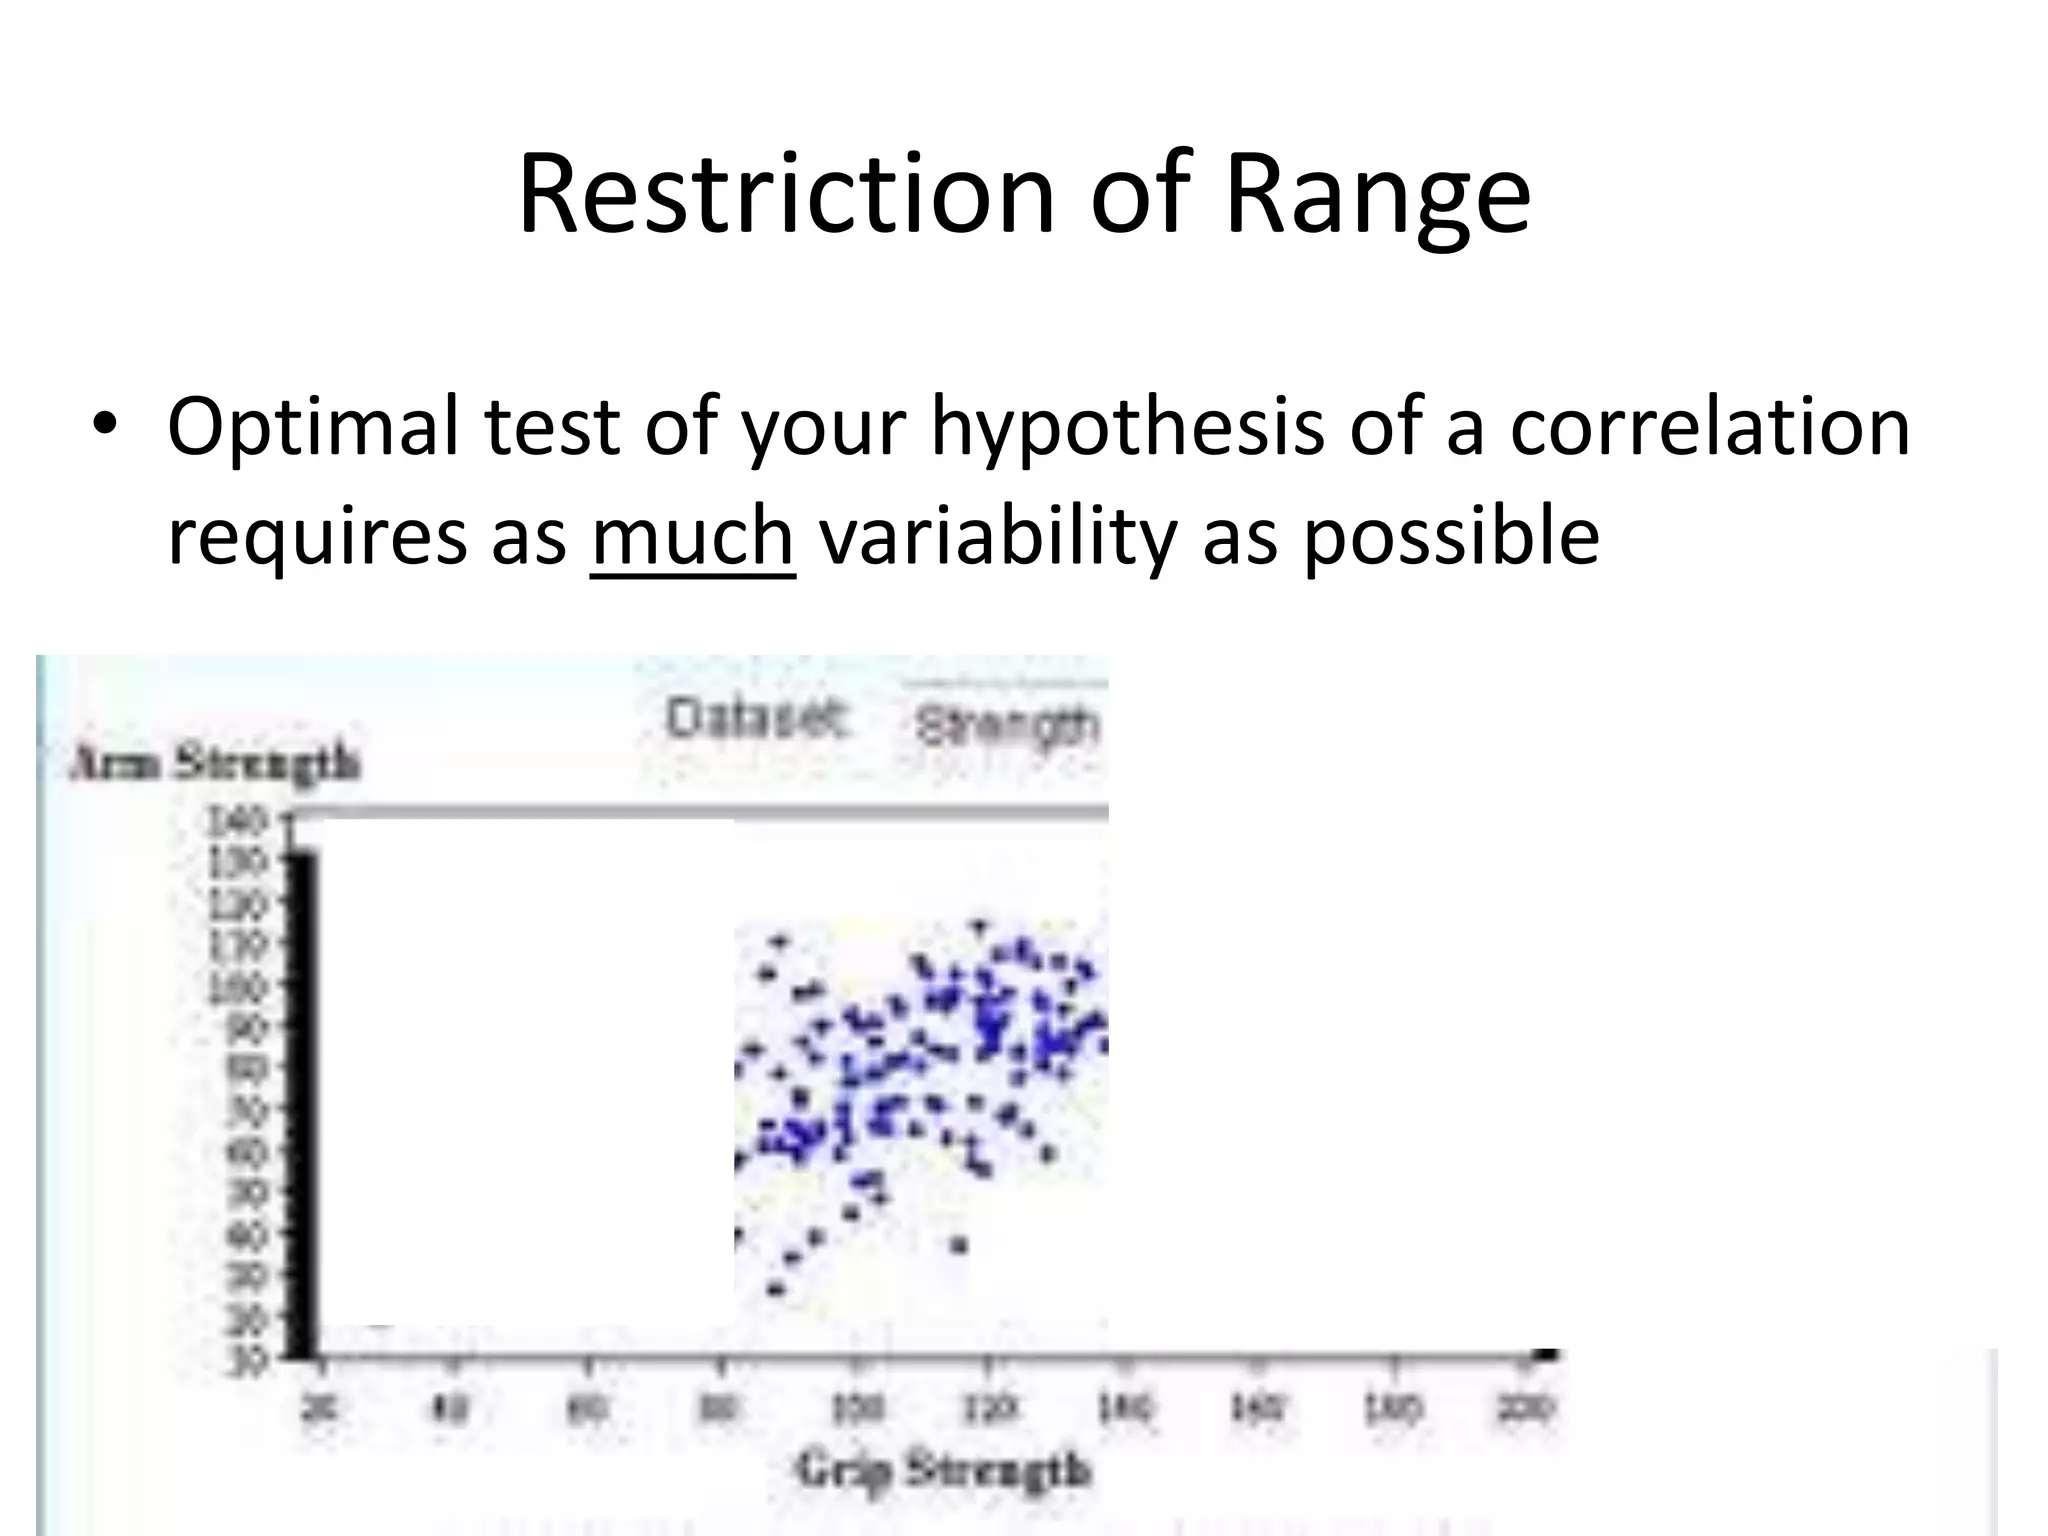
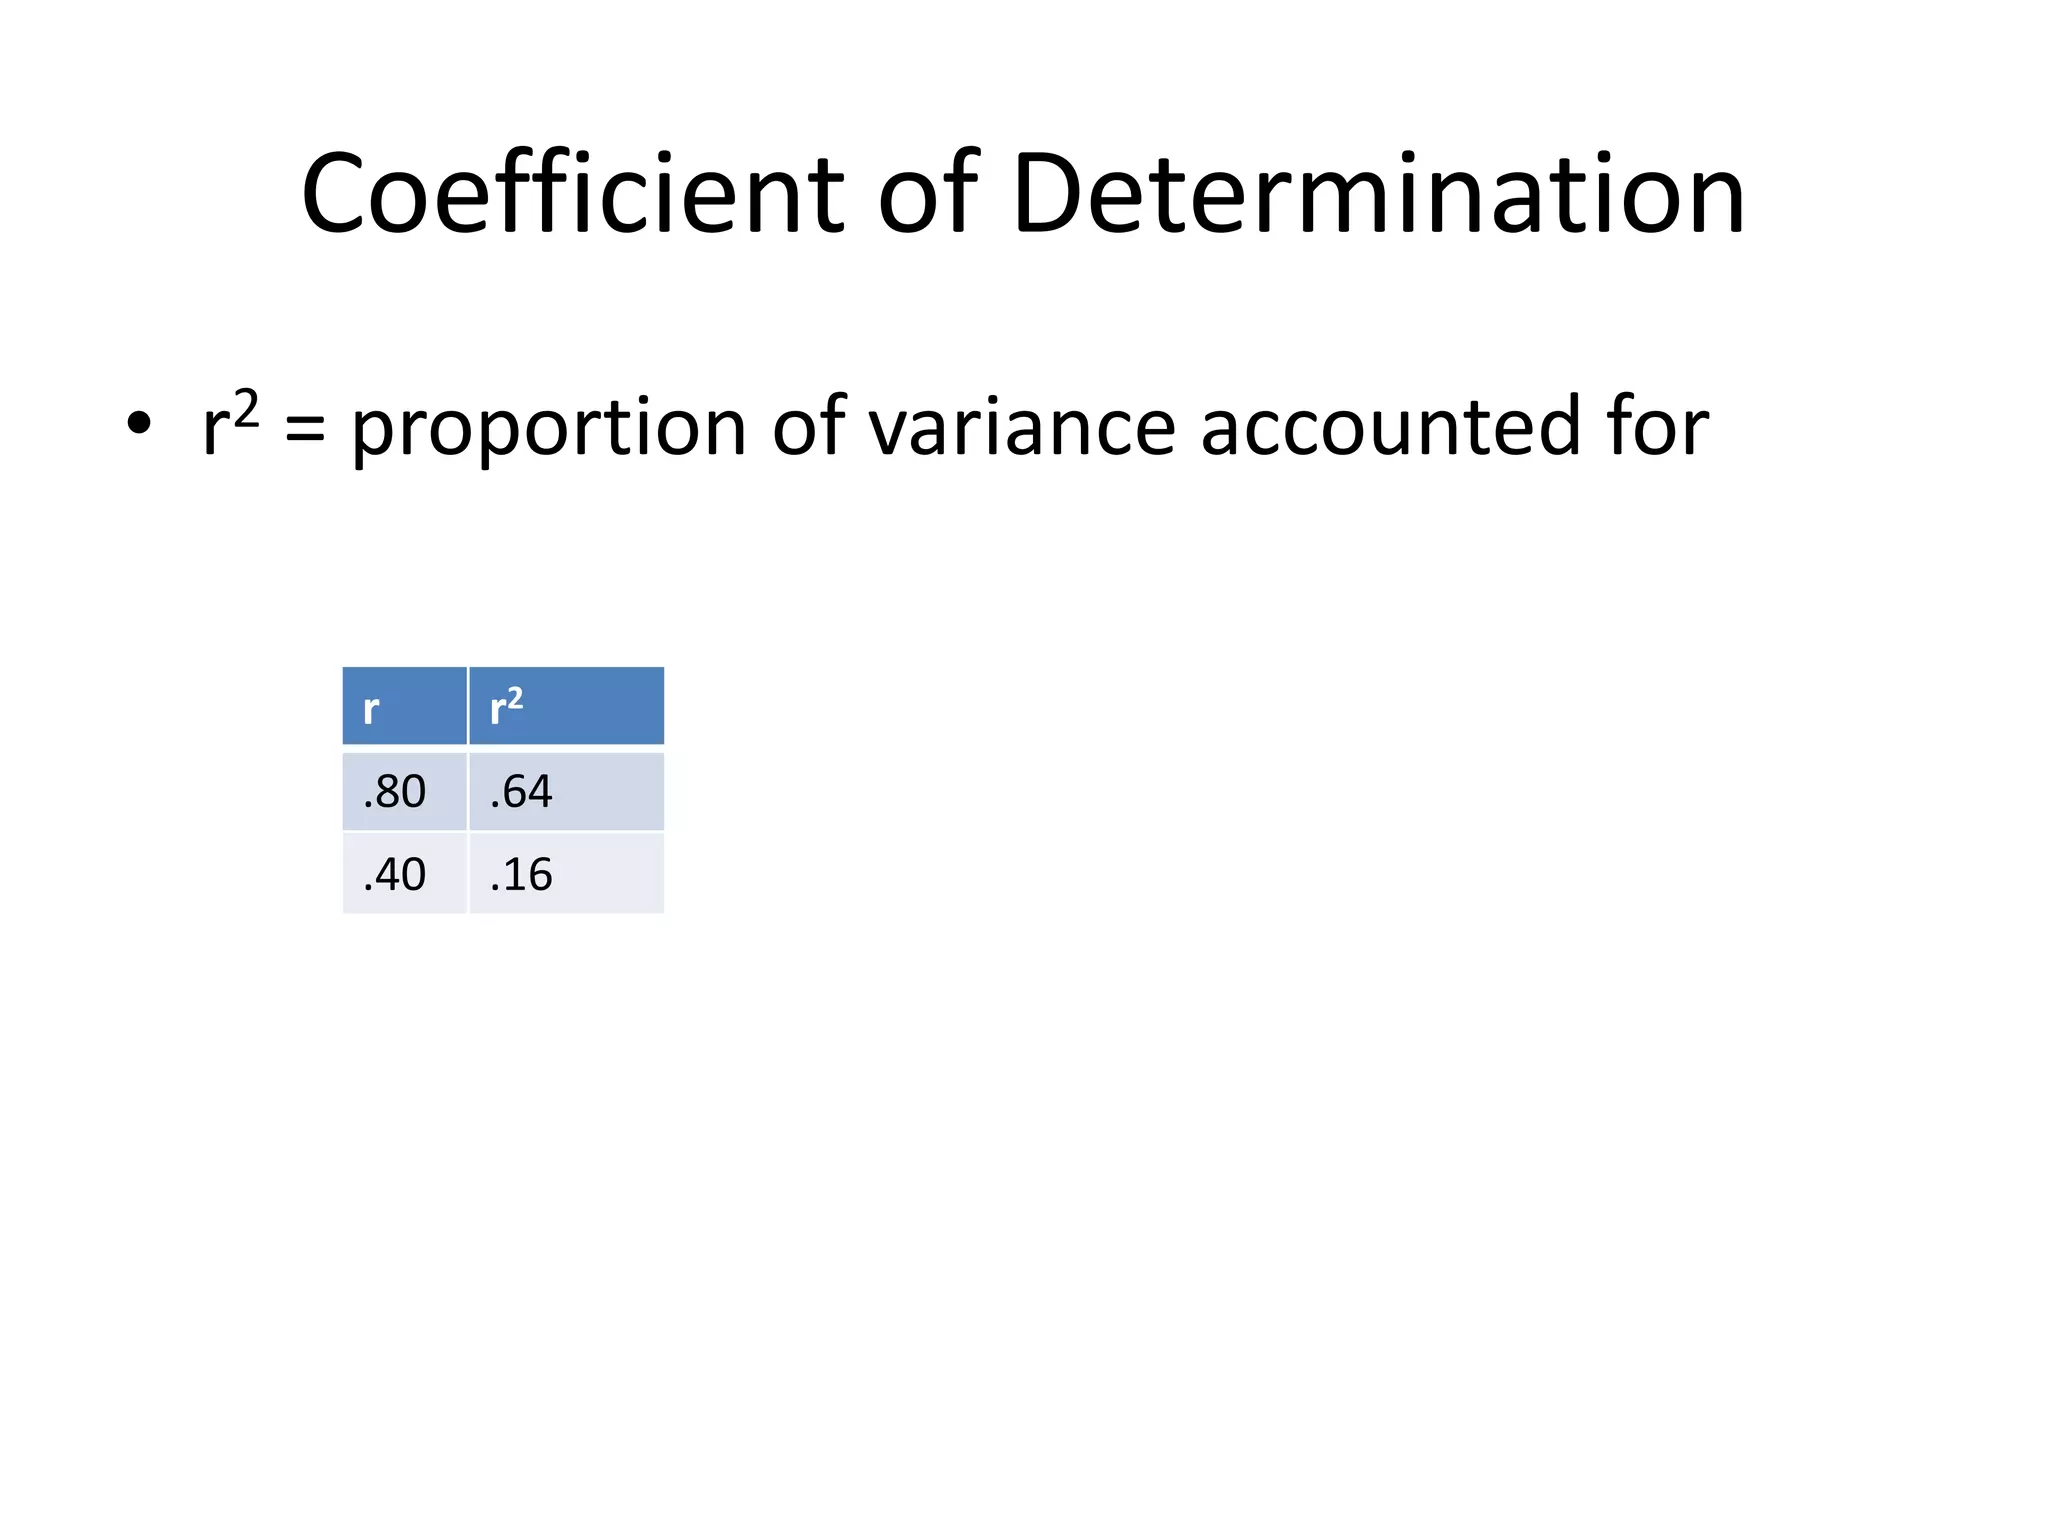
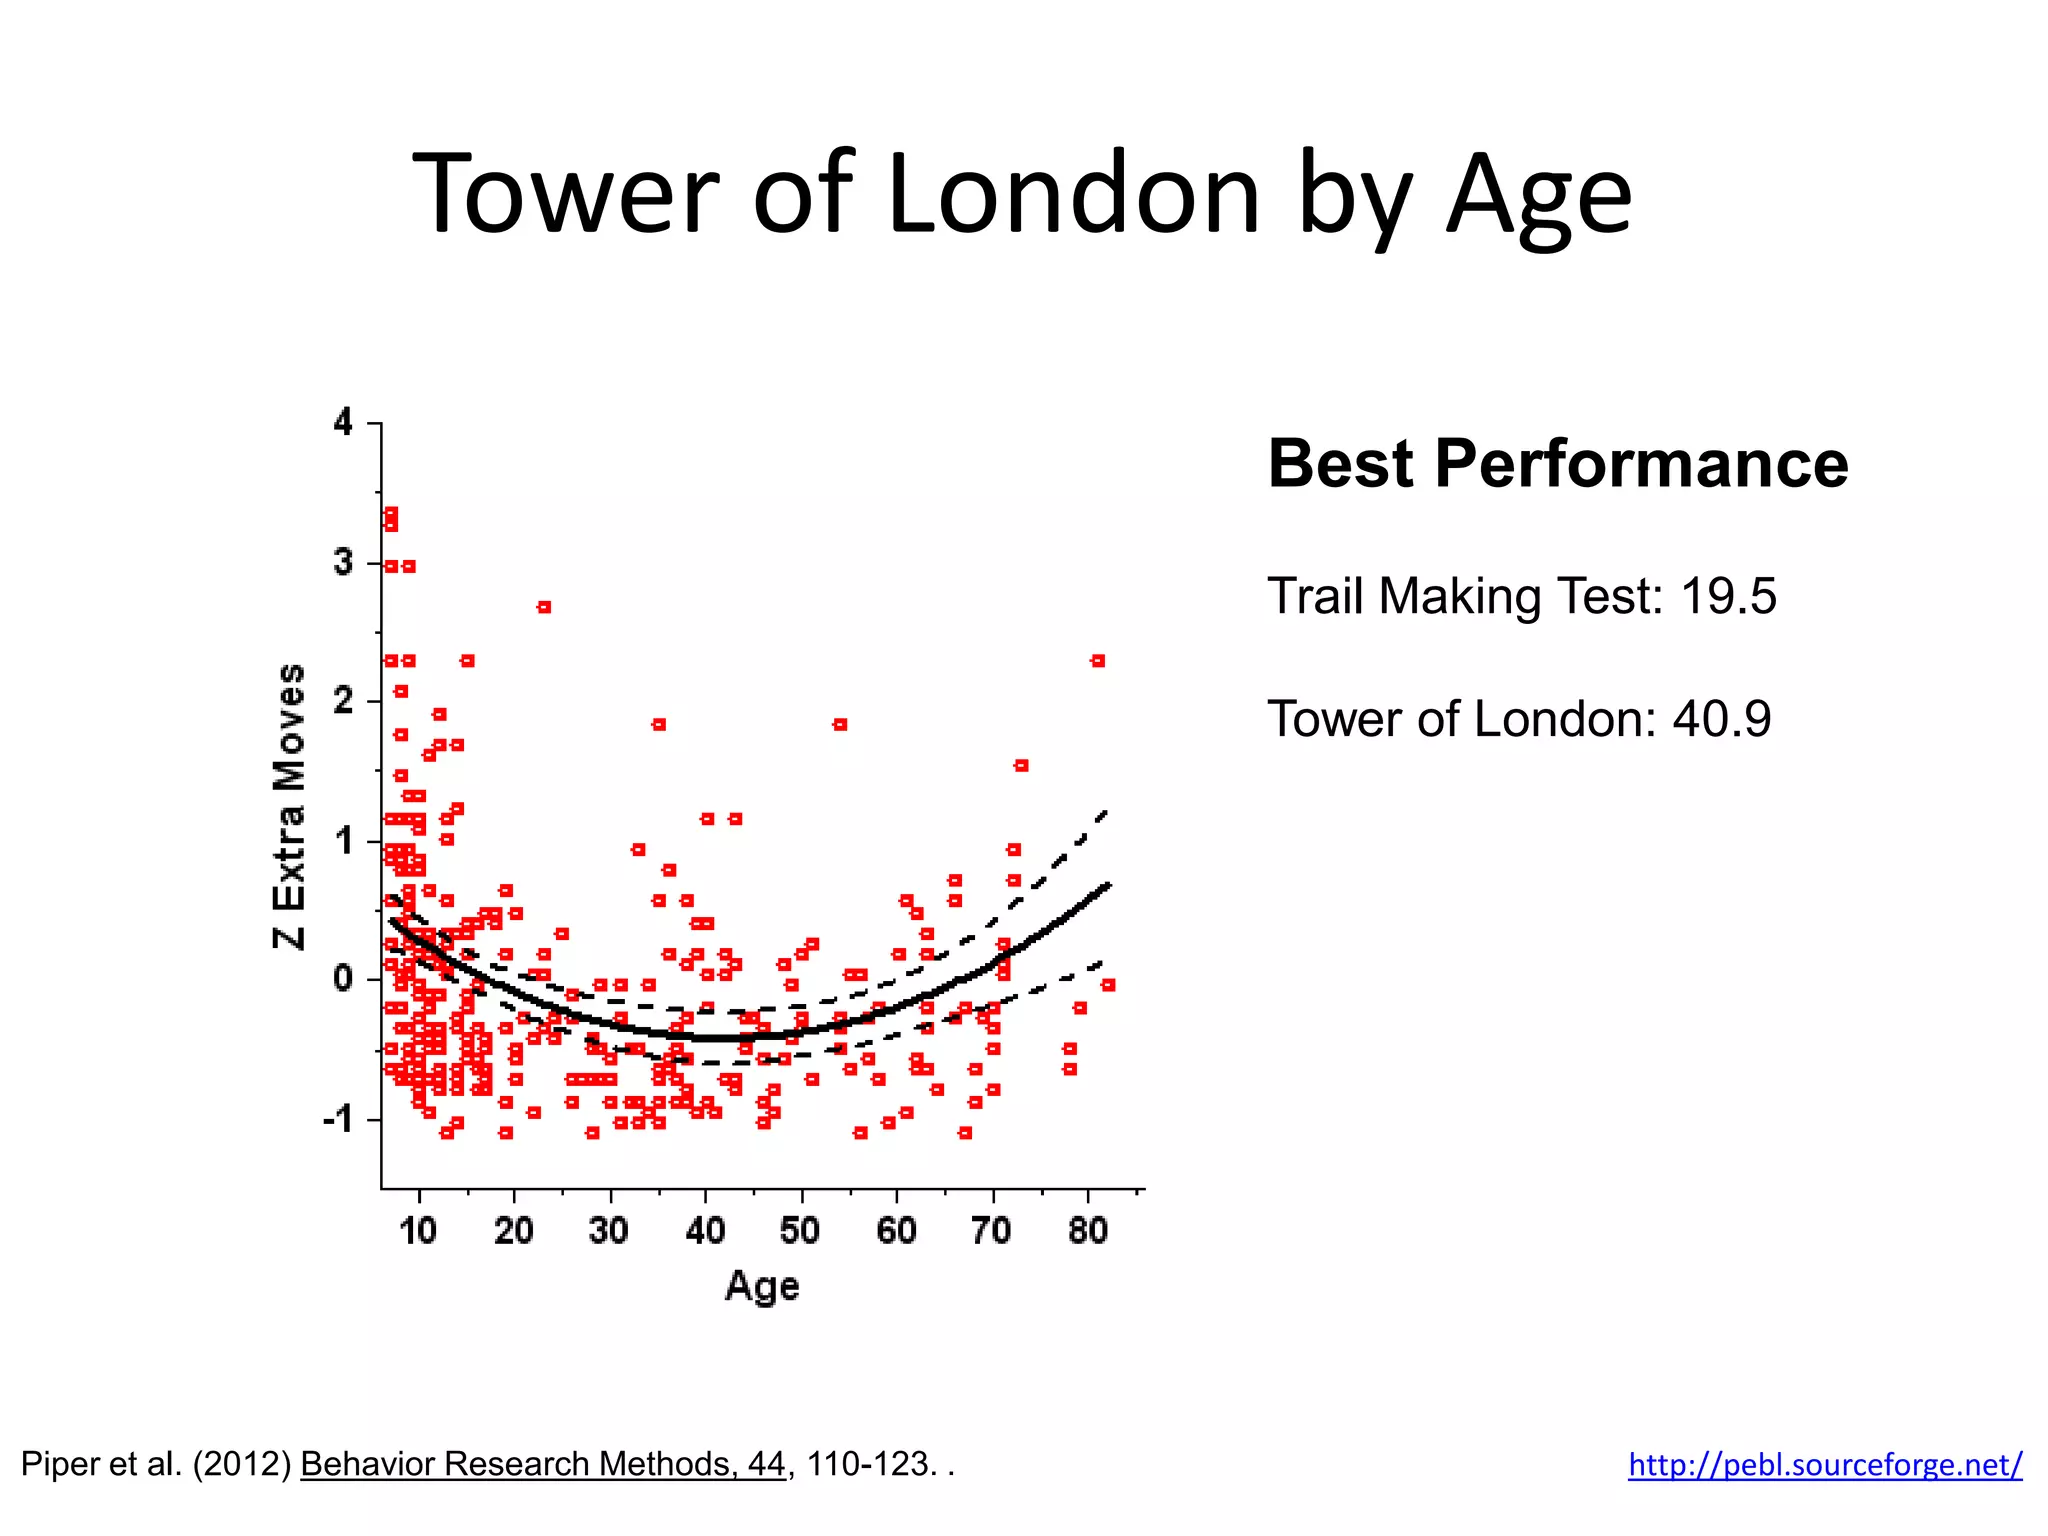
Correlation
Brian J. Piper, Ph.D., M.S.
Objectives
• Scatterplots
• Correlation
  –r
  – r2
• Regression
Sir Francis Galton
• Polymath: meteorology, geography
• Behavioral Genetics                1822-1911


  – Twin studies
  – Eugenics
Scatterplot
Scatterplots Aren’t Perfect
Big-Picture
Karl Pearson’s Product-Moment
         Correlation (r)
             • Range: -1.0 to 0 to +1.0
             • Sign: + or –
             • Strength: +1.0/-1.0 or 0.0


                               1857-1936
Assumptions of Correlation
• 1) interval or ratio data
• 2) X & Y normally distributed
• 3) linear relationship
Also, degrees of freedom = N - 2
Age Differences in Tower of London
                    Behavior (N=325)


Piper et al. (2012) Behavior Research Methods, 44, 110-123.   http://pebl.sourceforge.net/
Tower of London
      Example #2
•Developed by Tim
Shallice in 1982 as a
simplified version of the
Tower of Hanoi

•Sensitive to brain
damage
Dose-Response (Example #3)
 • Threshold Model: This is the                                 Threshold Model

   standard model in pharmacology.                  8

   Increasing the dose beyond a                     7
                                                    6
   certain point will produce a linear


                                         Response
                                                    5

   response.                                        4
                                                    3
 • Caffeine example: Increasing the                 2

   dose of caffeine will cause an                   1                a
                                                    0
   increase response (e.g. heart                        1   2        3          4   5   6

   rate).                                                                Dose


a= No Observable Effect Level
Restriction of Range
• Optimal test of your hypothesis of a correlation
  requires as much variability as possible
Restriction of Range
• Optimal test of your hypothesis of a correlation
  requires as much variability as possible
Coefficient of Determination
• r2 = proportion of variance accounted for

      r     r2
      .80   .64
      .40   .16
Tower of London by Age

                                                                Best Performance
                                                                Trail Making Test: 19.5

                                                                Tower of London: 40.9


Piper et al. (2012) Behavior Research Methods, 44, 110-123. .                   http://pebl.sourceforge.net/
Terminology
• Correlational Design: several variables
  measured simultaneously
• Correlation (r): statistic
• Amphetamine dose and locomotor activity
  example
Directionality
• # of Churches (A) & # violent crimes (B) have r
  = +0.30
• Does A cause B?
• Does B cause A?
Directionality
• # of Churches (A) & # violent crimes (B) have r
  = +0.30
• Does A cause B?
• Does B cause A?
• Does a 3rd variable (population size, C)
  independently cause A & B?
Exercise
• Correlation among measures?
• Paired t-test?

Research Methods: Correlation I