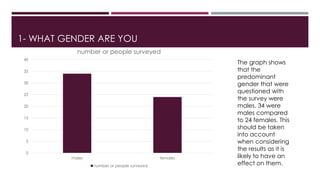
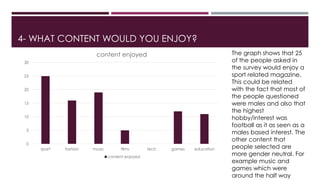
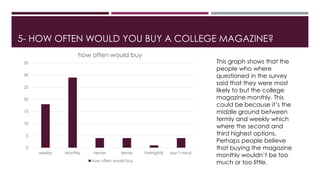
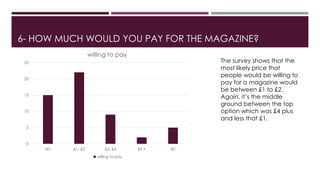
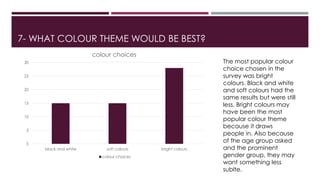
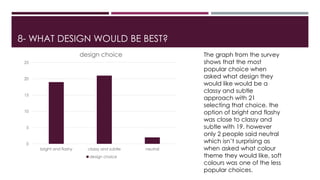
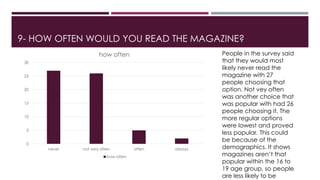
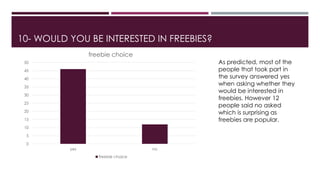
2. 1- WHAT GENDER ARE YOU
0
5
10
15
20
25
30
35
40
males females
number or people surveyed
The graph shows
that the
predominant
gender that were
questioned with
the survey were
males. 34 were
males compared
to 24 females. This
should be taken
into account
when considering
the results as it is
likely to have an
effect on them.
3. 2- WHAT AGE ARE YOU?
0
5
10
15
20
25
30
35
40
45
16 17 18 19+
Age of people surveyed
age of people surveyed
The graph shows
that 41 of the
people asked in
the survey were
aged 16
compared to 8 17
year olds, 1 18
year old and 5
people 19 and
over. This will
again alter the
results because
hobbies and
things people are
interested in differ
in age, even
though the age
4. 3- WHAT ARE YOUR HOBBIES/INTERESTS?
0
2
4
6
8
10
12
14
16
hobbie and interests
This graph shows
that there was a
broad range in
what people like to
do in terms of
hobbies and
interests. The
majority of people,
15, said that they
would be interested
in football. This
could be because
of the gender and
age demographics.
Most of the people
asked were male
and at the age of
16, therefore sport is
5. 4- WHAT CONTENT WOULD YOU ENJOY?
0
5
10
15
20
25
30
sport fashion music films tech games education
content enjoyed
content enjoyed
The graph shows that 25
of the people asked in
the survey would enjoy a
sport related magazine.
This could be related
with the fact that most of
the people questioned
were males and also that
the highest
hobby/interest was
football as it as seen as a
males based interest. The
other content that
people selected are
more gender neutral. For
example music and
games which were
around the half way
6. 5- HOW OFTEN WOULD YOU BUY A COLLEGE MAGAZINE?
0
5
10
15
20
25
30
35
weekly monthly nerver termly fortnightly don’t mind
how often would buy
how often would buy
This graph shows that the
people who where
questioned in the survey
said that they were most
likely to but the college
magazine monthly. This
could be because it’s the
middle ground between
termly and weekly which
where the second and
third highest options.
Perhaps people believe
that buying the magazine
monthly wouldn’t be too
much or too little.
7. 6- HOW MUCH WOULD YOU PAY FOR THE MAGAZINE?
0
5
10
15
20
25
<£1 £1- £2 £2- £4 £4 + £0
willing to pay
willing to pay
The survey shows that the
most likely price that
people would be willing to
pay for a magazine would
be between £1 to £2.
Again, it’s the middle
ground between the top
option which was £4 plus
and less that £1.
8. 7- WHAT COLOUR THEME WOULD BE BEST?
0
5
10
15
20
25
30
black and white soft colours bright colours
colour choices
colour choices
The most popular colour
choice chosen in the
survey was bright
colours. Black and white
and soft colours had the
same results but were still
less. Bright colours may
have been the most
popular colour theme
because it draws
people in. Also because
of the age group asked
and the prominent
gender group, they may
want something less
sublte.
9. 8- WHAT DESIGN WOULD BE BEST?
0
5
10
15
20
25
bright and flashy classy and subtle neutral
design choice
design choice
The graph from the survey
shows that the most
popular choice when
asked what design they
would like would be a
classy and subtle
approach with 21
selecting that choice. the
option of bright and flashy
was close to classy and
subtle with 19. however
only 2 people said neutral
which isn’t surprising as
when asked what colour
theme they would like, soft
colours was one of the less
popular choices.
10. 9- HOW OFTEN WOULD YOU READ THE MAGAZINE?
0
5
10
15
20
25
30
never not very often often always
how often
how often
People in the survey said
that they would most
likely never read the
magazine with 27
people choosing that
option. Not vey often
was another choice that
was popular with had 26
people choosing it. The
more regular options
were lowest and proved
less popular. This could
be because of the
demographics. It shows
magazines aren’t that
popular within the 16 to
19 age group, so people
are less likely to be
11. 10- WOULD YOU BE INTERESTED IN FREEBIES?
0
5
10
15
20
25
30
35
40
45
50
yes no
freebie choice
freebie choice
As predicted, most of the
people that took part in
the survey answered yes
when asking whether they
would be interested in
freebies. However 12
people said no asked
which is surprising as
freebies are popular.