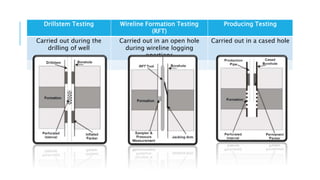
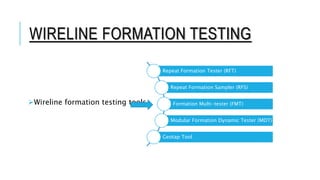
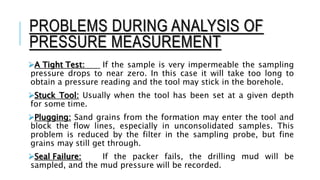
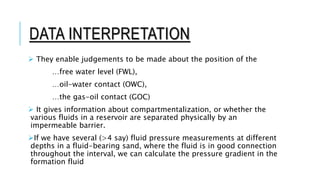
FLUID TESTING &
PRESSURE LOG
Presented By,
Ashwani Kumar Sinha
M.Sc Applied Geology
Semester IV
University of Lucknow
INTRODUCTION
Fluid testing involves: Collecting fluid samples
Measuring fluid pressures
Why we take samples? Type & Properties of fluid
Presence of Hydrocarbon
Information on the Pressure of the
fluid within the formation
HOW WE TEST FORMATION FLUID?
There are 3 measurement types
Drillstem Testing
Wireline Formation Testing
Production Testing
Described in
the order that
they are
performed, in
their
complexity,
and their cost
Drillstem Testing Wireline Formation Testing
(RFT)
Producing Testing
Carried out during the
drilling of well
Carried out in an open hole
during wireline logging
opertions
Carried out in a cased hole
WIRELINE FORMATION TESTING
Wireline formation testing tools
Repeat Formation Tester (RFT)
Repeat Formation Sampler (RFS)
Formation Multi-tester (FMT)
Modular Formation Dynamic Tester (MDT)
Geotap Tool
These tools are capable of taking multiple samples of fluids
Pressure measurements in the borehole without withdrawal
These testers can mix the fluids sampled from several settings in one chamber
or take two separate samples and keep them separate
Fluids can be maintained at high pressure
This facility also enables the first part of the sample (mud filtrate) to be stored
separately from the latter part of the fluid sample (reservoir fluids), or enable the
first part to be ignored, so that the sample reliably samples only the reservoir
fluid
Provide very accurate fluid pressure readings
Require very little time between unloading the sampled fluids and preparation
for the next run
Cont.
OPERATION
The tool is run into the well to the depth
required
Initially the tool takes a reading of the drilling
mud pressure
The tool is then attached securely to the wall
of the borehole
The packer seals the sampling head from the
drilling mud and mudcake surrounding the tool
The probe containing the piston is then
pressed through the mud-cake into the
formation.
The piston is withdrawn, allowing fluids to
pass from the formation into the tool
The
RFT
Tool
The packer
seals the
sampling head
from the drilling
mud and
mudcake
surrounding the
The probe
containing the
piston is then
pressed through
the mud-cake
into the
formation
The piston is
withdrawn,
allowing fluids
to pass from the
formation into
the tool
PROBLEMS DURING ANALYSIS OF
PRESSURE MEASUREMENT
A Tight Test: If the sample is very impermeable the sampling
pressure drops to near zero. In this case it will take too long to
obtain a pressure reading and the tool may stick in the borehole.
Stuck Tool: Usually when the tool has been set at a given depth
for some time.
Plugging: Sand grains from the formation may enter the tool and
block the flow lines, especially in unconsolidated samples. This
problem is reduced by the filter in the sampling probe, but fine
grains may still get through.
Seal Failure: If the packer fails, the drilling mud will be
sampled, and the mud pressure will be recorded.
LOG PRESENTATION
The pressures are given in analogue and digital form.
Track 1 usually contains the analogue pressure data
Tracks 3 and 4 are divided into 4 sub-tracks that contain the
pressure data in exploded form:
Subtrack 1. Pressures from 0 to 10000 psi in 1000 psi
increments.
Subtrack 2. Pressures from 0 to 1000 psi in 100 psi
increments.
Subtrack 3. Pressures from 0 to 100 psi in 10 psi
increments.
Subtrack 4. Pressures from 0 to 10 psi in 1 psi
increments.
An example of
RFT pressure
log. (Courtesy
of
Schlumberger)
DATA INTERPRETATION
 They enable judgements to be made about the position of the
…free water level (FWL),
…oil-water contact (OWC),
…the gas-oil contact (GOC)
 It gives information about compartmentalization, or whether the
various fluids in a reservoir are separated physically by an
impermeable barrier.
If we have several (>4 say) fluid pressure measurements at different
depths in a fluid-bearing sand, where the fluid is in good connection
throughout the interval, we can calculate the pressure gradient in the
formation fluid
All the pressures should lie on the straight line which defines the pressure at
a given depth as a function of the depth and the density of the fluid.
Applicable to all fluids (gas, oil or water)
A plot of pressure on the x-axis against depth on the y-axis is used to
interpret reservoir pressures
This simple equation and the pressure versus depth plot allows us to
examine a large range of possibilities that might occur in a reservoir
THANK YOU…

Fluid testing and pressure logs

  • 1.
    FLUID TESTING & PRESSURELOG Presented By, Ashwani Kumar Sinha M.Sc Applied Geology Semester IV University of Lucknow
  • 2.
    INTRODUCTION Fluid testing involves:Collecting fluid samples Measuring fluid pressures Why we take samples? Type & Properties of fluid Presence of Hydrocarbon Information on the Pressure of the fluid within the formation
  • 3.
    HOW WE TESTFORMATION FLUID? There are 3 measurement types Drillstem Testing Wireline Formation Testing Production Testing Described in the order that they are performed, in their complexity, and their cost
  • 4.
    Drillstem Testing WirelineFormation Testing (RFT) Producing Testing Carried out during the drilling of well Carried out in an open hole during wireline logging opertions Carried out in a cased hole
  • 5.
    WIRELINE FORMATION TESTING Wirelineformation testing tools Repeat Formation Tester (RFT) Repeat Formation Sampler (RFS) Formation Multi-tester (FMT) Modular Formation Dynamic Tester (MDT) Geotap Tool
  • 6.
    These tools arecapable of taking multiple samples of fluids Pressure measurements in the borehole without withdrawal These testers can mix the fluids sampled from several settings in one chamber or take two separate samples and keep them separate Fluids can be maintained at high pressure This facility also enables the first part of the sample (mud filtrate) to be stored separately from the latter part of the fluid sample (reservoir fluids), or enable the first part to be ignored, so that the sample reliably samples only the reservoir fluid Provide very accurate fluid pressure readings Require very little time between unloading the sampled fluids and preparation for the next run Cont.
  • 7.
    OPERATION The tool isrun into the well to the depth required Initially the tool takes a reading of the drilling mud pressure The tool is then attached securely to the wall of the borehole The packer seals the sampling head from the drilling mud and mudcake surrounding the tool The probe containing the piston is then pressed through the mud-cake into the formation. The piston is withdrawn, allowing fluids to pass from the formation into the tool The RFT Tool
  • 8.
    The packer seals the samplinghead from the drilling mud and mudcake surrounding the The probe containing the piston is then pressed through the mud-cake into the formation The piston is withdrawn, allowing fluids to pass from the formation into the tool
  • 9.
    PROBLEMS DURING ANALYSISOF PRESSURE MEASUREMENT A Tight Test: If the sample is very impermeable the sampling pressure drops to near zero. In this case it will take too long to obtain a pressure reading and the tool may stick in the borehole. Stuck Tool: Usually when the tool has been set at a given depth for some time. Plugging: Sand grains from the formation may enter the tool and block the flow lines, especially in unconsolidated samples. This problem is reduced by the filter in the sampling probe, but fine grains may still get through. Seal Failure: If the packer fails, the drilling mud will be sampled, and the mud pressure will be recorded.
  • 10.
    LOG PRESENTATION The pressuresare given in analogue and digital form. Track 1 usually contains the analogue pressure data Tracks 3 and 4 are divided into 4 sub-tracks that contain the pressure data in exploded form: Subtrack 1. Pressures from 0 to 10000 psi in 1000 psi increments. Subtrack 2. Pressures from 0 to 1000 psi in 100 psi increments. Subtrack 3. Pressures from 0 to 100 psi in 10 psi increments. Subtrack 4. Pressures from 0 to 10 psi in 1 psi increments.
  • 11.
    An example of RFTpressure log. (Courtesy of Schlumberger)
  • 12.
    DATA INTERPRETATION  Theyenable judgements to be made about the position of the …free water level (FWL), …oil-water contact (OWC), …the gas-oil contact (GOC)  It gives information about compartmentalization, or whether the various fluids in a reservoir are separated physically by an impermeable barrier. If we have several (>4 say) fluid pressure measurements at different depths in a fluid-bearing sand, where the fluid is in good connection throughout the interval, we can calculate the pressure gradient in the formation fluid
  • 13.
    All the pressuresshould lie on the straight line which defines the pressure at a given depth as a function of the depth and the density of the fluid. Applicable to all fluids (gas, oil or water) A plot of pressure on the x-axis against depth on the y-axis is used to interpret reservoir pressures This simple equation and the pressure versus depth plot allows us to examine a large range of possibilities that might occur in a reservoir
  • 14.