Download as PDF, PPTX
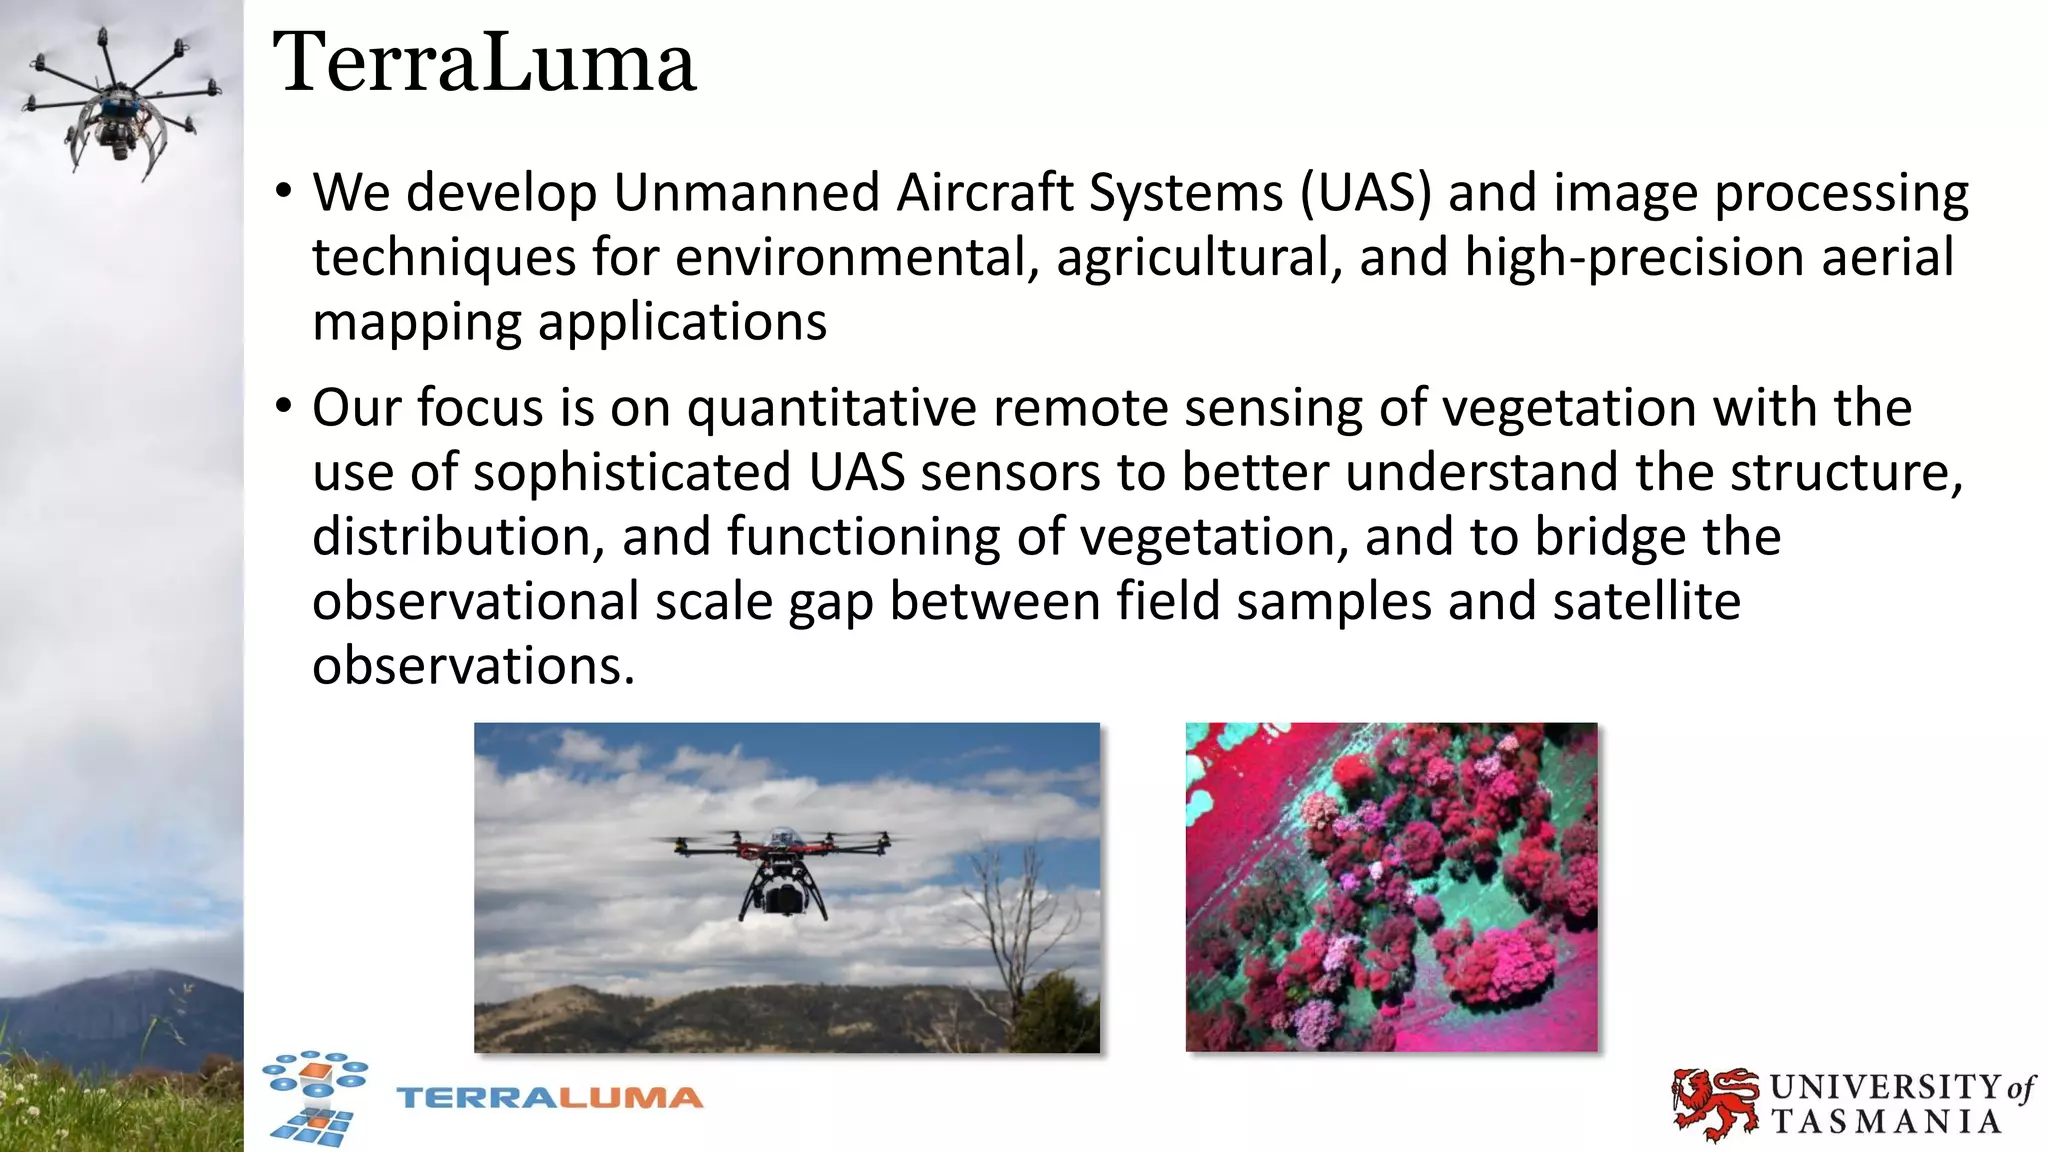
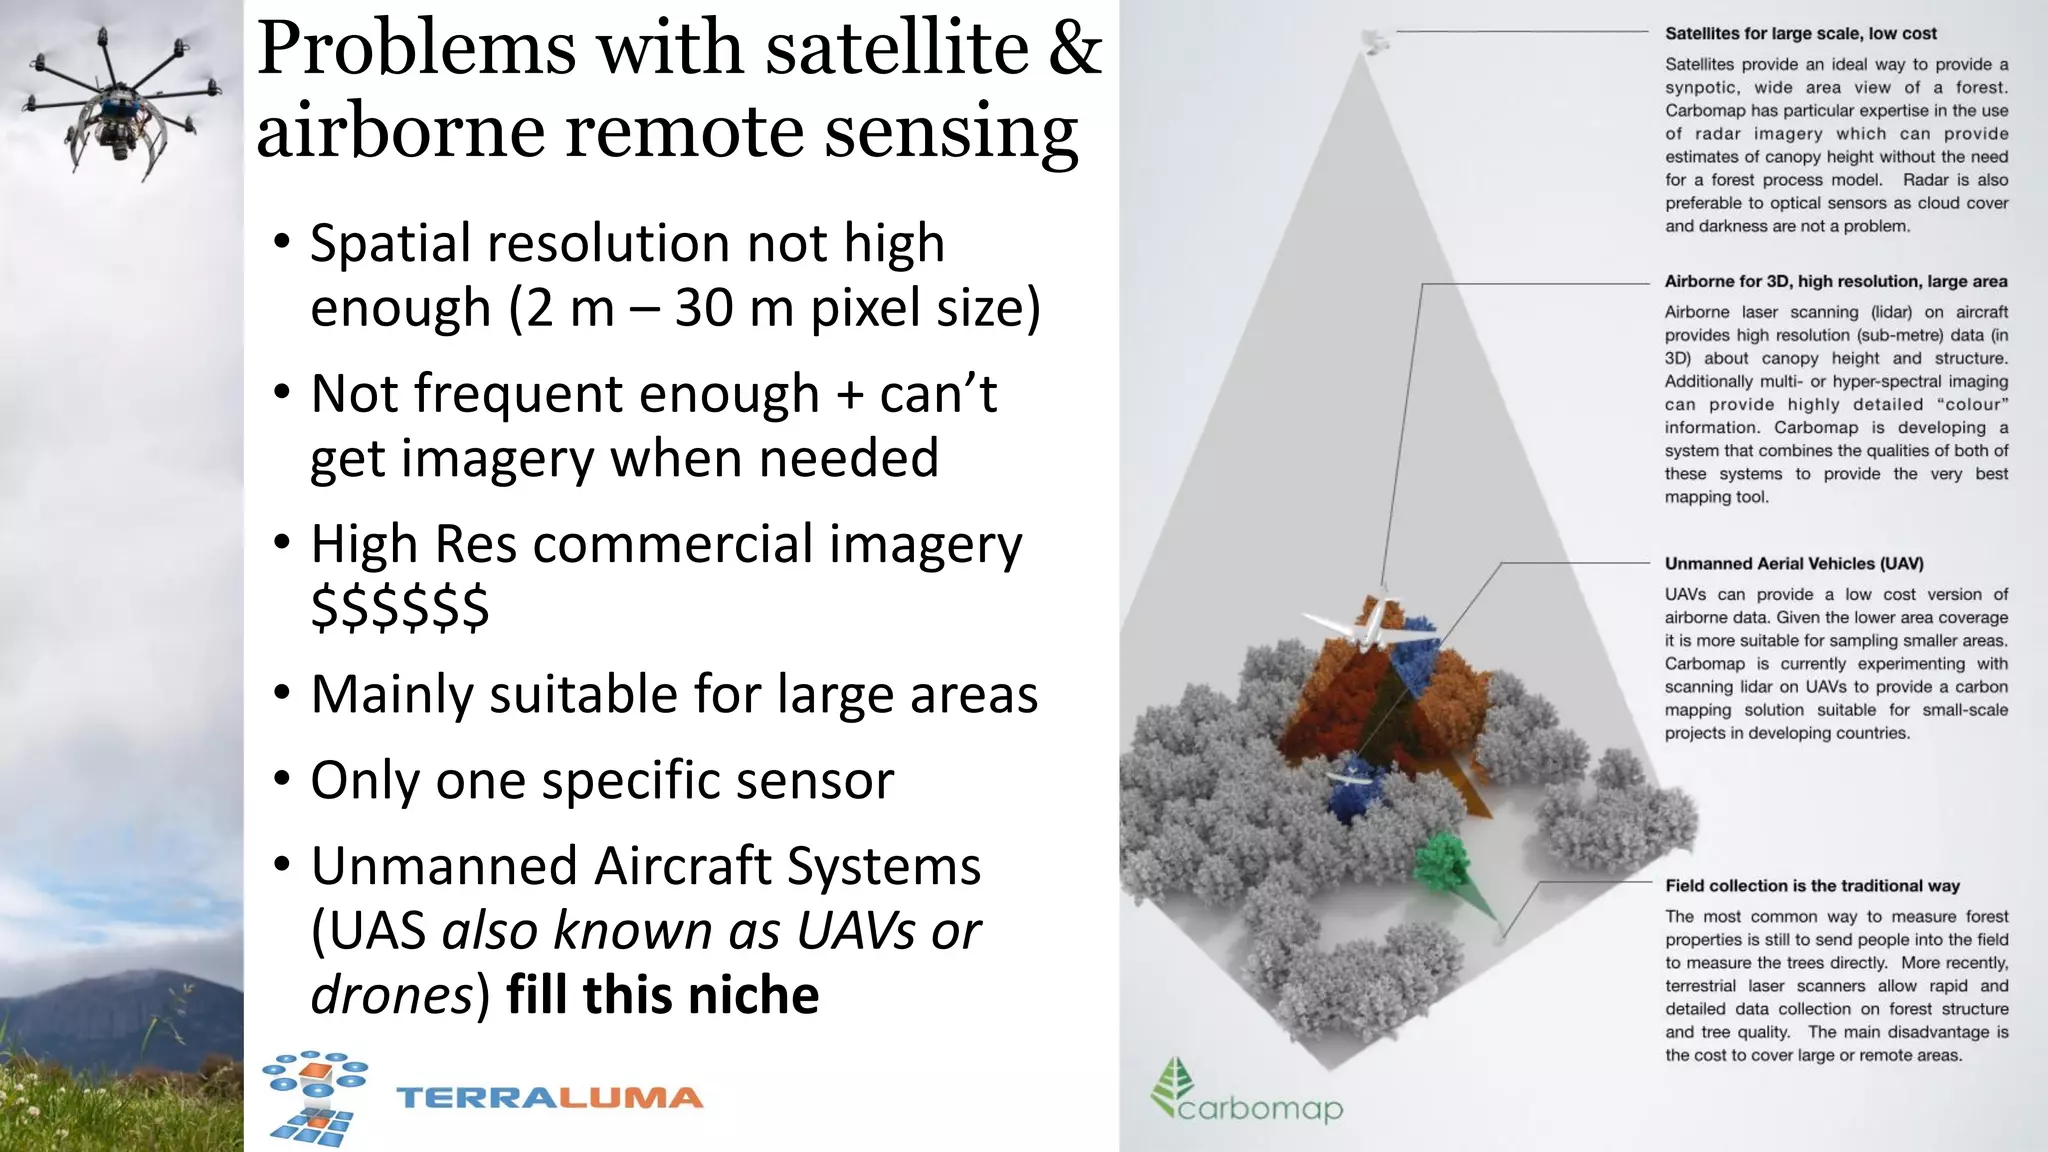
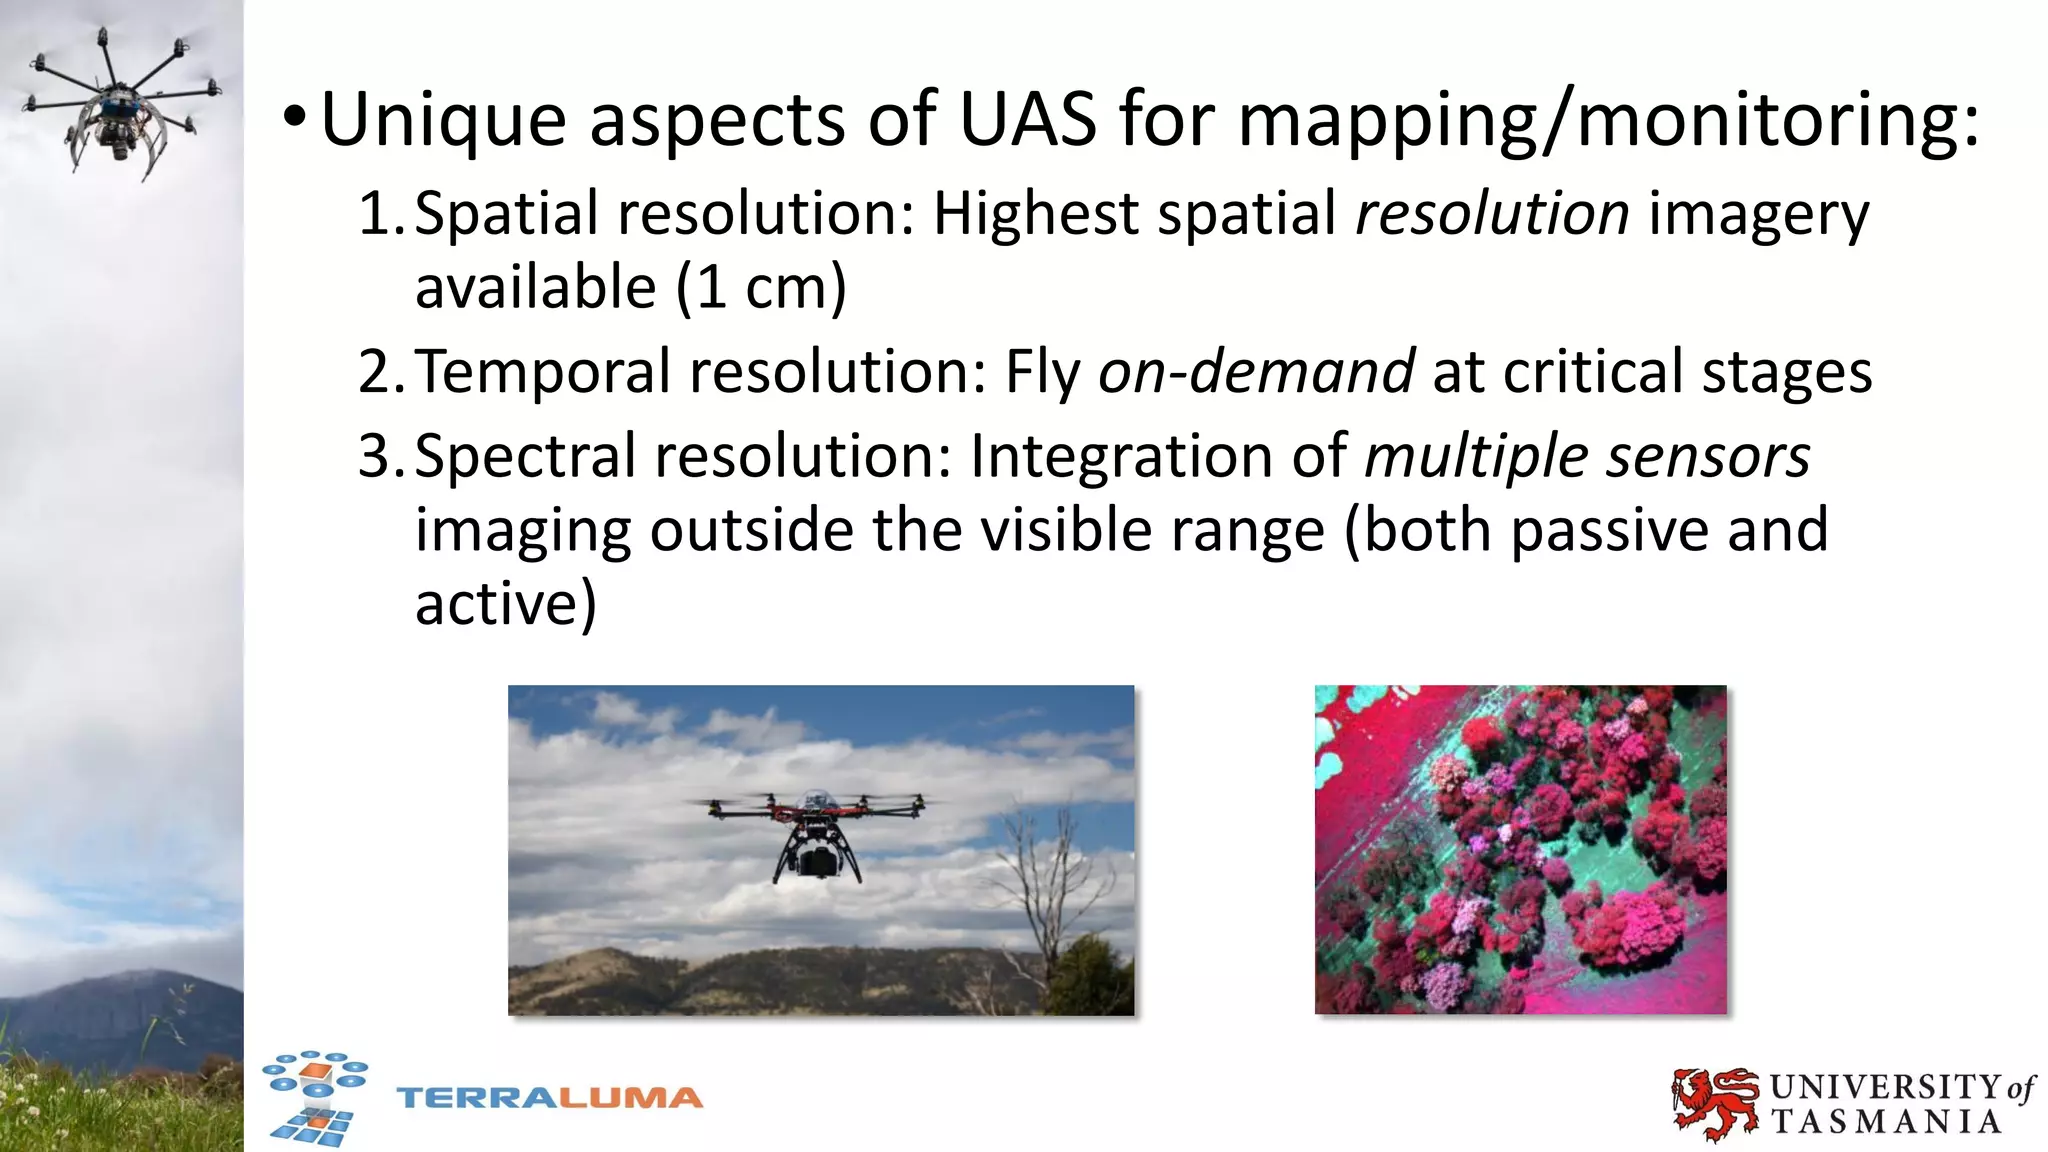
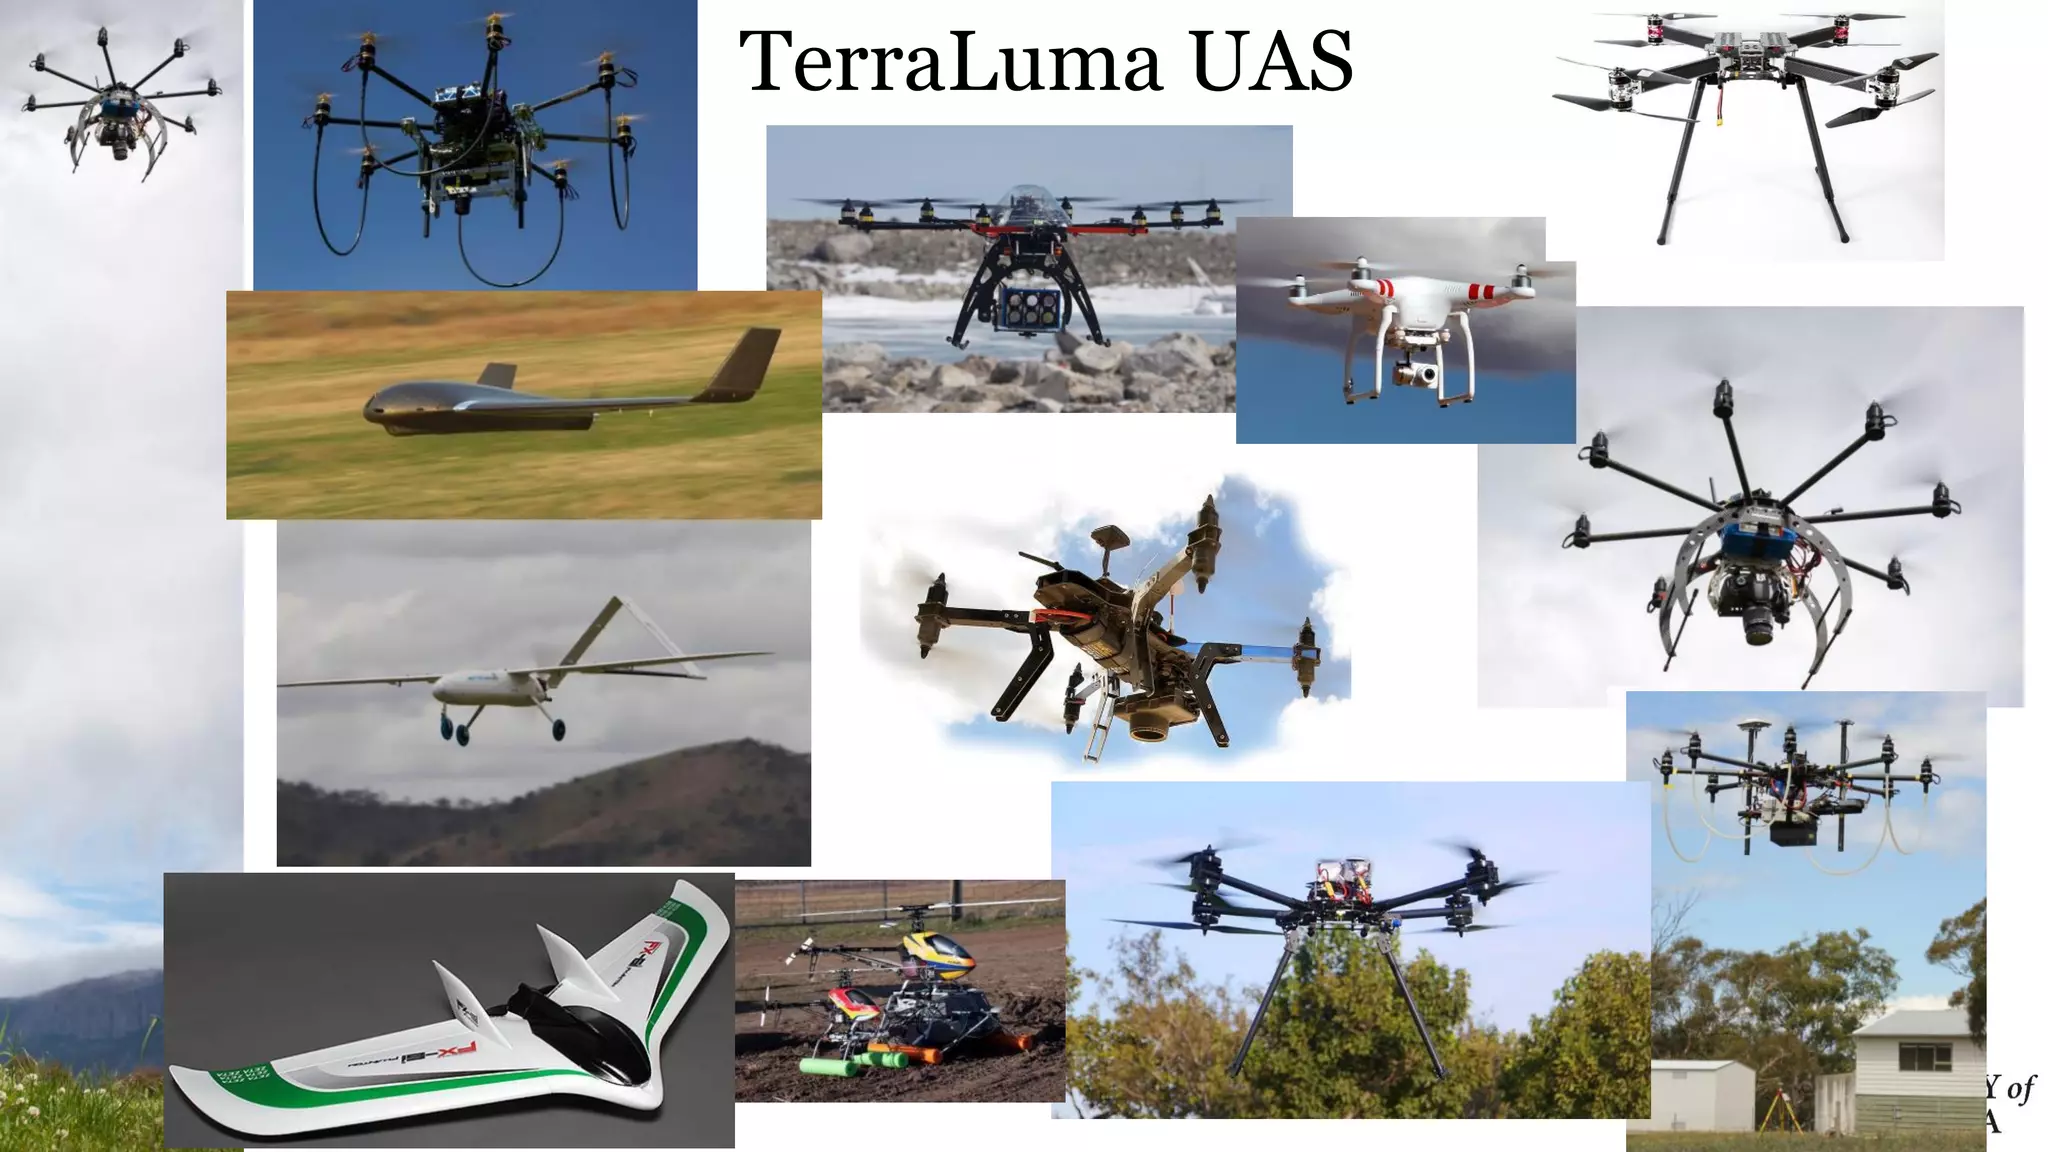
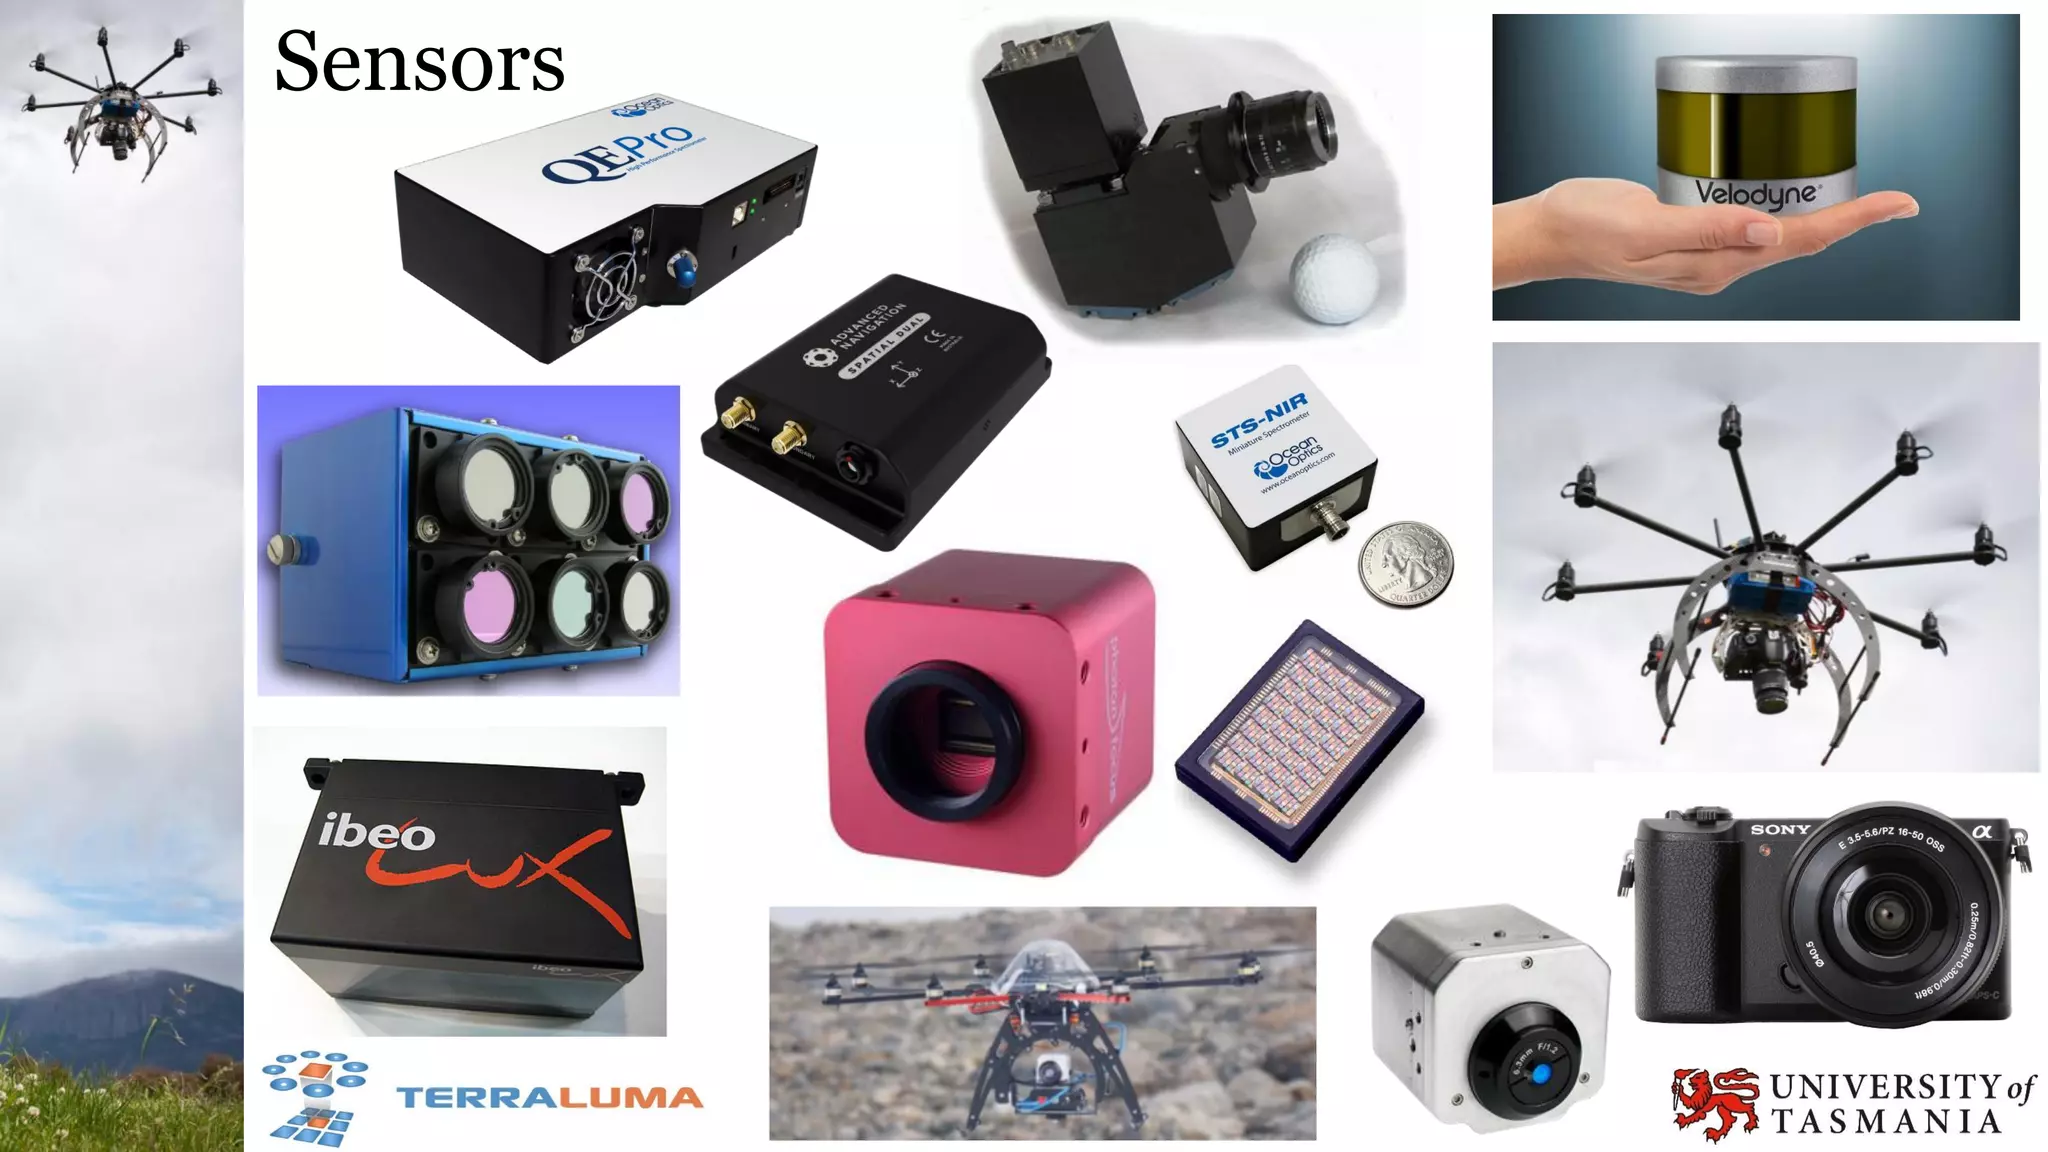
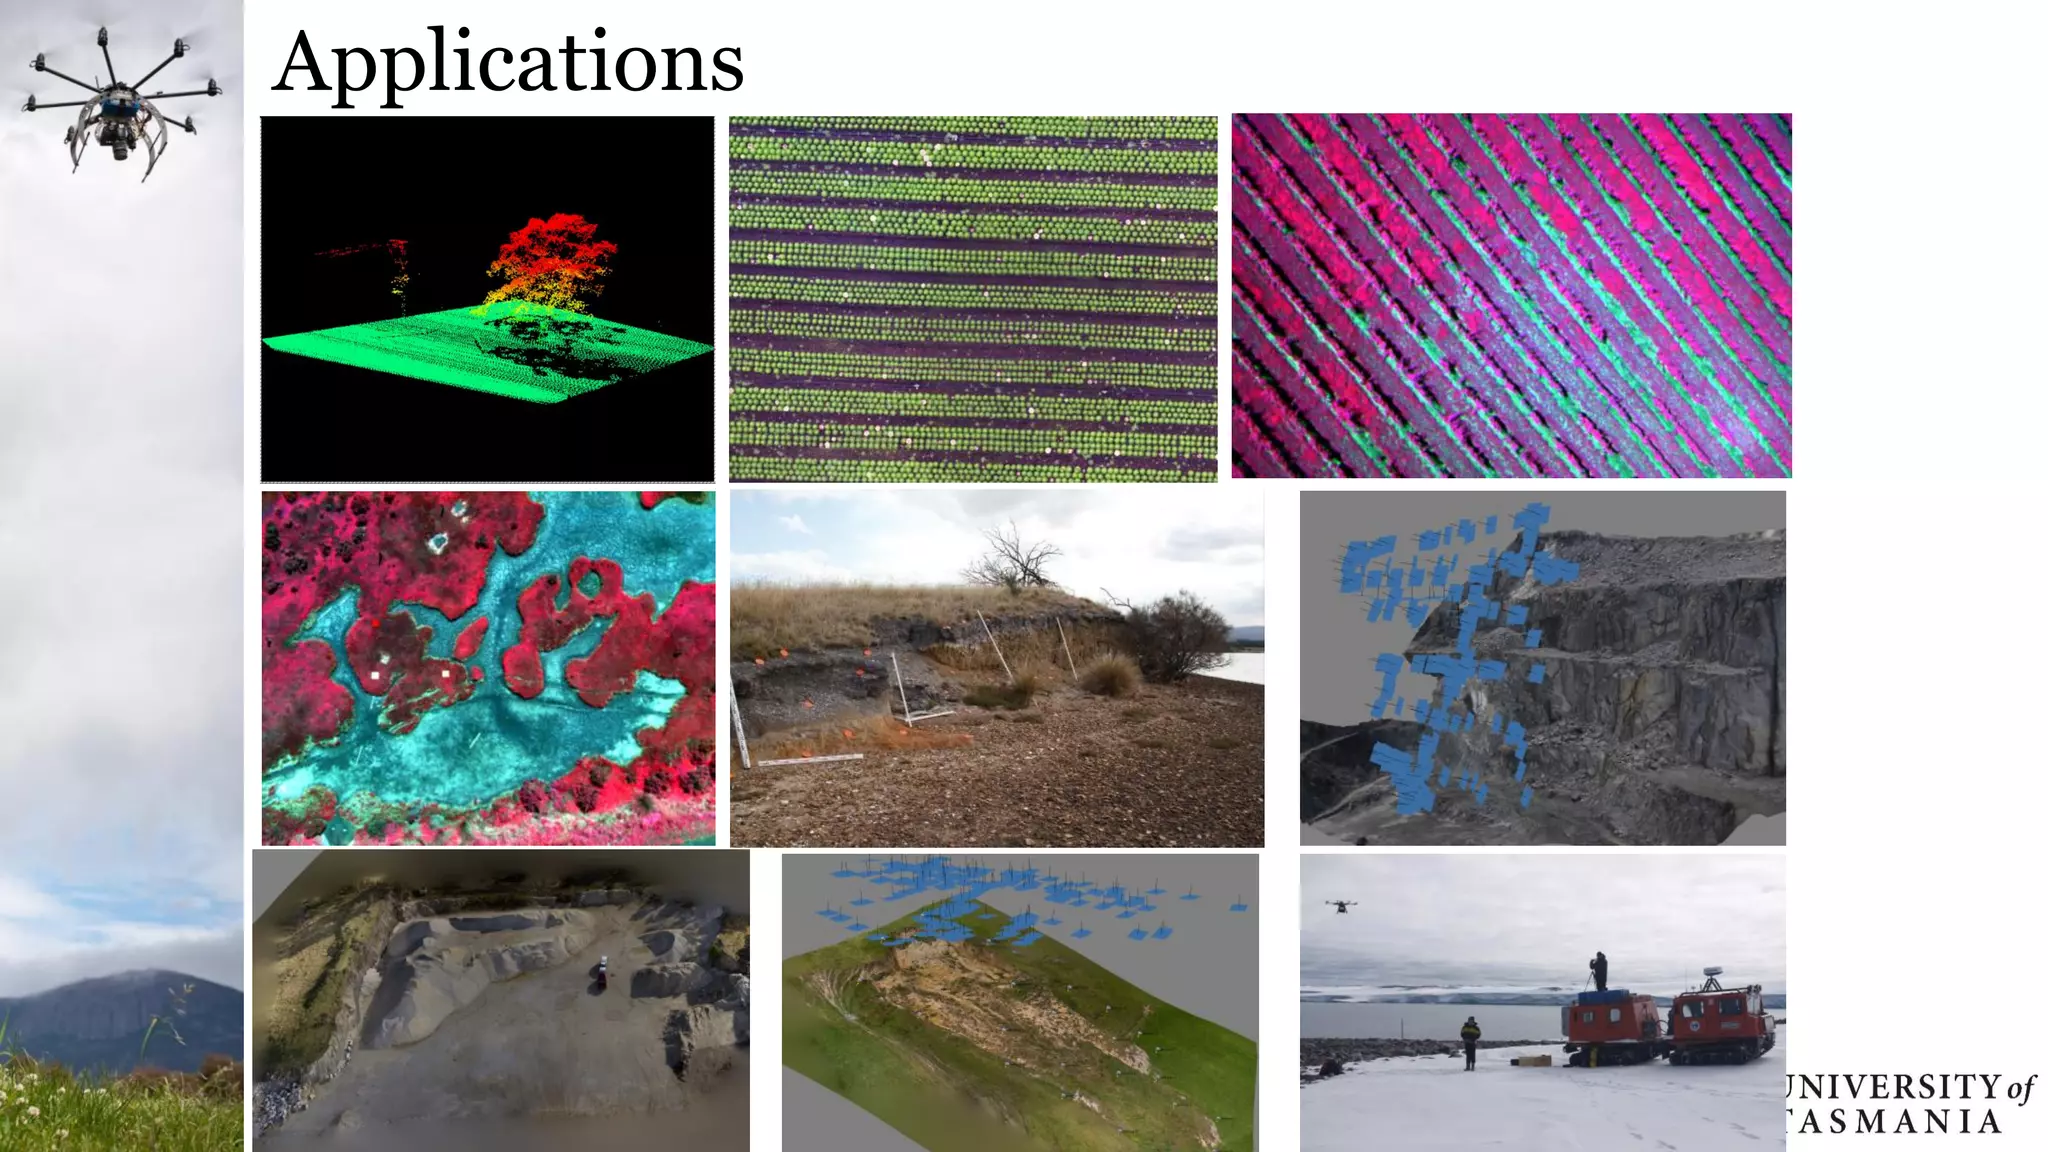
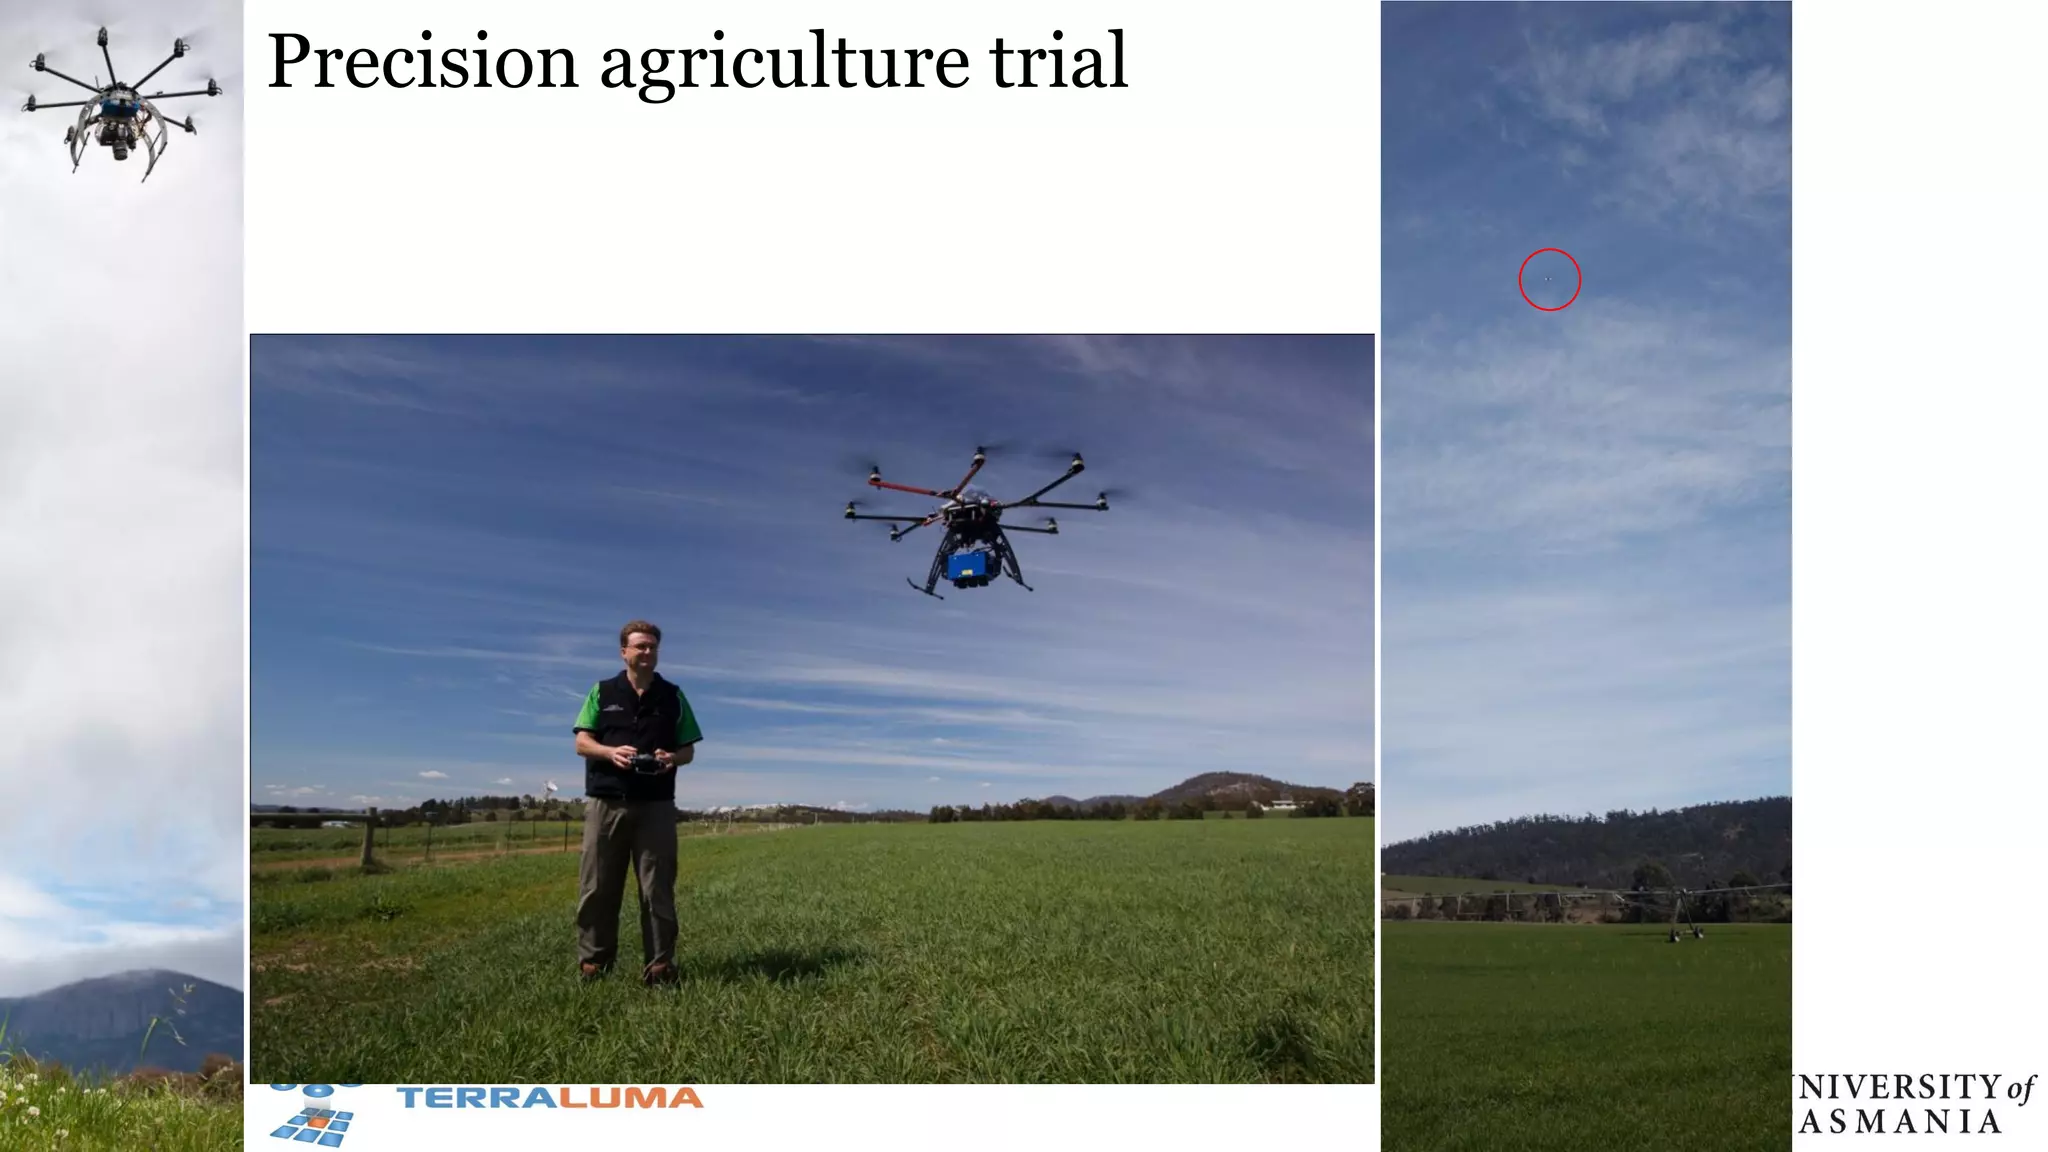
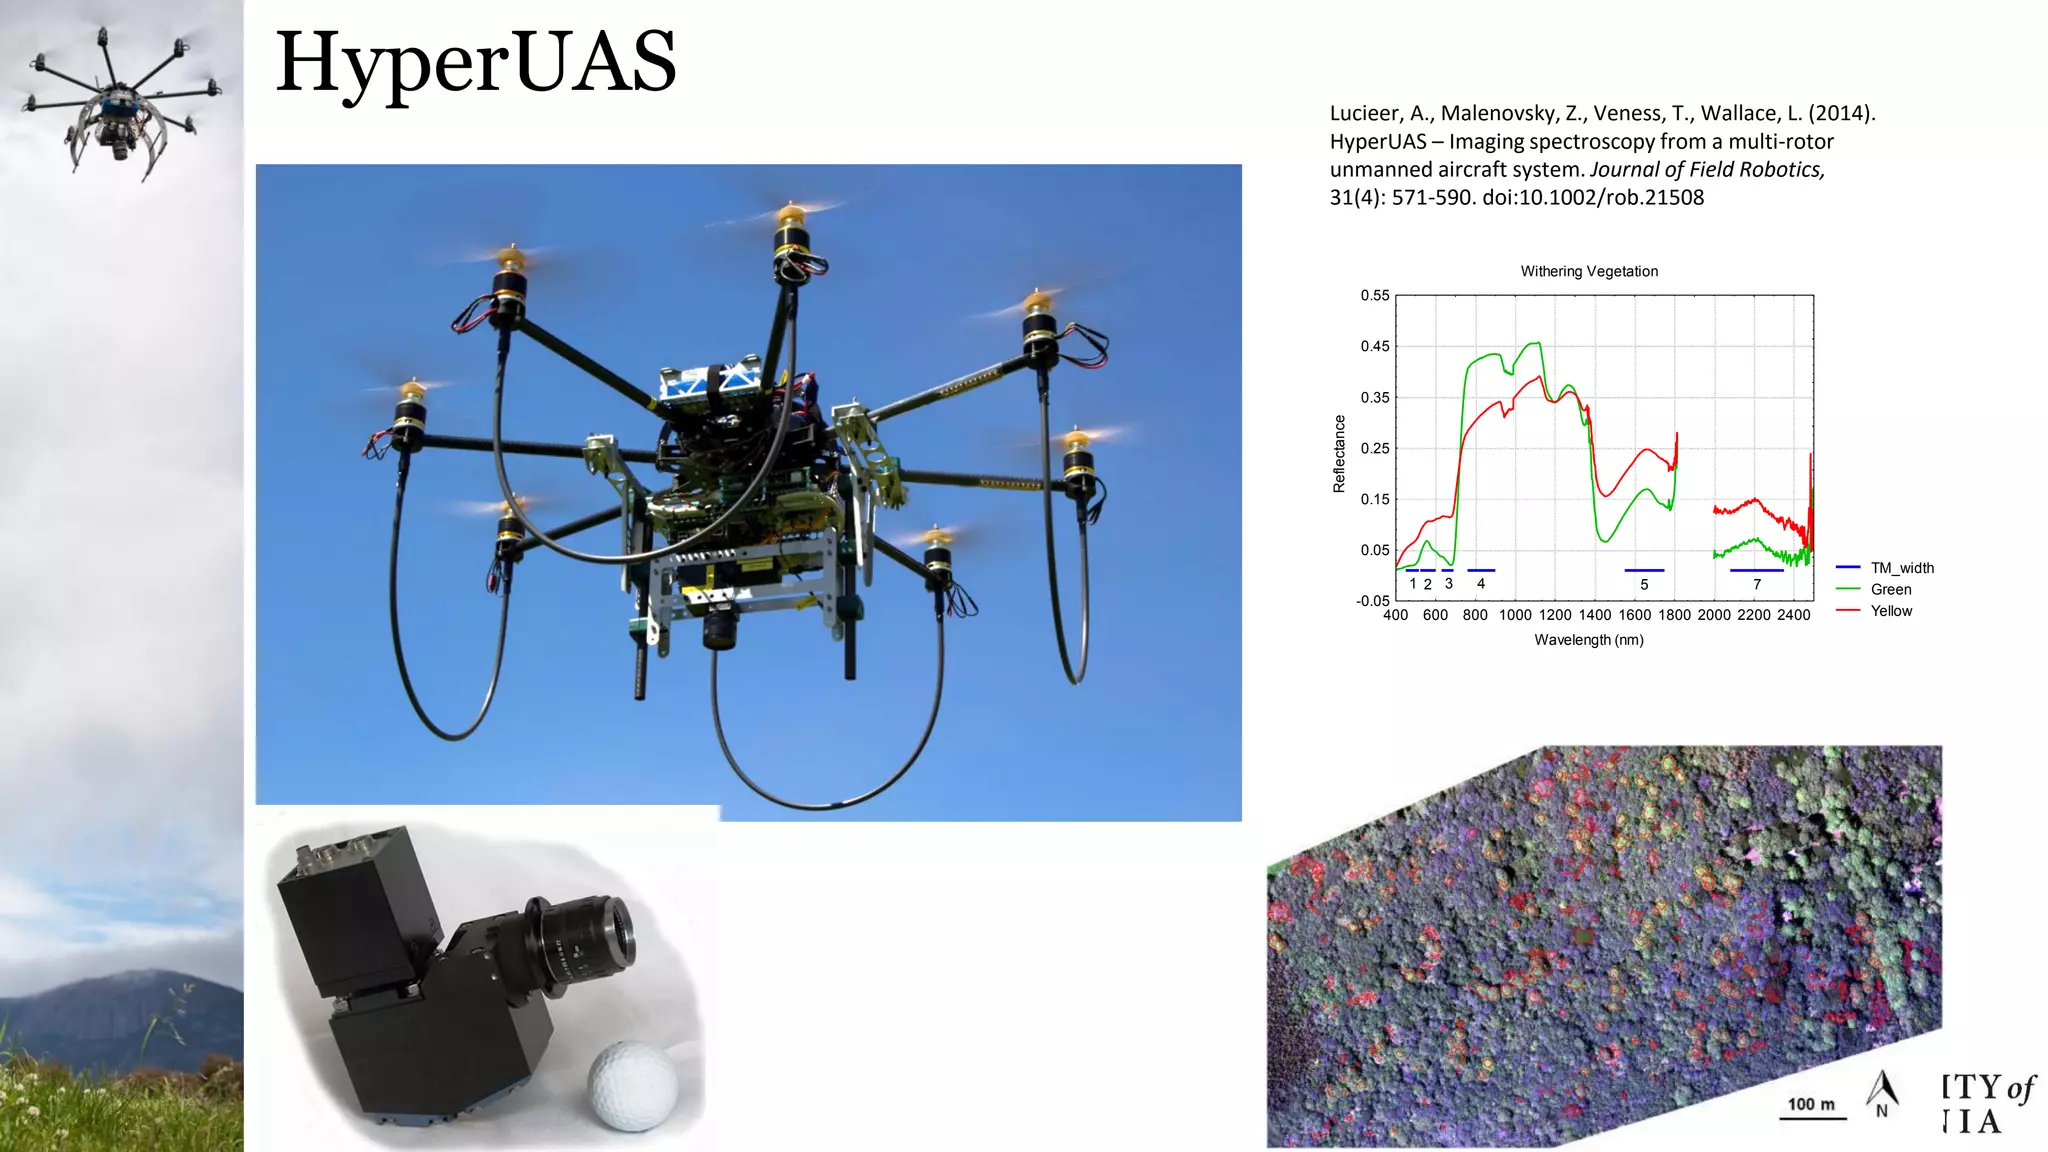
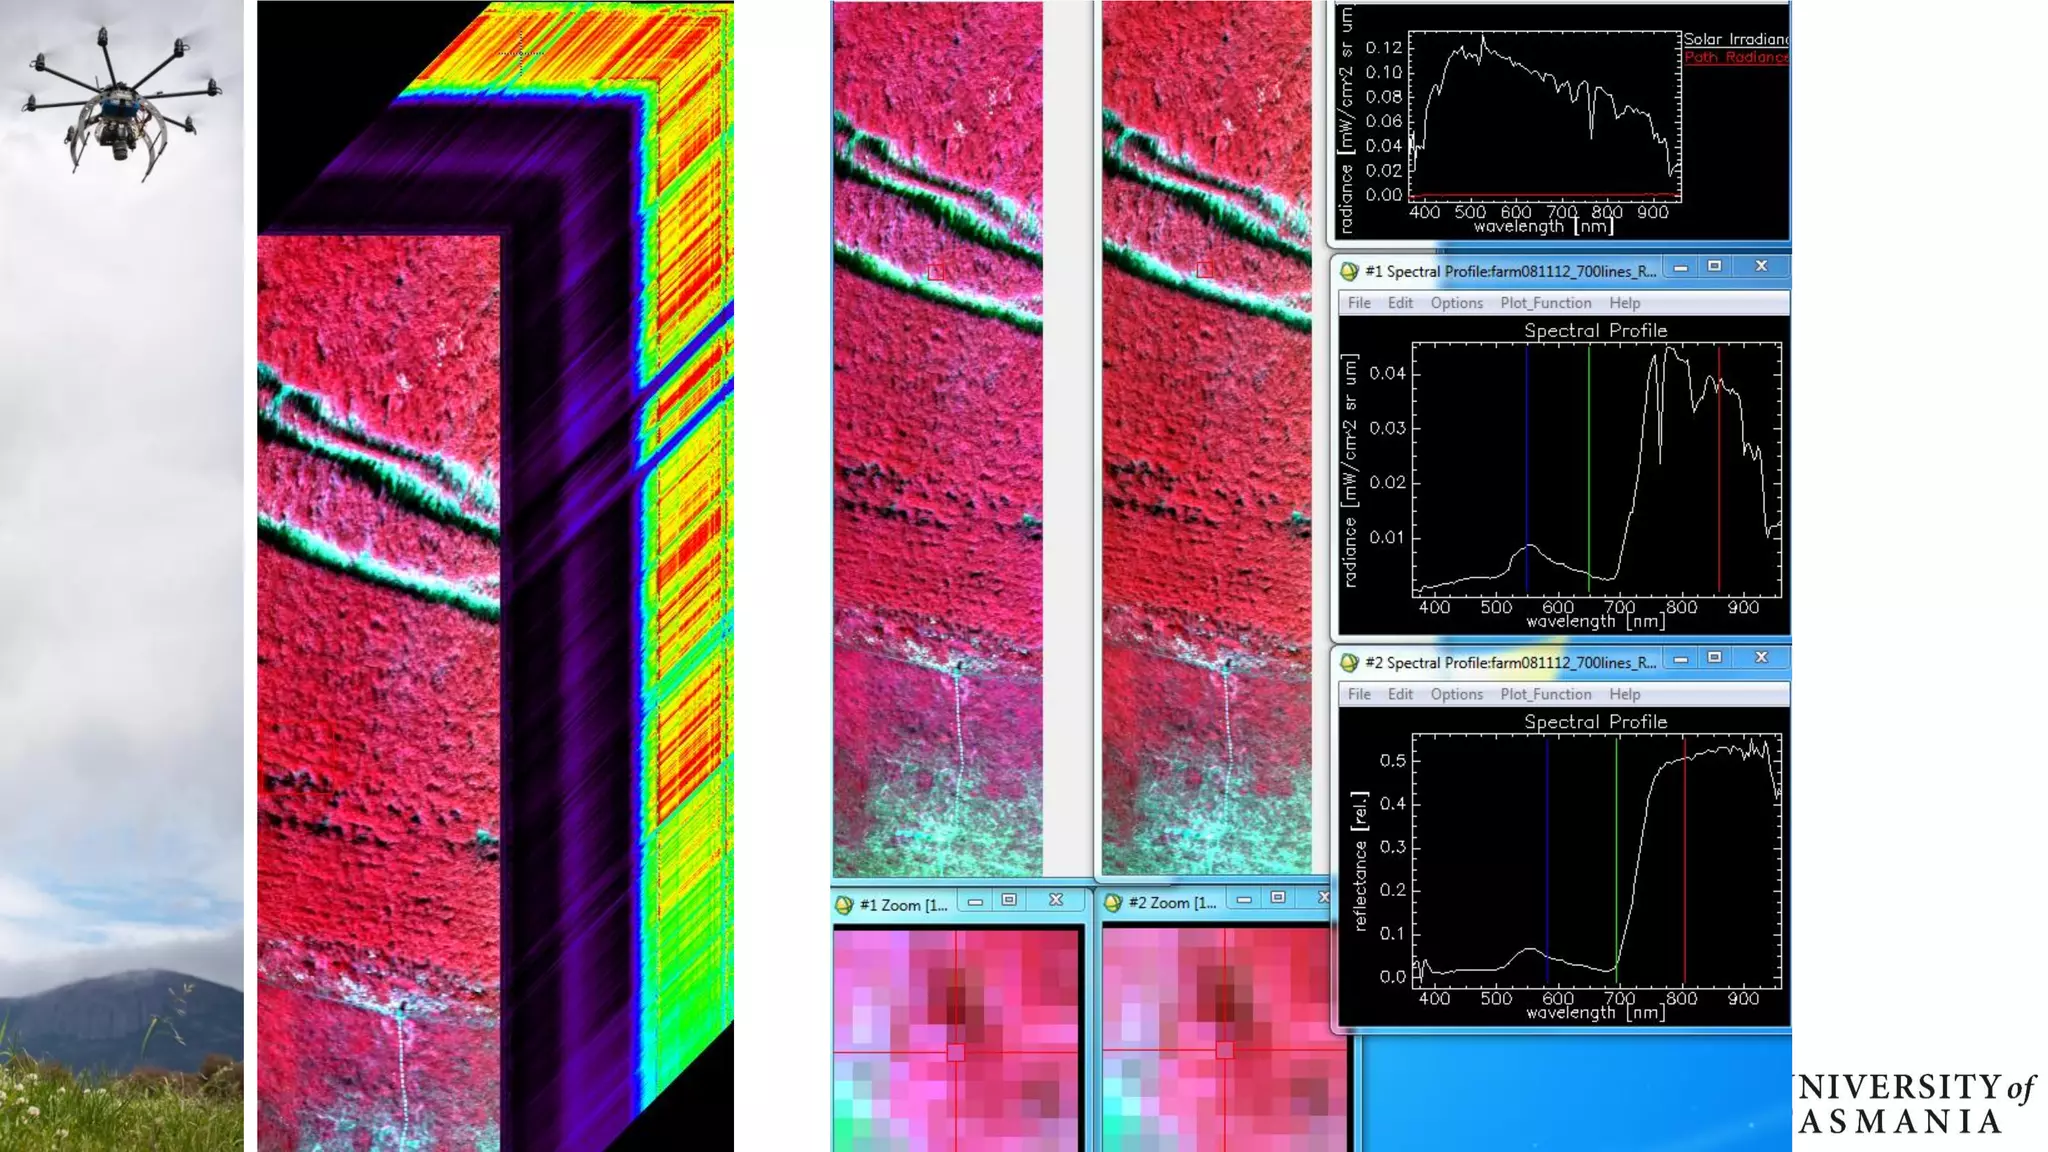
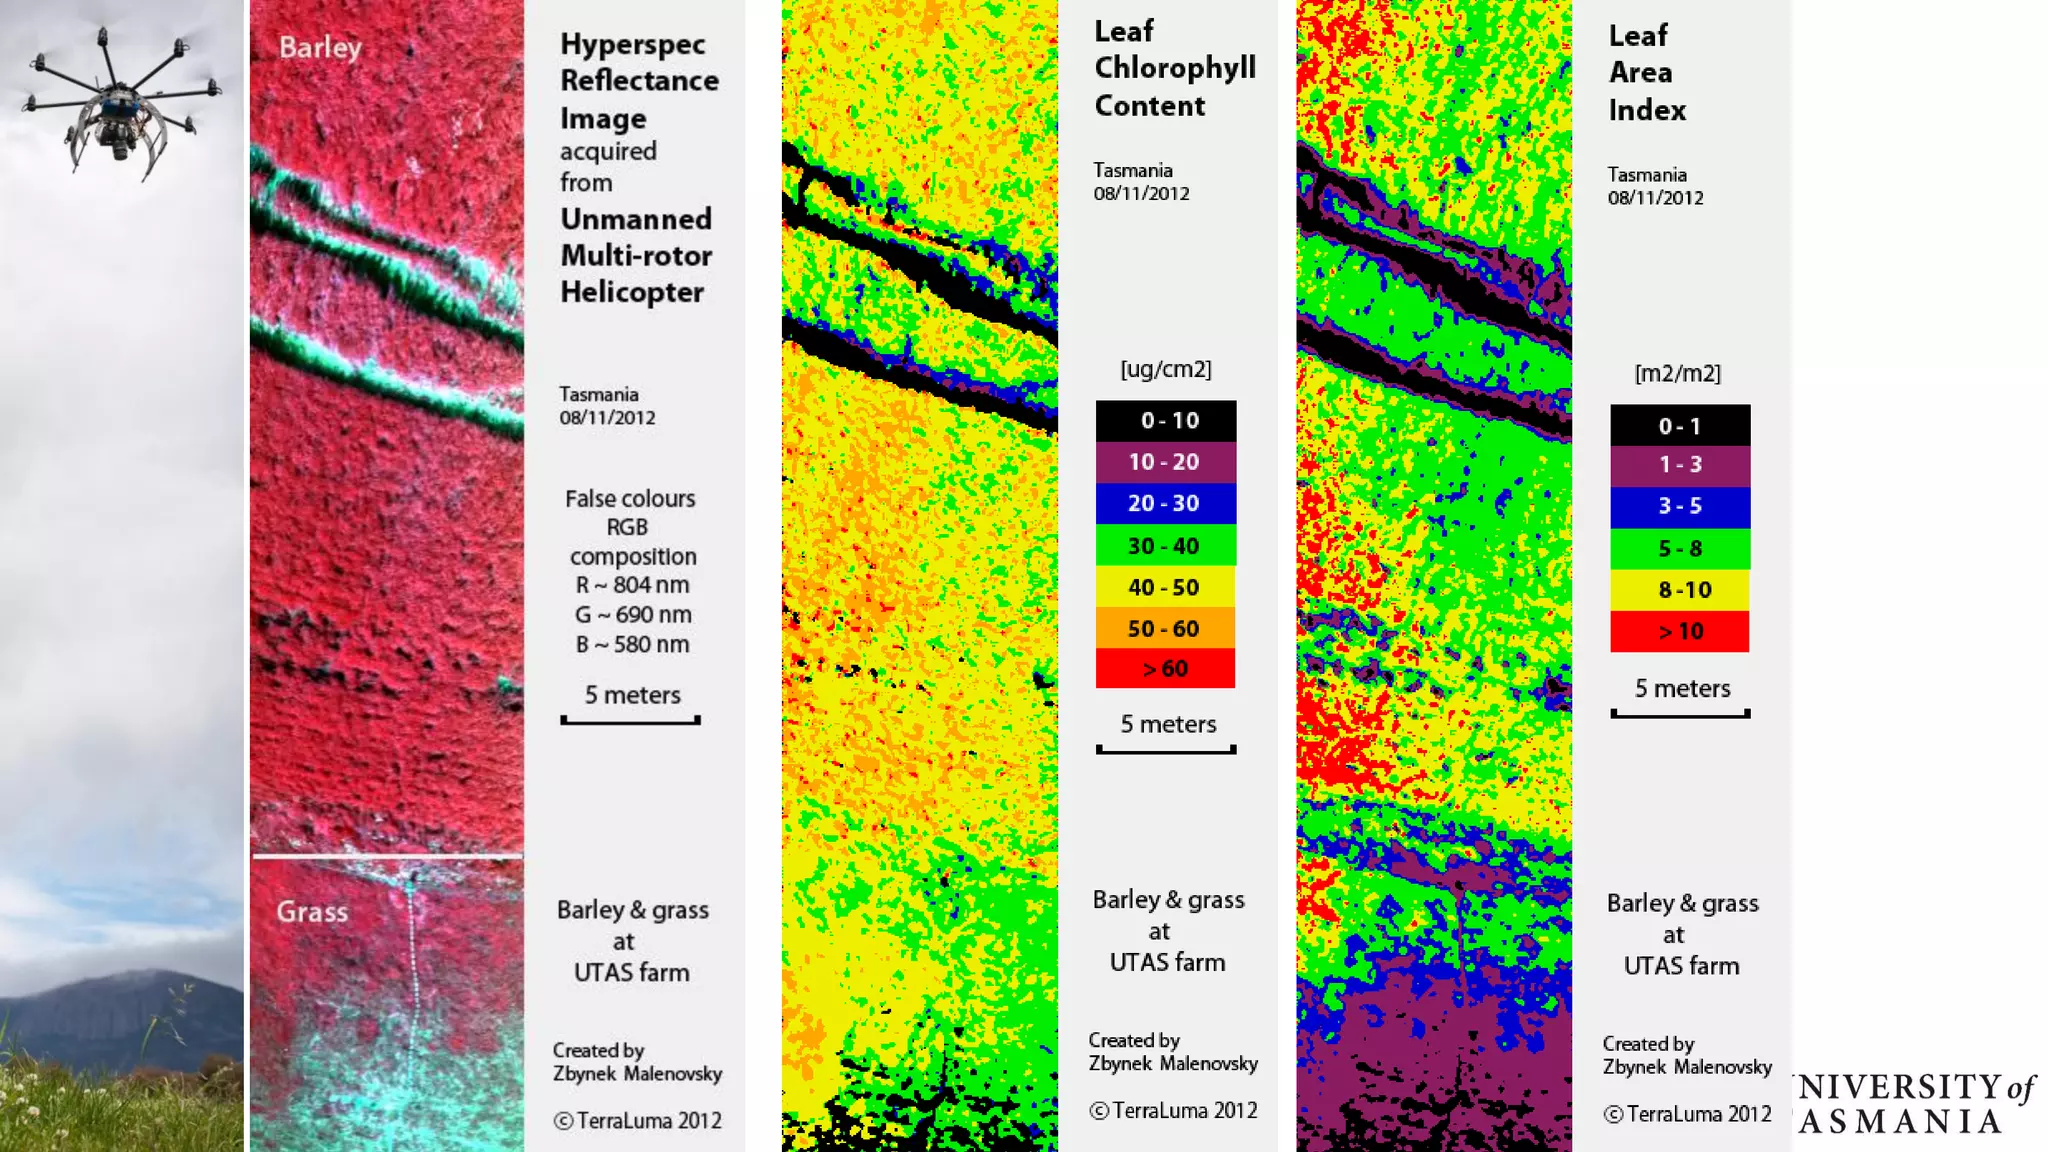
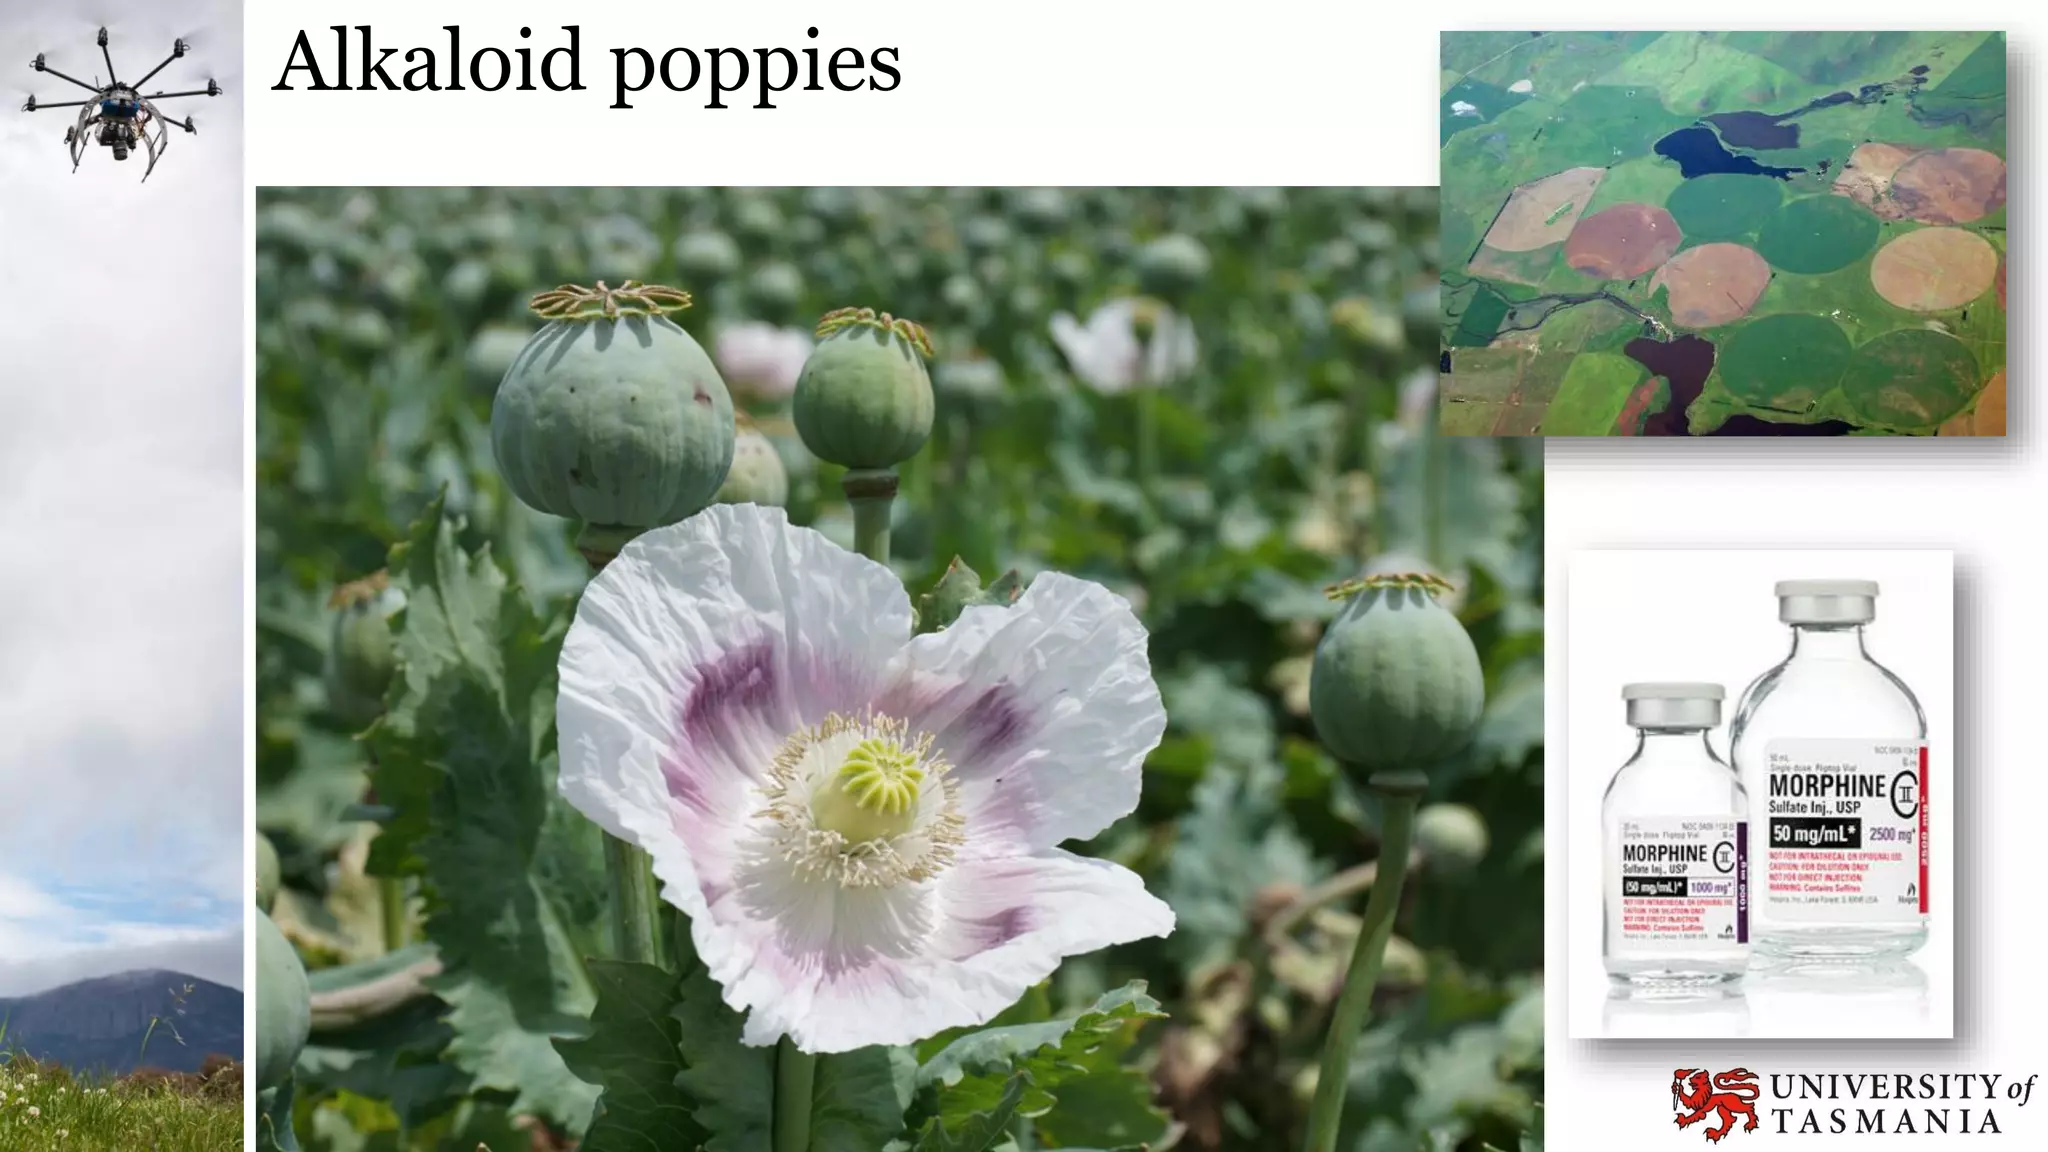
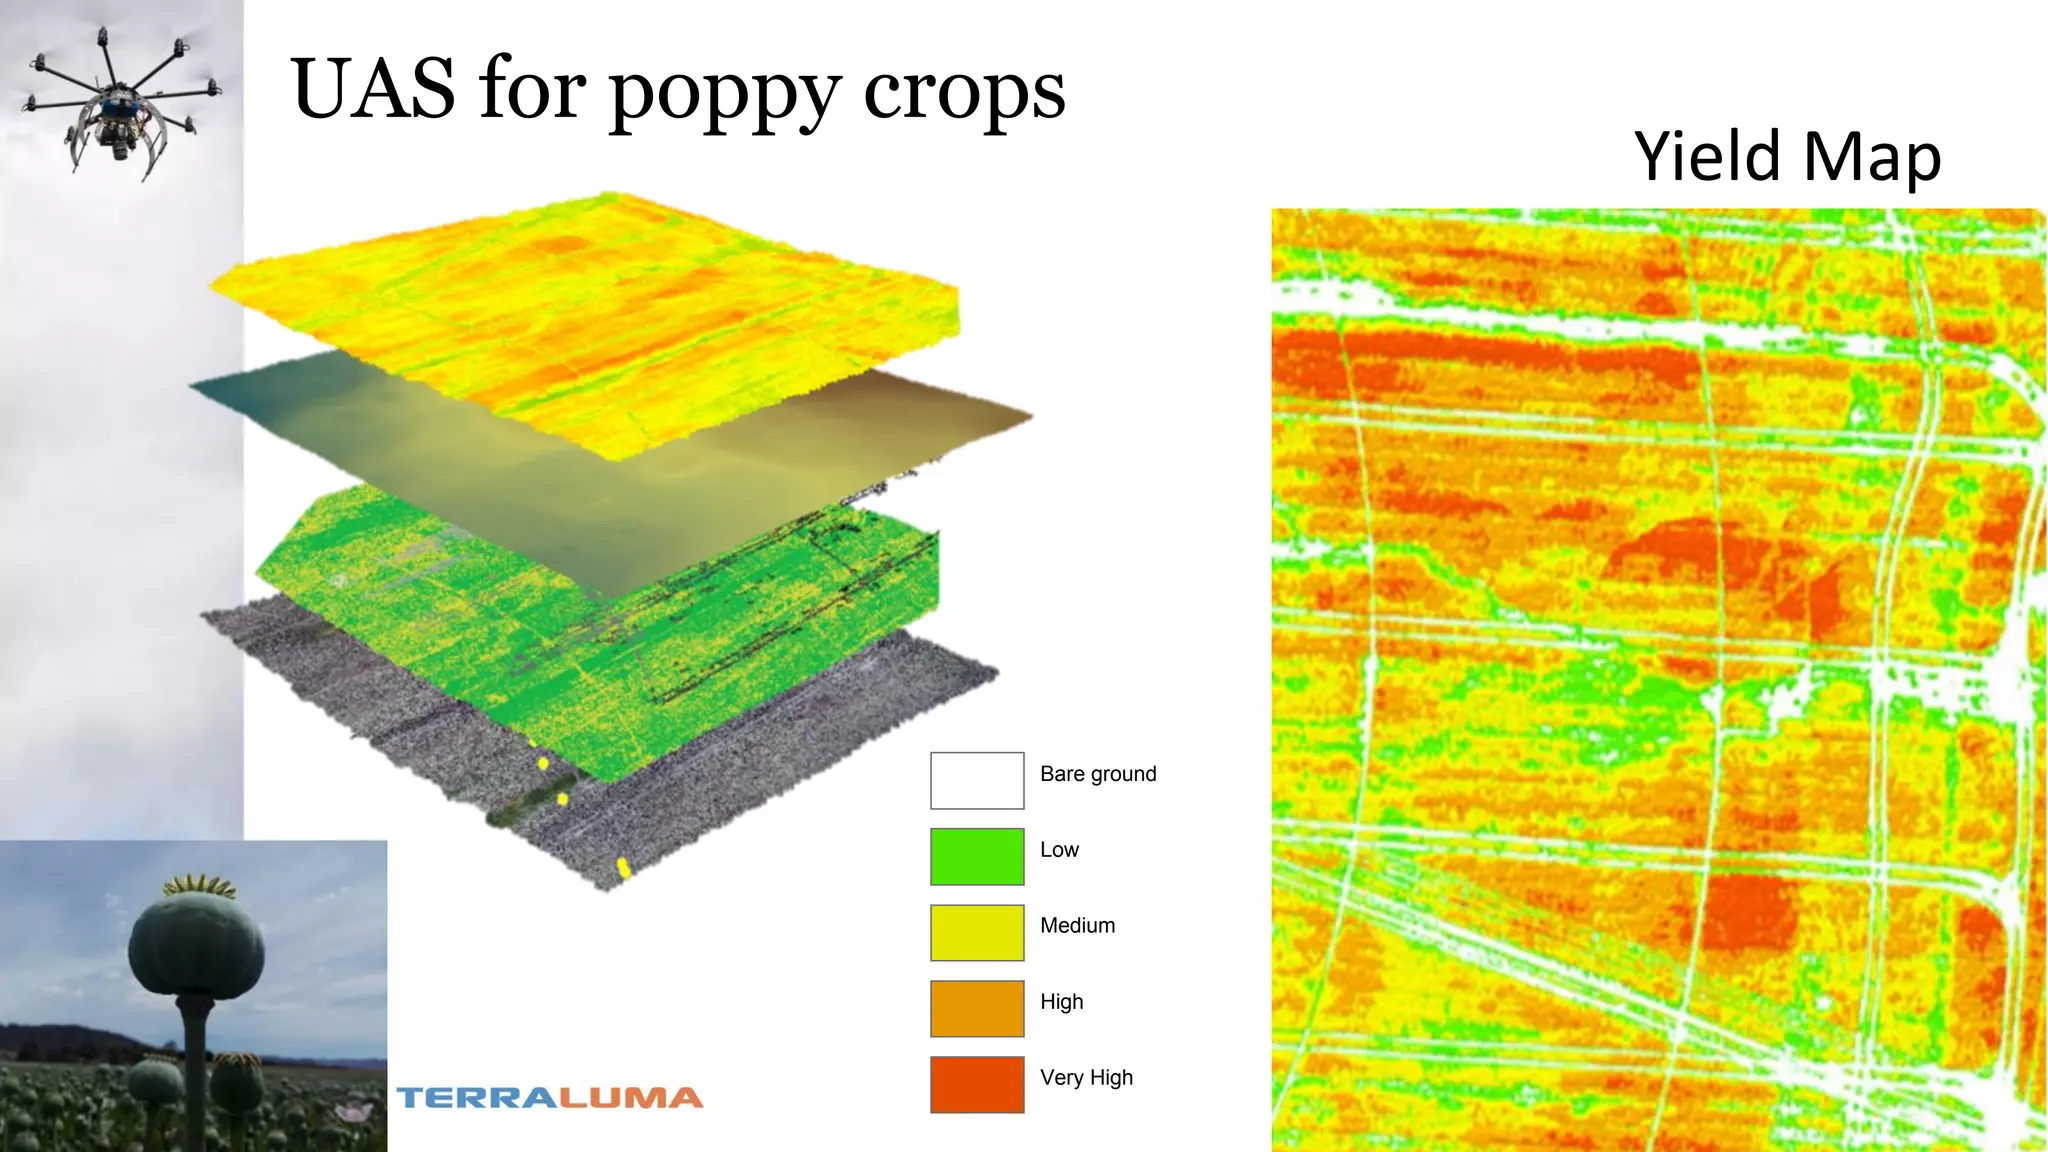
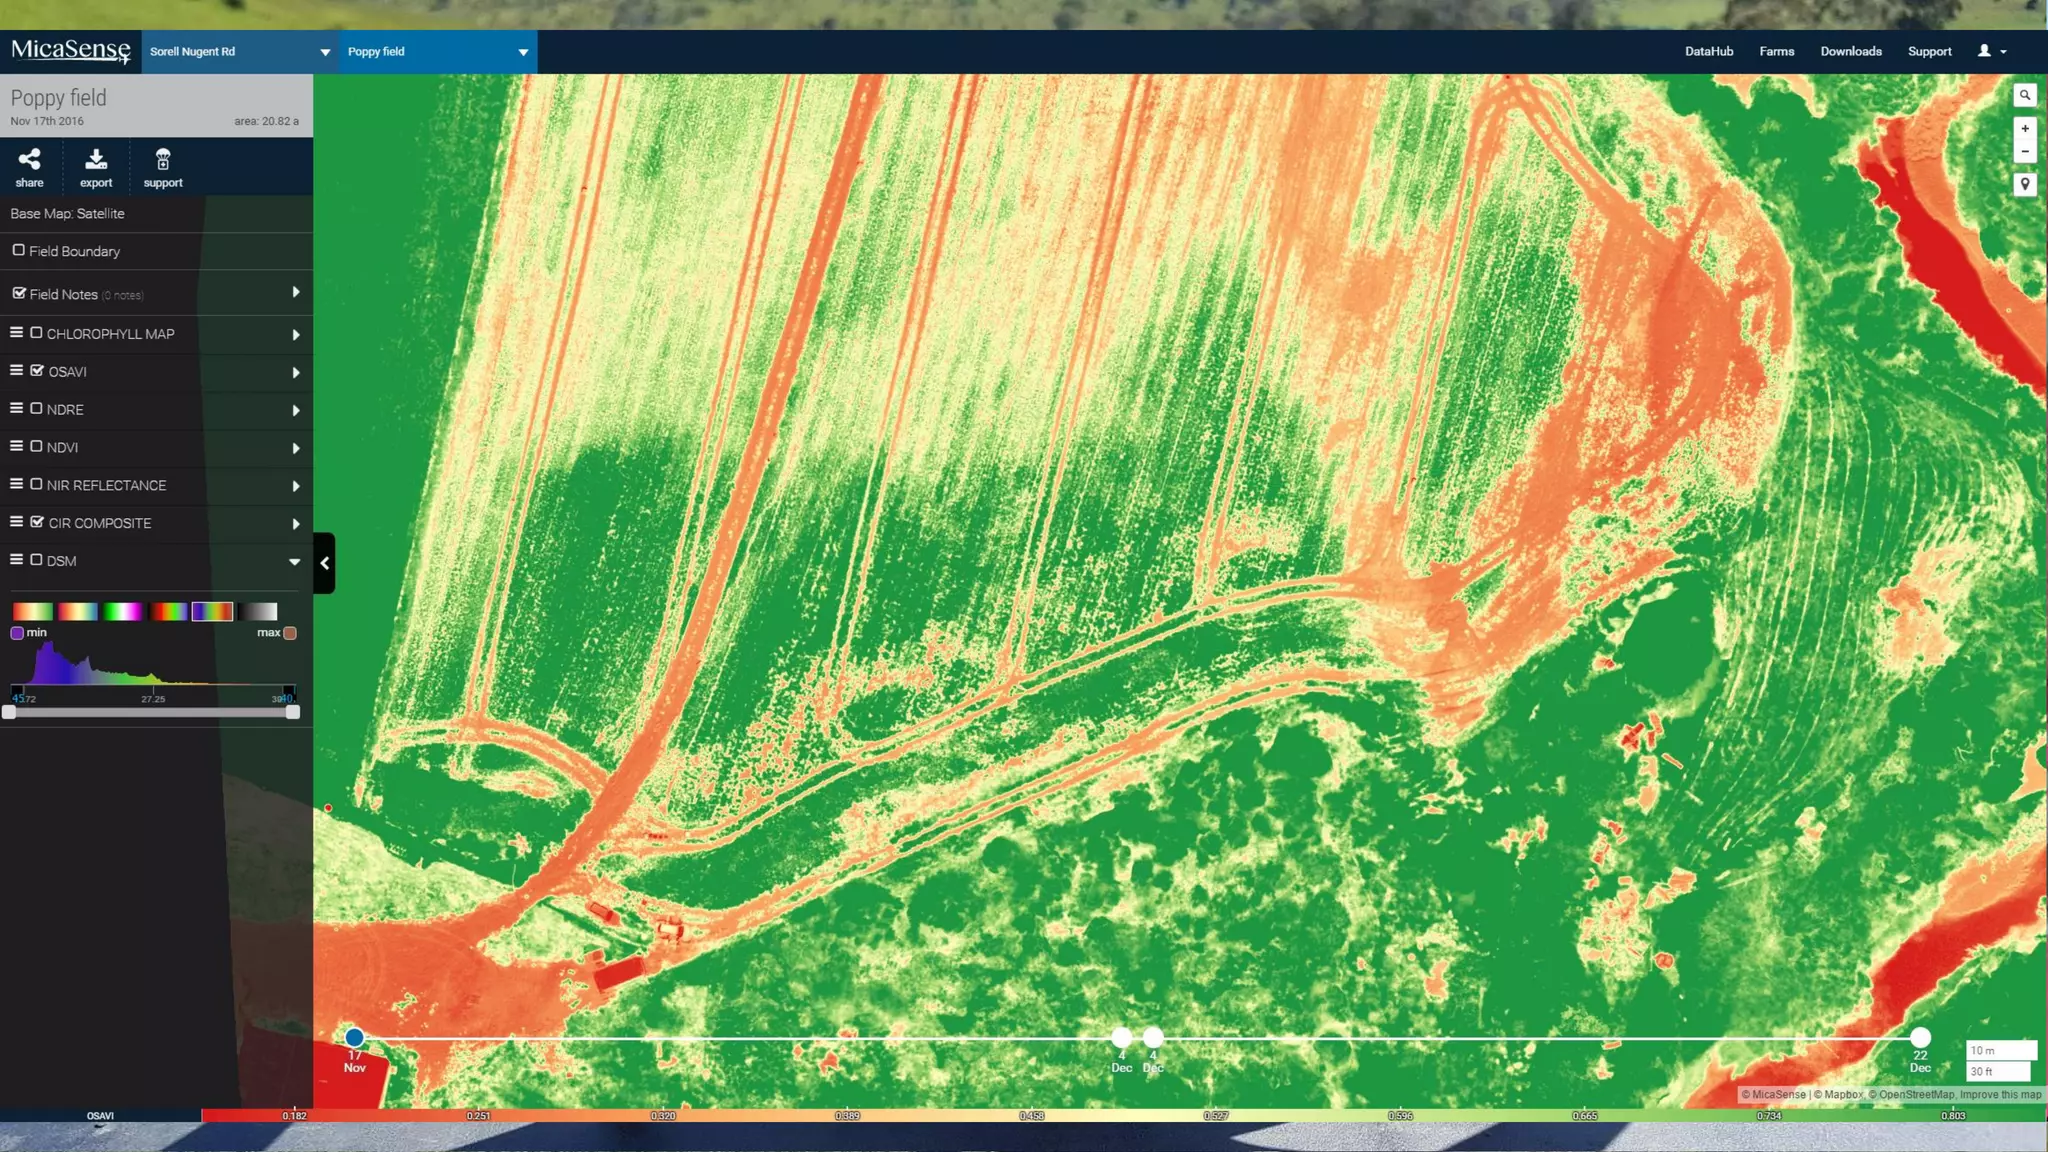
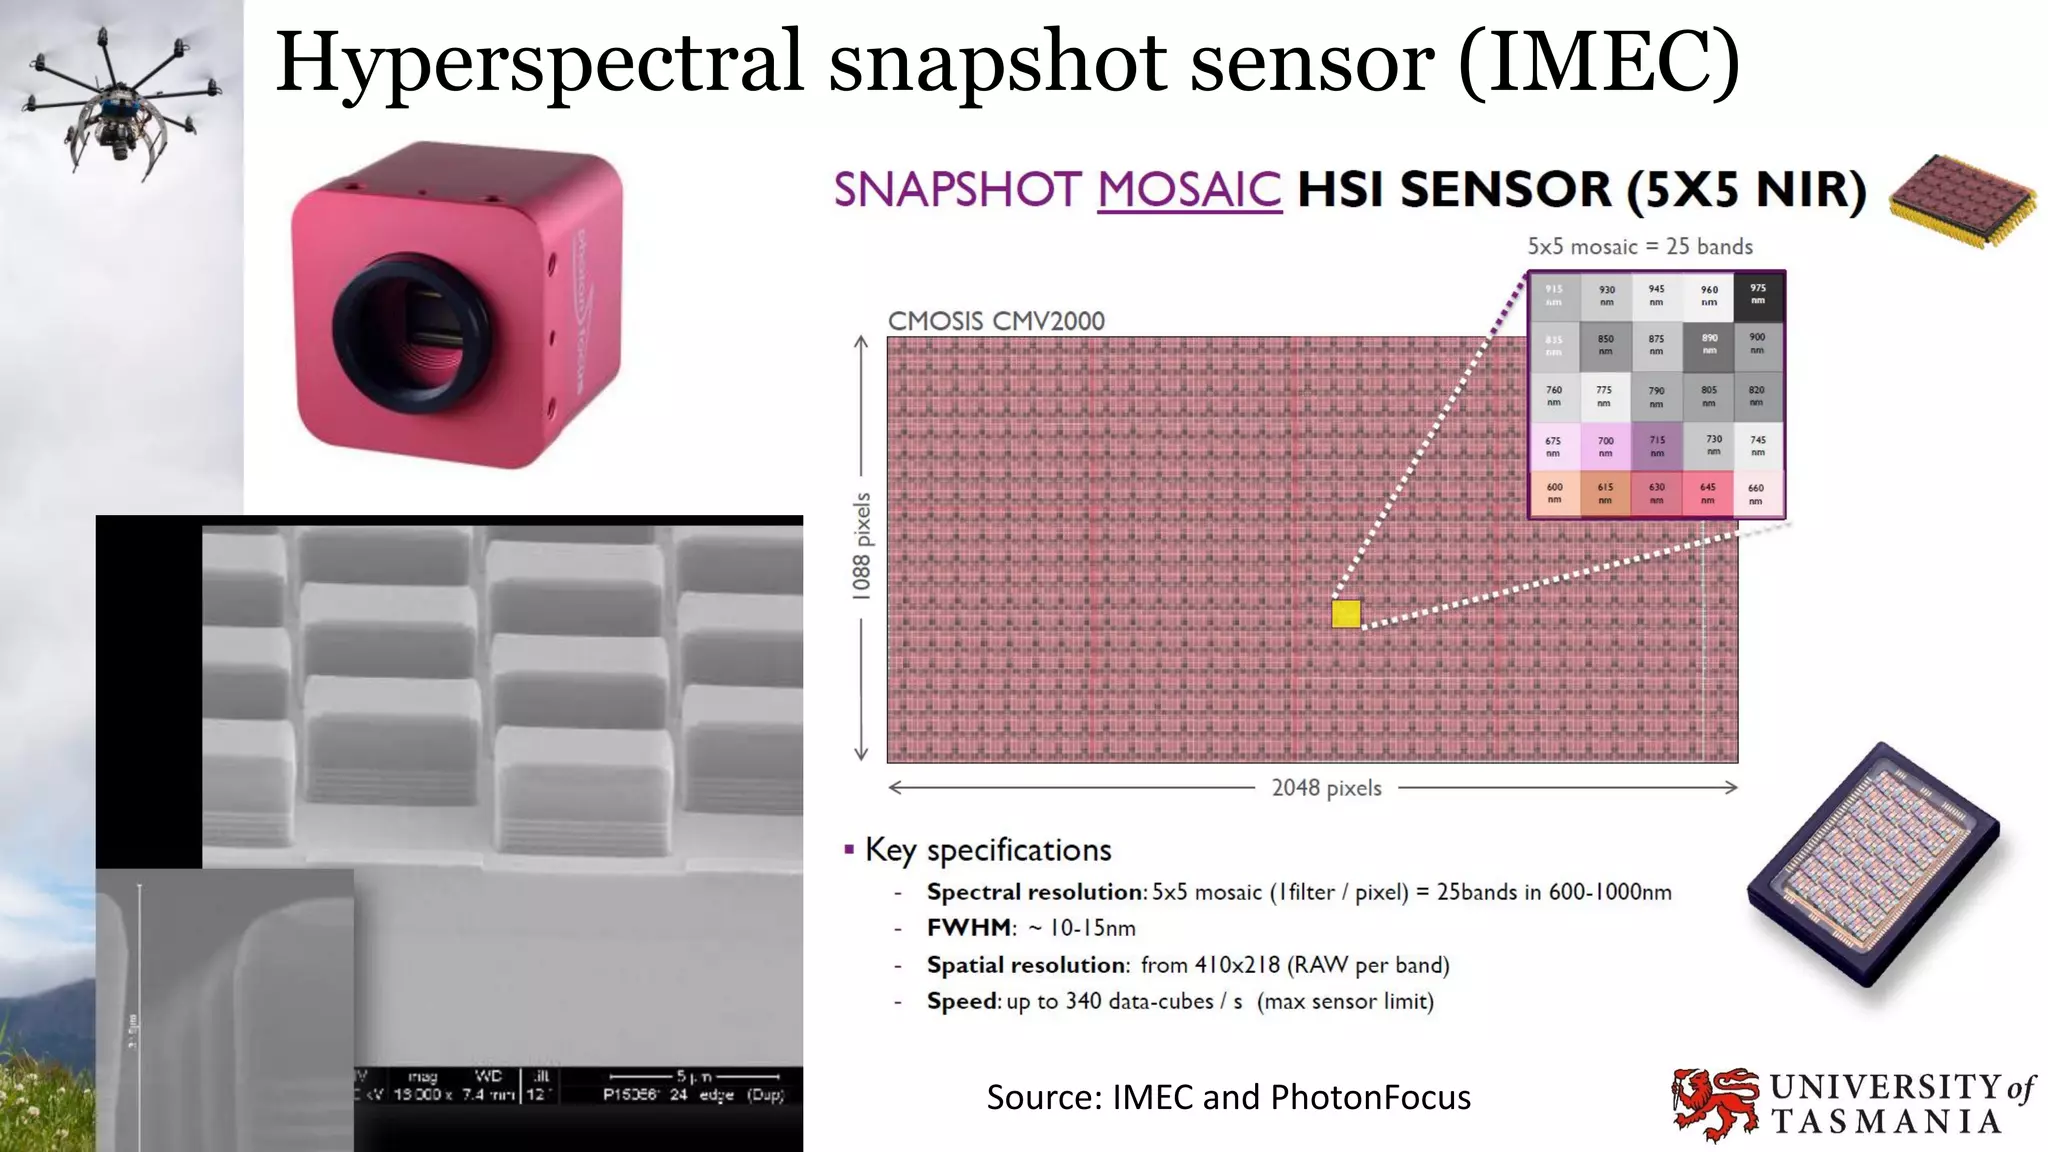
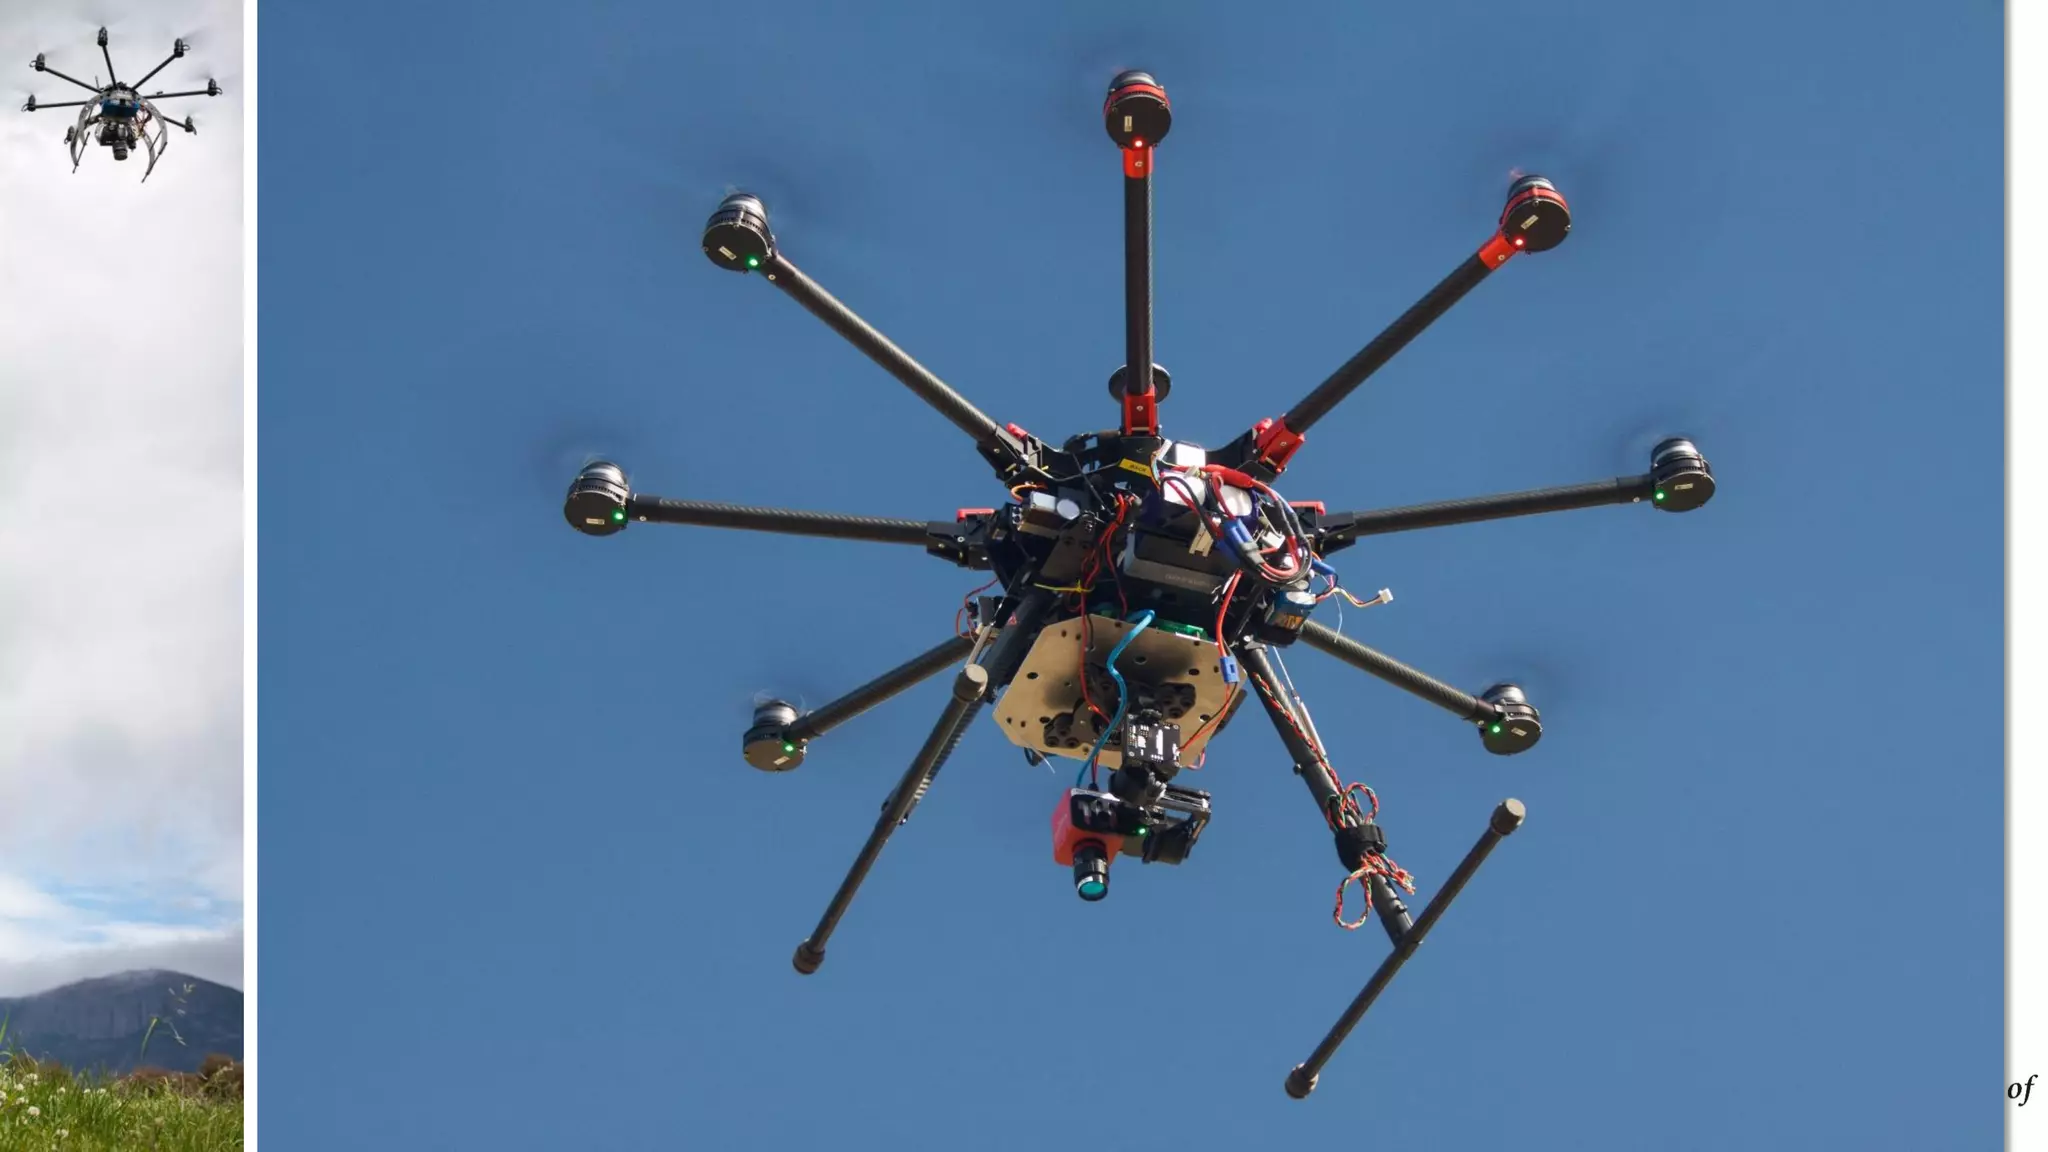
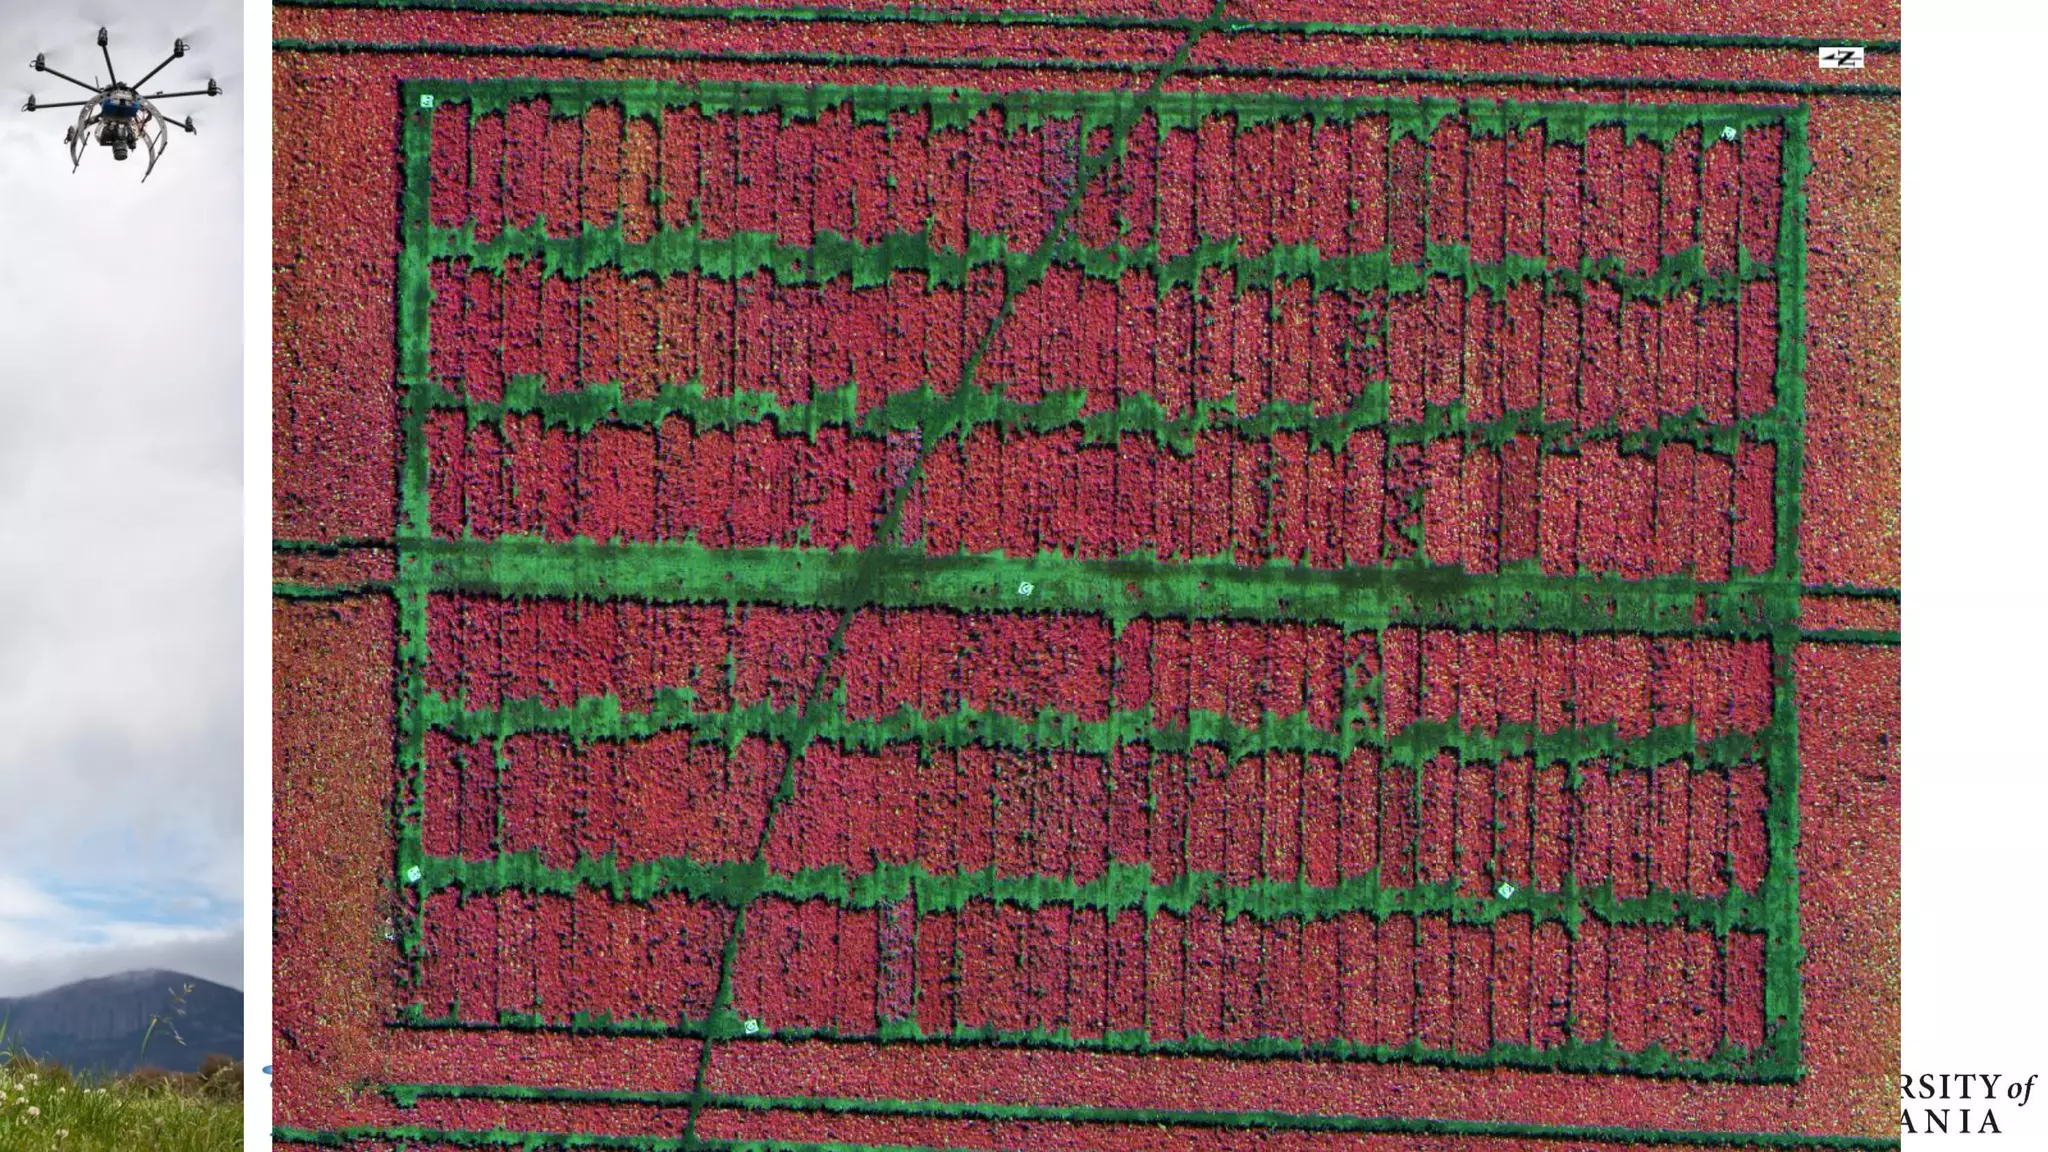
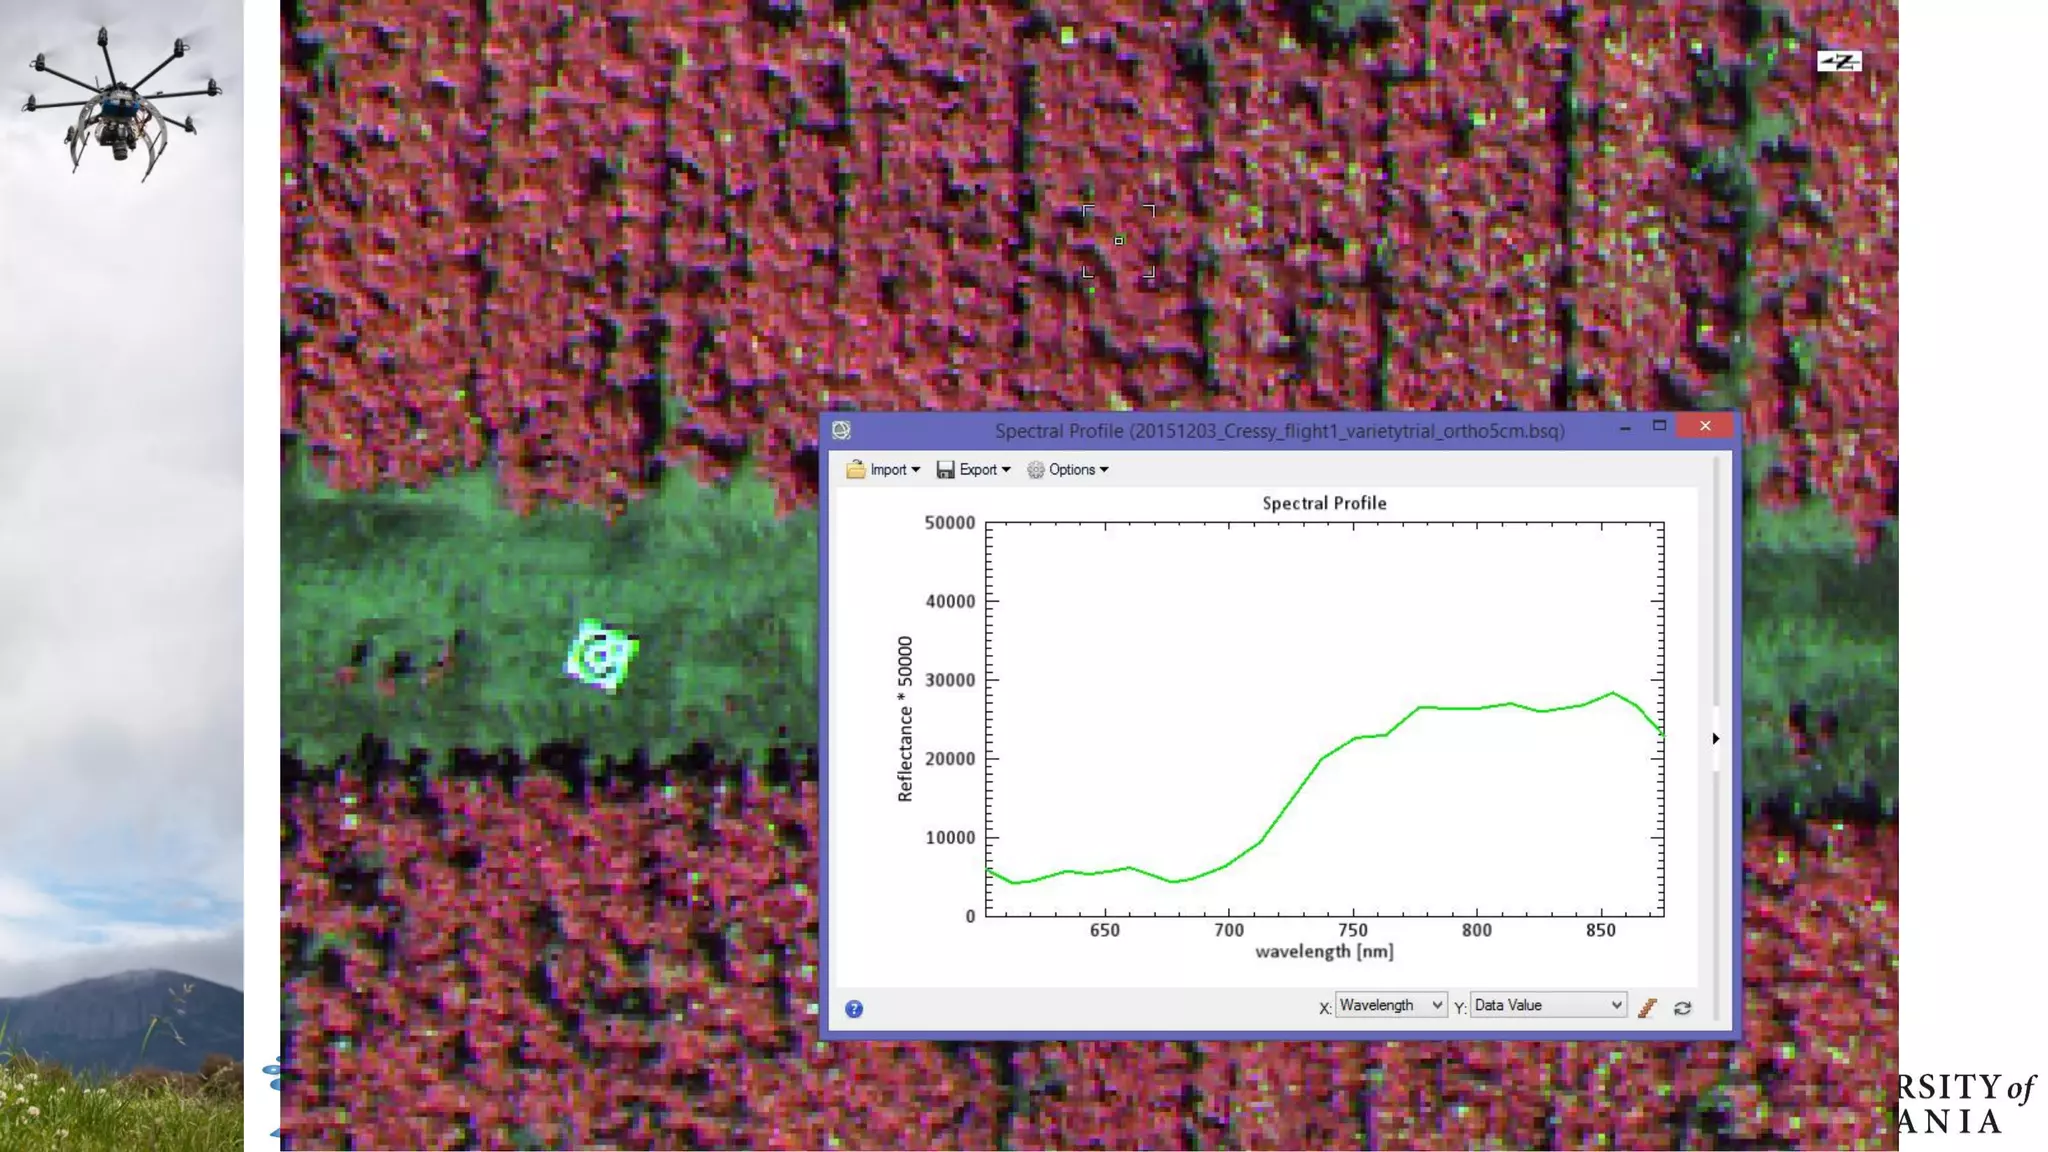
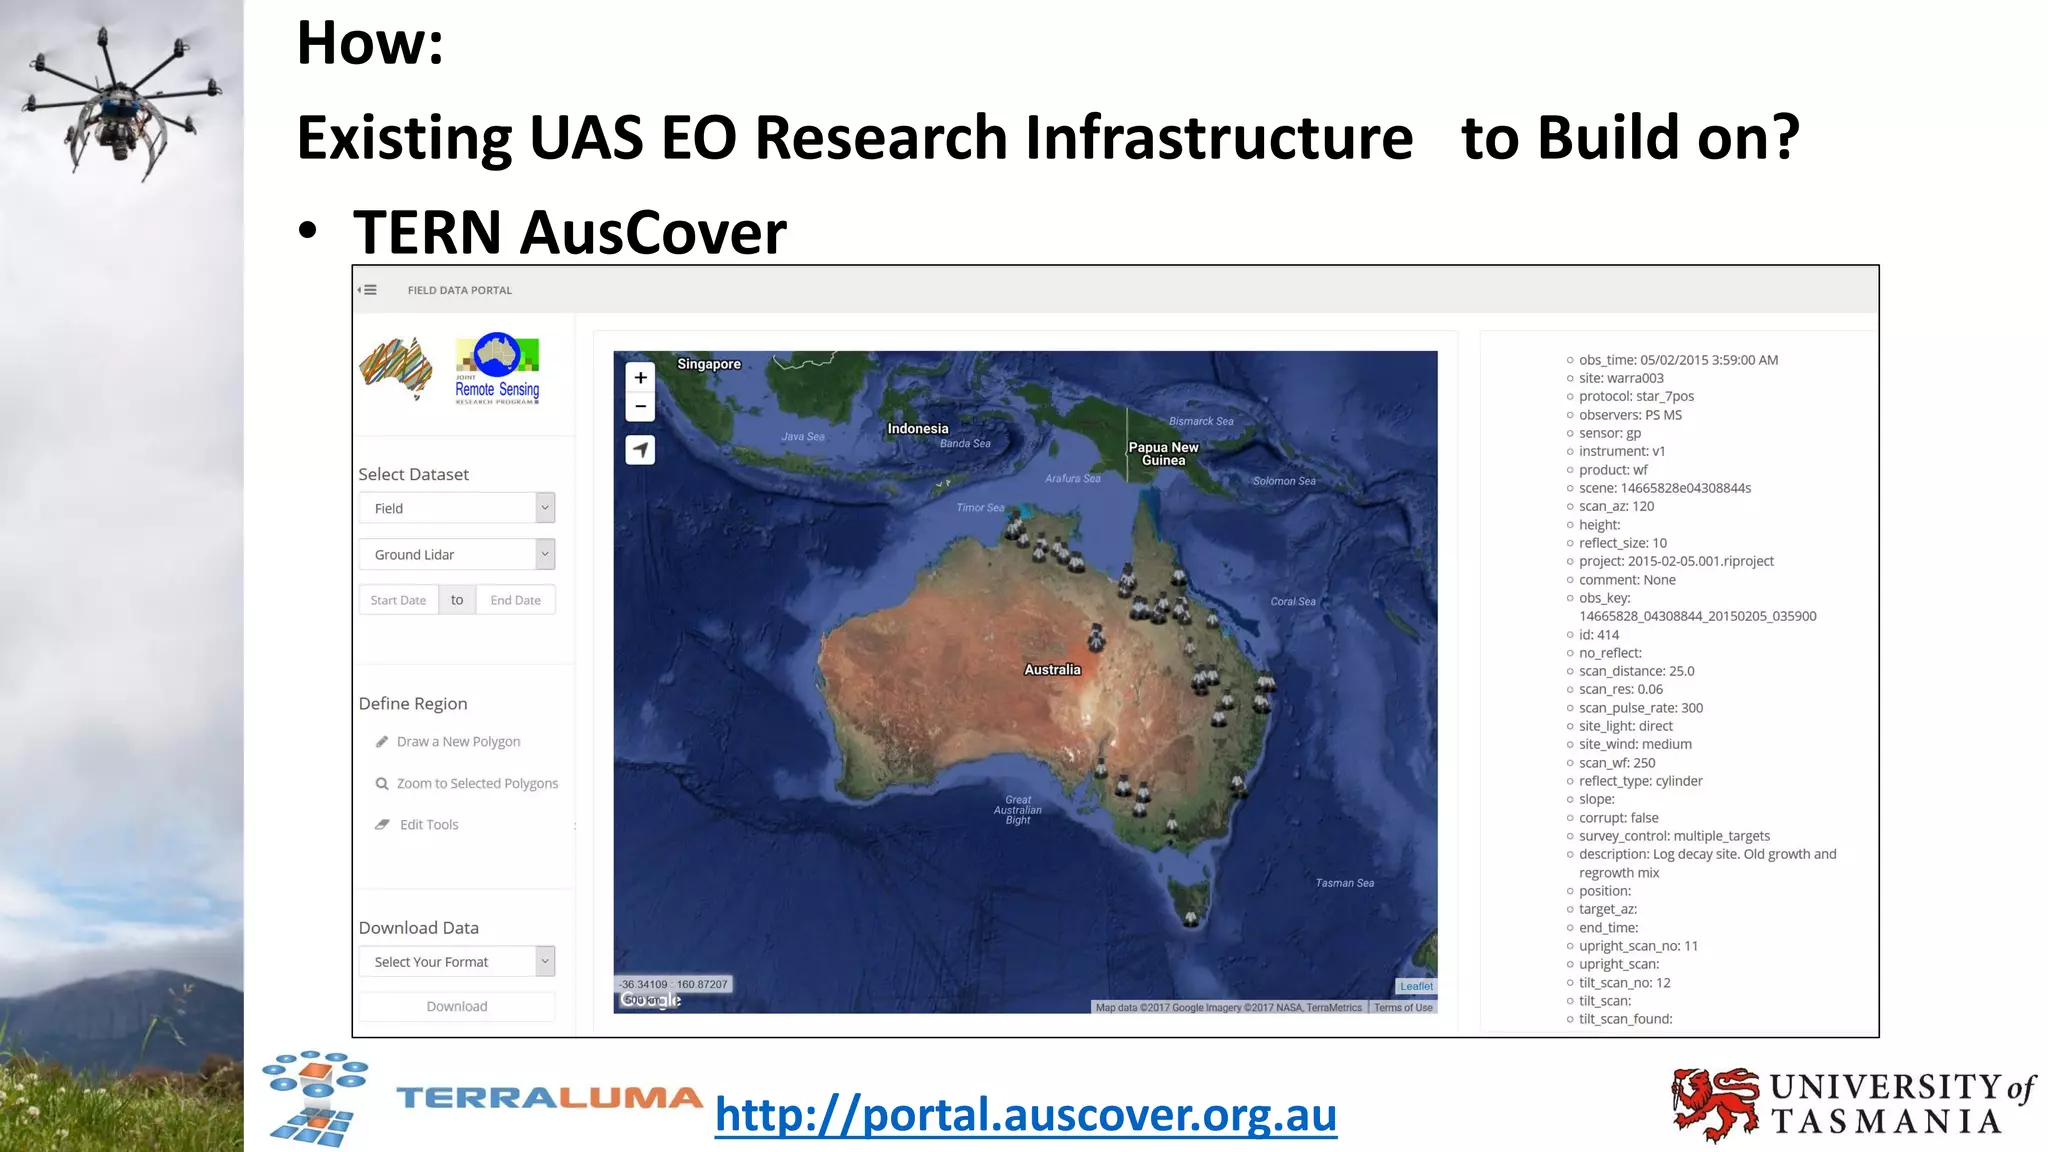

The document discusses the use of unmanned aircraft systems (UAS) for quantitative remote sensing in environmental and agricultural applications, emphasizing their advantages over traditional satellite imagery, including higher spatial and temporal resolution. It highlights various applications such as precision agriculture, crop monitoring, and the importance of data calibration and metadata standards for successful UAS deployment. The future of UAS remote sensing presents exciting possibilities, necessitating continued research and demonstrator studies to overcome current challenges.


