Download as PDF, PPTX
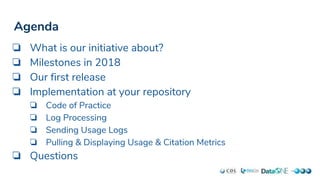

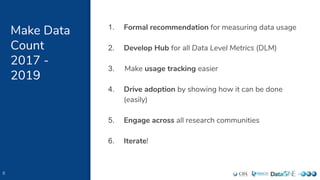
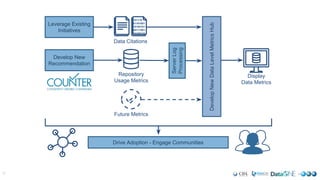
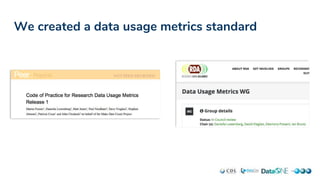
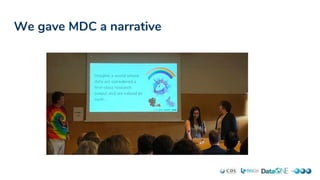
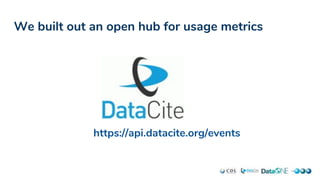
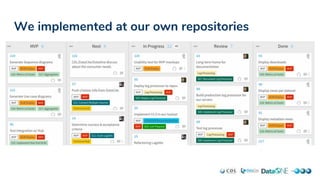
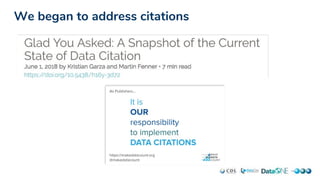
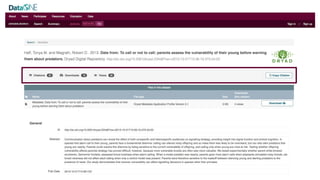


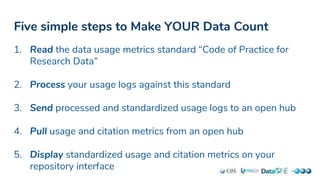
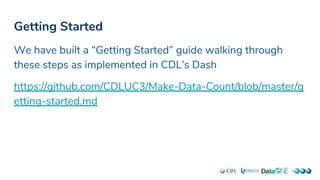


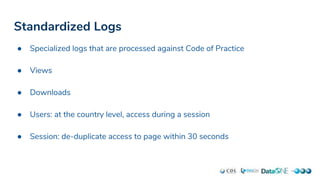
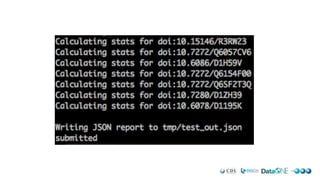
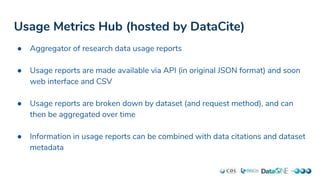
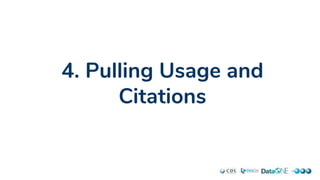


This document outlines the Make Data Count (MDC) initiative to standardize and promote the tracking of research data usage metrics. MDC has developed a Code of Practice for data usage logs, built an open hub to aggregate standardized usage data, and implemented tracking and display of usage metrics at their own repositories. They encourage other repositories to follow five simple steps to Make Their Data Count: 1) Read the Code of Practice, 2) Process usage logs, 3) Send logs to the hub, 4) Pull usage metrics from the hub, and 5) Display metrics. Future work includes outreach, iteration on implementations, and expanding metrics beyond DOIs.