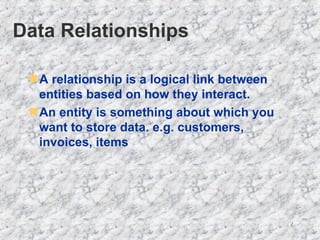
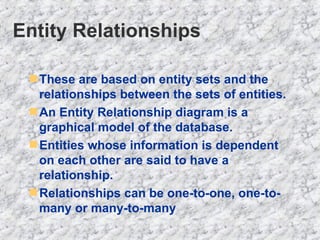
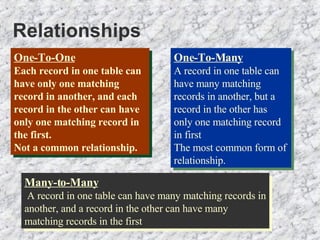
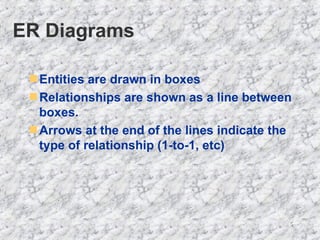
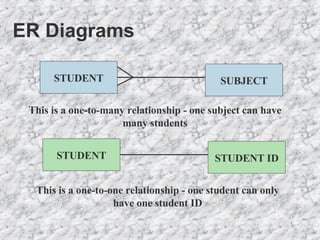
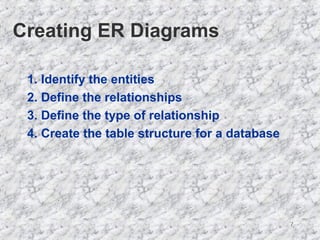
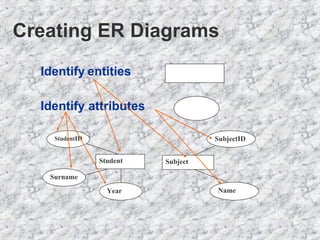
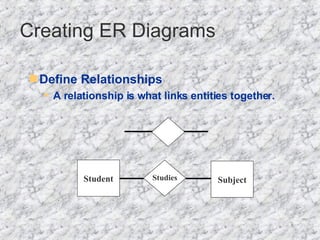
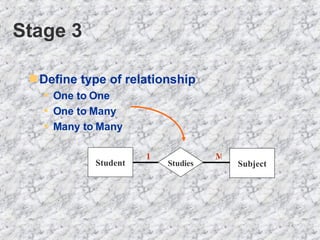
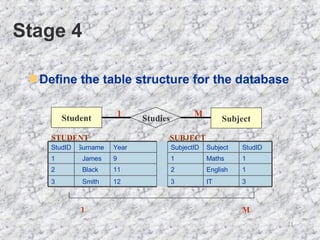
Introduction to Relational Databases 2
Data Relationships A relationship is a logical link between entities based on how they interact. An entity is something about which you want to store data. e.g. customers, invoices, items
Entity Relationships These are based on entity sets and the  relationships between the sets of entities. An Entity Relationship diagram is a graphical model of the database. Entities whose information is dependent on each other are said to have a relationship. Relationships can be one-to-one, one-to-many or many-to-many
Relationships One-To-One Each record in one table can have only one matching record in another, and each record in the other can have only one matching record in the first.  Not a common relationship. One-To-Many A record in one table can have many matching records in another, but a record in the other has only one matching record in first The most common form of relationship. Many-to-Many A record in one table can have many matching records in another, and a record in the other can have many matching records in the first
ER Diagrams Entities are drawn in boxes Relationships are shown as a line between boxes. Arrows at the end of the lines indicate the type of relationship (1-to-1, etc)
ER Diagrams This is a one-to-many relationship - one subject can have many students This is a one-to-one relationship - one student can only have one student ID STUDENT SUBJECT STUDENT STUDENT ID
Creating ER Diagrams 1. Identify the entities 2. Define the relationships 3. Define the type of relationship  4. Create the table structure for a database
Creating ER Diagrams Identify attributes Identify   entities Year Student ID Surname Student SubjectID Name Subject
Define Relationships   A relationship is what links entities together.  Creating ER Diagrams Student Studies Subject
Stage 3 Define type of relationship  One to One One to Many Many to Many   Student Studies Subject 1 M
Stage 4 Define the table structure for the database Student Studies Subject 1 M 1 M 3 IT   3 12   Smith   3 1 English 2 11 Black   2 1 Maths   1 9   James   1 StudID   Subject   SubjectID   Year   Surname   StudID   STUDENT SUBJECT
Normalisation A technique that is used to arrange data so that data redundancy is minimised. There are five ‘normal forms’ but only the first three are considered here.
Un-normalised Data Repeating groups and Null values A company manufactures and supplies a variety of products to retail suppliers .

Relational Databases 2

  • 1.
  • 2.
    Data Relationships Arelationship is a logical link between entities based on how they interact. An entity is something about which you want to store data. e.g. customers, invoices, items
  • 3.
    Entity Relationships Theseare based on entity sets and the relationships between the sets of entities. An Entity Relationship diagram is a graphical model of the database. Entities whose information is dependent on each other are said to have a relationship. Relationships can be one-to-one, one-to-many or many-to-many
  • 4.
    Relationships One-To-One Eachrecord in one table can have only one matching record in another, and each record in the other can have only one matching record in the first. Not a common relationship. One-To-Many A record in one table can have many matching records in another, but a record in the other has only one matching record in first The most common form of relationship. Many-to-Many A record in one table can have many matching records in another, and a record in the other can have many matching records in the first
  • 5.
    ER Diagrams Entitiesare drawn in boxes Relationships are shown as a line between boxes. Arrows at the end of the lines indicate the type of relationship (1-to-1, etc)
  • 6.
    ER Diagrams Thisis a one-to-many relationship - one subject can have many students This is a one-to-one relationship - one student can only have one student ID STUDENT SUBJECT STUDENT STUDENT ID
  • 7.
    Creating ER Diagrams1. Identify the entities 2. Define the relationships 3. Define the type of relationship 4. Create the table structure for a database
  • 8.
    Creating ER DiagramsIdentify attributes Identify entities Year Student ID Surname Student SubjectID Name Subject
  • 9.
    Define Relationships A relationship is what links entities together. Creating ER Diagrams Student Studies Subject
  • 10.
    Stage 3 Definetype of relationship One to One One to Many Many to Many Student Studies Subject 1 M
  • 11.
    Stage 4 Definethe table structure for the database Student Studies Subject 1 M 1 M 3 IT 3 12 Smith 3 1 English 2 11 Black 2 1 Maths 1 9 James 1 StudID Subject SubjectID Year Surname StudID STUDENT SUBJECT
  • 12.
    Normalisation A techniquethat is used to arrange data so that data redundancy is minimised. There are five ‘normal forms’ but only the first three are considered here.
  • 13.
    Un-normalised Data Repeatinggroups and Null values A company manufactures and supplies a variety of products to retail suppliers .