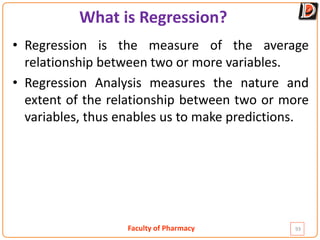
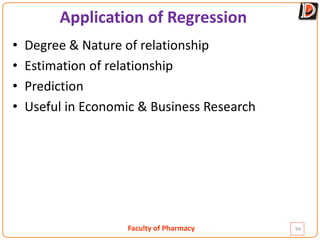
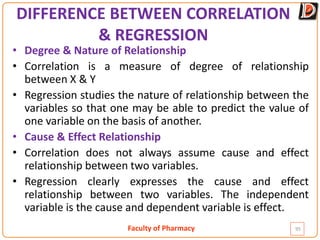
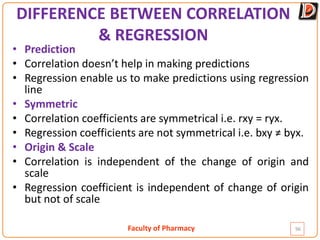
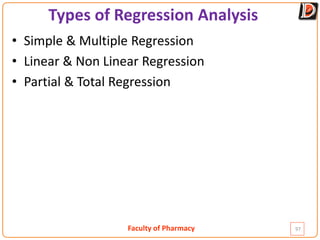
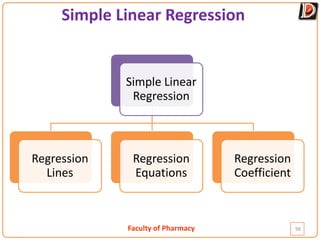
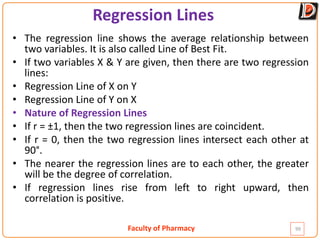
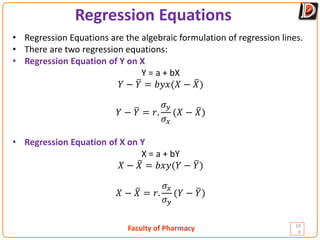
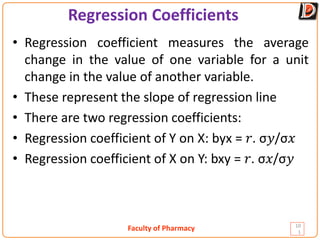
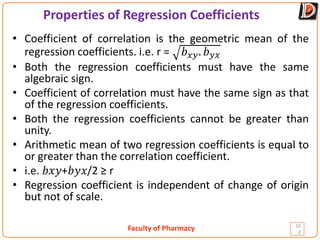
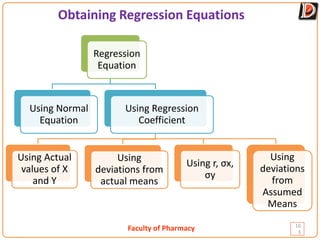
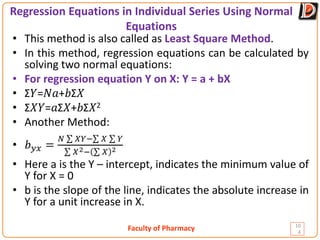
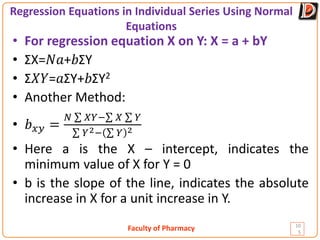
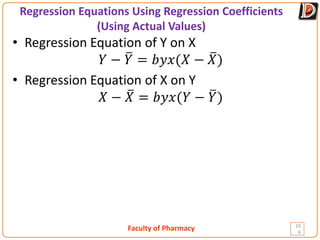
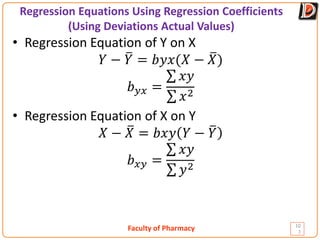
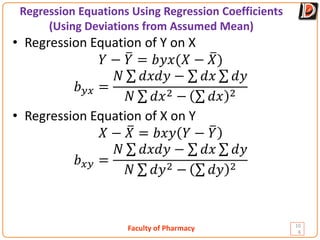
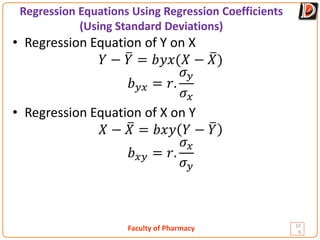
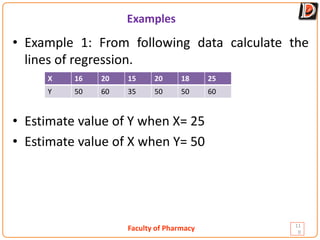
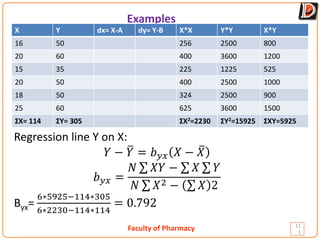
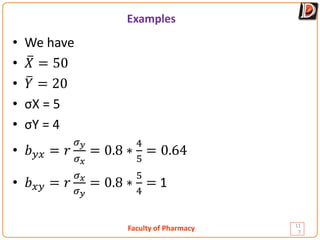
Faculty of Pharmacy
Regression
92
Faculty of Pharmacy
What is Regression?
• Regression is the measure of the average
relationship between two or more variables.
• Regression Analysis measures the nature and
extent of the relationship between two or more
variables, thus enables us to make predictions.
93
Faculty of Pharmacy
Application of Regression
• Degree & Nature of relationship
• Estimation of relationship
• Prediction
• Useful in Economic & Business Research
94
Faculty of Pharmacy
DIFFERENCE BETWEEN CORRELATION
& REGRESSION
• Degree & Nature of Relationship
• Correlation is a measure of degree of relationship
between X & Y
• Regression studies the nature of relationship between the
variables so that one may be able to predict the value of
one variable on the basis of another.
• Cause & Effect Relationship
• Correlation does not always assume cause and effect
relationship between two variables.
• Regression clearly expresses the cause and effect
relationship between two variables. The independent
variable is the cause and dependent variable is effect.
95
Faculty of Pharmacy
DIFFERENCE BETWEEN CORRELATION
& REGRESSION
• Prediction
• Correlation doesn’t help in making predictions
• Regression enable us to make predictions using regression
line
• Symmetric
• Correlation coefficients are symmetrical i.e. rxy = ryx.
• Regression coefficients are not symmetrical i.e. bxy ≠ byx.
• Origin & Scale
• Correlation is independent of the change of origin and
scale
• Regression coefficient is independent of change of origin
but not of scale
96
Faculty of Pharmacy
Types of Regression Analysis
• Simple & Multiple Regression
• Linear & Non Linear Regression
• Partial & Total Regression
97
Faculty of Pharmacy
Simple Linear Regression
Simple Linear
Regression
Regression
Lines
Regression
Equations
Regression
Coefficient
98
Faculty of Pharmacy
Regression Lines
99
• The regression line shows the average relationship between
two variables. It is also called Line of Best Fit.
• If two variables X & Y are given, then there are two regression
lines:
• Regression Line of X on Y
• Regression Line of Y on X
• Nature of Regression Lines
• If r = ±1, then the two regression lines are coincident.
• If r = 0, then the two regression lines intersect each other at
90°.
• The nearer the regression lines are to each other, the greater
will be the degree of correlation.
• If regression lines rise from left to right upward, then
correlation is positive.
Faculty of Pharmacy
Regression Equations
10
0
• Regression Equations are the algebraic formulation of regression lines.
• There are two regression equations:
• Regression Equation of Y on X
Y = a + bX
𝑌𝑌 − �
𝑌𝑌 = 𝑏𝑏𝑏𝑏𝑏𝑏(𝑋𝑋 − �
𝑋𝑋)
𝑌𝑌 − �
𝑌𝑌 = 𝑟𝑟.
𝜎𝜎𝑦𝑦
𝜎𝜎𝑥𝑥
(𝑋𝑋 − �
𝑋𝑋)
• Regression Equation of X on Y
X = a + bY
𝑋𝑋 − �
𝑋𝑋 = 𝑏𝑏𝑏𝑏𝑏𝑏(𝑌𝑌 − �
𝑌𝑌)
𝑋𝑋 − �
𝑋𝑋 = 𝑟𝑟.
𝜎𝜎𝑥𝑥
𝜎𝜎𝑦𝑦
(𝑌𝑌 − �
𝑌𝑌)
Faculty of Pharmacy
Regression Coefficients
10
1
• Regression coefficient measures the average
change in the value of one variable for a unit
change in the value of another variable.
• These represent the slope of regression line
• There are two regression coefficients:
• Regression coefficient of Y on X: byx = 𝑟𝑟. σ𝑦𝑦/σ𝑥𝑥
• Regression coefficient of X on Y: bxy = 𝑟𝑟. σ𝑥𝑥/σ𝑦𝑦
Faculty of Pharmacy
Properties of Regression Coefficients
10
2
• Coefficient of correlation is the geometric mean of the
regression coefficients. i.e. r = 𝑏𝑏𝑥𝑥𝑥𝑥. 𝑏𝑏𝑦𝑦𝑦𝑦
• Both the regression coefficients must have the same
algebraic sign.
• Coefficient of correlation must have the same sign as that
of the regression coefficients.
• Both the regression coefficients cannot be greater than
unity.
• Arithmetic mean of two regression coefficients is equal to
or greater than the correlation coefficient.
• i.e. 𝑏𝑏𝑥𝑥𝑦𝑦+𝑏𝑏𝑦𝑦𝑥𝑥/2 ≥ r
• Regression coefficient is independent of change of origin
but not of scale.
Faculty of Pharmacy
Obtaining Regression Equations
10
3
Regression
Equation
Using Normal
Equation
Using Regression
Coefficient
Using Actual
values of X
and Y
Using
deviations from
actual means
Using r, σx,
σy
Using
deviations
from
Assumed
Means
Faculty of Pharmacy
Regression Equations in Individual Series Using Normal
Equations
10
4
• This method is also called as Least Square Method.
• In this method, regression equations can be calculated by
solving two normal equations:
• For regression equation Y on X: Y = a + bX
• Σ𝑌𝑌=𝑁𝑁𝑎𝑎+𝑏𝑏Σ𝑋𝑋
• Σ𝑋𝑋𝑌𝑌=𝑎𝑎Σ𝑋𝑋+𝑏𝑏Σ𝑋𝑋2
• Another Method:
• 𝑏𝑏𝑦𝑦𝑦𝑦 =
𝑁𝑁 ∑ 𝑋𝑋𝑋𝑋−∑ 𝑋𝑋 ∑ 𝑌𝑌
∑ 𝑋𝑋2− ∑ 𝑋𝑋 2
• Here a is the Y – intercept, indicates the minimum value of
Y for X = 0
• b is the slope of the line, indicates the absolute increase in
Y for a unit increase in X.
Faculty of Pharmacy
Regression Equations in Individual Series Using Normal
Equations
10
5
• For regression equation X on Y: X = a + bY
• ΣX=𝑁𝑁𝑎𝑎+𝑏𝑏ΣY
• Σ𝑋𝑋𝑌𝑌=𝑎𝑎ΣY+𝑏𝑏ΣY2
• Another Method:
• 𝑏𝑏𝑥𝑥𝑥𝑥 =
𝑁𝑁 ∑ 𝑋𝑋𝑋𝑋−∑ 𝑋𝑋 ∑ 𝑌𝑌
∑ 𝑌𝑌2− ∑ 𝑌𝑌 2
• Here a is the X – intercept, indicates the
minimum value of X for Y = 0
• b is the slope of the line, indicates the absolute
increase in X for a unit increase in Y.
Faculty of Pharmacy
Regression Equations Using Regression Coefficients
(Using Actual Values)
10
6
• Regression Equation of Y on X
𝑌𝑌 − �
𝑌𝑌 = 𝑏𝑏𝑏𝑏𝑏𝑏(𝑋𝑋 − �
𝑋𝑋)
• Regression Equation of X on Y
𝑋𝑋 − �
𝑋𝑋 = 𝑏𝑏𝑏𝑏𝑏𝑏(𝑌𝑌 − �
𝑌𝑌)
Faculty of Pharmacy
Regression Equations Using Regression Coefficients
(Using Deviations Actual Values)
10
7
• Regression Equation of Y on X
𝑌𝑌 − �
𝑌𝑌 = 𝑏𝑏𝑏𝑏𝑏𝑏(𝑋𝑋 − �
𝑋𝑋)
𝑏𝑏𝑦𝑦𝑦𝑦 =
∑ 𝑥𝑥𝑥𝑥
∑ 𝑥𝑥2
• Regression Equation of X on Y
𝑋𝑋 − �
𝑋𝑋 = 𝑏𝑏𝑏𝑏𝑏𝑏 𝑌𝑌 − �
𝑌𝑌
𝑏𝑏𝑥𝑥𝑥𝑥 =
∑ 𝑥𝑥𝑥𝑥
∑ 𝑦𝑦2
Faculty of Pharmacy
Regression Equations Using Regression Coefficients
(Using Deviations from Assumed Mean)
10
8
• Regression Equation of Y on X
𝑌𝑌 − �
𝑌𝑌 = 𝑏𝑏𝑏𝑏𝑏𝑏(𝑋𝑋 − �
𝑋𝑋)
𝑏𝑏𝑦𝑦𝑦𝑦 =
𝑁𝑁 ∑ 𝑑𝑑𝑑𝑑𝑑𝑑𝑑𝑑 − ∑ 𝑑𝑑𝑑𝑑 ∑ 𝑑𝑑𝑑𝑑
𝑁𝑁 ∑ 𝑑𝑑𝑑𝑑2 − ∑ 𝑑𝑑𝑑𝑑 2
• Regression Equation of X on Y
𝑋𝑋 − �
𝑋𝑋 = 𝑏𝑏𝑏𝑏𝑏𝑏 𝑌𝑌 − �
𝑌𝑌
𝑏𝑏𝑥𝑥𝑦𝑦 =
𝑁𝑁 ∑ 𝑑𝑑𝑑𝑑𝑑𝑑𝑑𝑑 − ∑ 𝑑𝑑𝑑𝑑 ∑ 𝑑𝑑𝑑𝑑
𝑁𝑁 ∑ 𝑑𝑑𝑦𝑦2 − ∑ 𝑑𝑑𝑦𝑦 2
Faculty of Pharmacy
Regression Equations Using Regression Coefficients
(Using Standard Deviations)
10
9
• Regression Equation of Y on X
𝑌𝑌 − �
𝑌𝑌 = 𝑏𝑏𝑏𝑏𝑏𝑏(𝑋𝑋 − �
𝑋𝑋)
𝑏𝑏𝑦𝑦𝑦𝑦 = 𝑟𝑟.
𝜎𝜎𝑦𝑦
𝜎𝜎𝑥𝑥
• Regression Equation of X on Y
𝑋𝑋 − �
𝑋𝑋 = 𝑏𝑏𝑏𝑏𝑏𝑏 𝑌𝑌 − �
𝑌𝑌
𝑏𝑏𝑥𝑥𝑦𝑦 = 𝑟𝑟.
𝜎𝜎𝑥𝑥
𝜎𝜎𝑦𝑦
Faculty of Pharmacy
Examples
11
0
• Example 1: From following data calculate the
lines of regression.
• Estimate value of Y when X= 25
• Estimate value of X when Y= 50
X 16 20 15 20 18 25
Y 50 60 35 50 50 60
Faculty of Pharmacy
Examples
11
1
X Y dx= X-A dy= Y-B X*X Y*Y X*Y
16 50 256 2500 800
20 60 400 3600 1200
15 35 225 1225 525
20 50 400 2500 1000
18 50 324 2500 900
25 60 625 3600 1500
ƩX= 114 ƩY= 305 ƩX2=2230 ƩY2=15925 ƩXY=5925
Regression line Y on X:
𝑌𝑌 − �
𝑌𝑌 = 𝑏𝑏𝑦𝑦𝑦𝑦 𝑋𝑋 − �
𝑋𝑋
𝑏𝑏𝑦𝑦𝑦𝑦 =
𝑁𝑁 ∑ 𝑋𝑋𝑋𝑋 − ∑ 𝑋𝑋 ∑ 𝑌𝑌
𝑁𝑁 ∑ 𝑋𝑋2 − ∑ 𝑋𝑋 2
Byx=
6∗5925−114∗305
6∗2230−114∗114
= 0.792
Faculty of Pharmacy
Examples
11
2
X Y dx= X-A dy= Y-B X*X Y*Y X*Y
16 50 256 2500 800
20 60 400 3600 1200
15 35 225 1225 525
20 50 400 2500 1000
18 50 324 2500 900
25 60 625 3600 1500
ƩX= 114 ƩY= 305 ƩX2=2230 ƩY2=15925 ƩXY=5925
Regression line Y on X:
𝑌𝑌 − �
𝑌𝑌 = 𝑏𝑏𝑦𝑦𝑦𝑦 𝑋𝑋 − �
𝑋𝑋
𝑌𝑌 − 50.8 = 0.792 𝑋𝑋 − 19
Y-50.8=0.792X - 15.048 -------------------------- (1)
Byx= 0.792
Y – 50.8= 0.792*25-15.048 Y= 55.55
Faculty of Pharmacy
Examples
11
3
X Y dx= X-A dy= Y-B X*X Y*Y X*Y
16 50 256 2500 800
20 60 400 3600 1200
15 35 225 1225 525
20 50 400 2500 1000
18 50 324 2500 900
25 60 625 3600 1500
ƩX= 114 ƩY= 305 ƩX2=2230 ƩY2=15925 ƩXY=5925
Regression line X on Y:
𝑋𝑋 − �
𝑋𝑋 = 𝑏𝑏𝑥𝑥𝑥𝑥 𝑌𝑌 − �
𝑌𝑌
𝑏𝑏𝑥𝑥𝑥𝑥 =
𝑁𝑁 ∑ 𝑋𝑋𝑋𝑋 − ∑ 𝑋𝑋 ∑ 𝑌𝑌
𝑁𝑁 ∑ 𝑦𝑦2 − ∑ 𝑦𝑦 2
Byx=
6∗5925−114∗305
6∗15925−305∗305
= 0.308
Faculty of Pharmacy
Examples
11
4
X Y dx= X-A dy= Y-
B
X*X=dx2 Y*Y=dy2 X*Y=dxdy
16 50 1 15 256 2500 800
20 60 5 25 400 3600 1200
15 35 0 0 225 1225 525
20 50 5 15 400 2500 1000
18 50 3 15 324 2500 900
25 60 10 25 625 3600 1500
ƩX= 114 ƩY= 305 Ʃdx= Ʃdy= ƩX2=2230= ƩY2=15925
=
ƩXY=5925=
Regression line X on Y:
𝑋𝑋 − �
𝑋𝑋 = 𝑏𝑏𝑥𝑥𝑦𝑦 𝑌𝑌 − �
𝑌𝑌
X-19 = 0.308 (Y-50.8)
X-19 =0.308Y – 15.64 -------------------------- (2)
Bxy= 0.308
X-19 = 0.308*50-15.64 X= 18.76
Faculty of Pharmacy
Examples
11
5
• Example 2: from following data calculate the
lines of regression.
• Correlation coefficient value is 0.8= r
• Estimate value of Y when X= 60
• Estimate value of X when Y= 80
Mean S.D
X 50 5
Y 20 4
Faculty of Pharmacy
Examples
11
6
• We have
• �
𝑋𝑋 = 50
• �
𝑌𝑌 = 20
• σX = 5
• σY = 4
• 𝑏𝑏𝑦𝑦𝑦𝑦 = 𝑟𝑟
𝜎𝜎𝑦𝑦
𝜎𝜎𝑥𝑥
= 0.8 ∗
4
5
= 0.64
• 𝑏𝑏𝑥𝑥𝑥𝑥 = 𝑟𝑟
𝜎𝜎𝑥𝑥
𝜎𝜎𝑦𝑦
= 0.8 ∗
5
4
= 1
Faculty of Pharmacy
Examples
11
7
• We have
• �
𝑋𝑋 = 50
• �
𝑌𝑌 = 20
• σX = 5
• σY = 4
• 𝑏𝑏𝑦𝑦𝑦𝑦 = 𝑟𝑟
𝜎𝜎𝑦𝑦
𝜎𝜎𝑥𝑥
= 0.8 ∗
4
5
= 0.64
• 𝑏𝑏𝑥𝑥𝑥𝑥 = 𝑟𝑟
𝜎𝜎𝑥𝑥
𝜎𝜎𝑦𝑦
= 0.8 ∗
5
4
= 1

Regression.pdf

  • 1.
  • 2.
    Faculty of Pharmacy Whatis Regression? • Regression is the measure of the average relationship between two or more variables. • Regression Analysis measures the nature and extent of the relationship between two or more variables, thus enables us to make predictions. 93
  • 3.
    Faculty of Pharmacy Applicationof Regression • Degree & Nature of relationship • Estimation of relationship • Prediction • Useful in Economic & Business Research 94
  • 4.
    Faculty of Pharmacy DIFFERENCEBETWEEN CORRELATION & REGRESSION • Degree & Nature of Relationship • Correlation is a measure of degree of relationship between X & Y • Regression studies the nature of relationship between the variables so that one may be able to predict the value of one variable on the basis of another. • Cause & Effect Relationship • Correlation does not always assume cause and effect relationship between two variables. • Regression clearly expresses the cause and effect relationship between two variables. The independent variable is the cause and dependent variable is effect. 95
  • 5.
    Faculty of Pharmacy DIFFERENCEBETWEEN CORRELATION & REGRESSION • Prediction • Correlation doesn’t help in making predictions • Regression enable us to make predictions using regression line • Symmetric • Correlation coefficients are symmetrical i.e. rxy = ryx. • Regression coefficients are not symmetrical i.e. bxy ≠ byx. • Origin & Scale • Correlation is independent of the change of origin and scale • Regression coefficient is independent of change of origin but not of scale 96
  • 6.
    Faculty of Pharmacy Typesof Regression Analysis • Simple & Multiple Regression • Linear & Non Linear Regression • Partial & Total Regression 97
  • 7.
    Faculty of Pharmacy SimpleLinear Regression Simple Linear Regression Regression Lines Regression Equations Regression Coefficient 98
  • 8.
    Faculty of Pharmacy RegressionLines 99 • The regression line shows the average relationship between two variables. It is also called Line of Best Fit. • If two variables X & Y are given, then there are two regression lines: • Regression Line of X on Y • Regression Line of Y on X • Nature of Regression Lines • If r = ±1, then the two regression lines are coincident. • If r = 0, then the two regression lines intersect each other at 90°. • The nearer the regression lines are to each other, the greater will be the degree of correlation. • If regression lines rise from left to right upward, then correlation is positive.
  • 9.
    Faculty of Pharmacy RegressionEquations 10 0 • Regression Equations are the algebraic formulation of regression lines. • There are two regression equations: • Regression Equation of Y on X Y = a + bX 𝑌𝑌 − � 𝑌𝑌 = 𝑏𝑏𝑏𝑏𝑏𝑏(𝑋𝑋 − � 𝑋𝑋) 𝑌𝑌 − � 𝑌𝑌 = 𝑟𝑟. 𝜎𝜎𝑦𝑦 𝜎𝜎𝑥𝑥 (𝑋𝑋 − � 𝑋𝑋) • Regression Equation of X on Y X = a + bY 𝑋𝑋 − � 𝑋𝑋 = 𝑏𝑏𝑏𝑏𝑏𝑏(𝑌𝑌 − � 𝑌𝑌) 𝑋𝑋 − � 𝑋𝑋 = 𝑟𝑟. 𝜎𝜎𝑥𝑥 𝜎𝜎𝑦𝑦 (𝑌𝑌 − � 𝑌𝑌)
  • 10.
    Faculty of Pharmacy RegressionCoefficients 10 1 • Regression coefficient measures the average change in the value of one variable for a unit change in the value of another variable. • These represent the slope of regression line • There are two regression coefficients: • Regression coefficient of Y on X: byx = 𝑟𝑟. σ𝑦𝑦/σ𝑥𝑥 • Regression coefficient of X on Y: bxy = 𝑟𝑟. σ𝑥𝑥/σ𝑦𝑦
  • 11.
    Faculty of Pharmacy Propertiesof Regression Coefficients 10 2 • Coefficient of correlation is the geometric mean of the regression coefficients. i.e. r = 𝑏𝑏𝑥𝑥𝑥𝑥. 𝑏𝑏𝑦𝑦𝑦𝑦 • Both the regression coefficients must have the same algebraic sign. • Coefficient of correlation must have the same sign as that of the regression coefficients. • Both the regression coefficients cannot be greater than unity. • Arithmetic mean of two regression coefficients is equal to or greater than the correlation coefficient. • i.e. 𝑏𝑏𝑥𝑥𝑦𝑦+𝑏𝑏𝑦𝑦𝑥𝑥/2 ≥ r • Regression coefficient is independent of change of origin but not of scale.
  • 12.
    Faculty of Pharmacy ObtainingRegression Equations 10 3 Regression Equation Using Normal Equation Using Regression Coefficient Using Actual values of X and Y Using deviations from actual means Using r, σx, σy Using deviations from Assumed Means
  • 13.
    Faculty of Pharmacy RegressionEquations in Individual Series Using Normal Equations 10 4 • This method is also called as Least Square Method. • In this method, regression equations can be calculated by solving two normal equations: • For regression equation Y on X: Y = a + bX • Σ𝑌𝑌=𝑁𝑁𝑎𝑎+𝑏𝑏Σ𝑋𝑋 • Σ𝑋𝑋𝑌𝑌=𝑎𝑎Σ𝑋𝑋+𝑏𝑏Σ𝑋𝑋2 • Another Method: • 𝑏𝑏𝑦𝑦𝑦𝑦 = 𝑁𝑁 ∑ 𝑋𝑋𝑋𝑋−∑ 𝑋𝑋 ∑ 𝑌𝑌 ∑ 𝑋𝑋2− ∑ 𝑋𝑋 2 • Here a is the Y – intercept, indicates the minimum value of Y for X = 0 • b is the slope of the line, indicates the absolute increase in Y for a unit increase in X.
  • 14.
    Faculty of Pharmacy RegressionEquations in Individual Series Using Normal Equations 10 5 • For regression equation X on Y: X = a + bY • ΣX=𝑁𝑁𝑎𝑎+𝑏𝑏ΣY • Σ𝑋𝑋𝑌𝑌=𝑎𝑎ΣY+𝑏𝑏ΣY2 • Another Method: • 𝑏𝑏𝑥𝑥𝑥𝑥 = 𝑁𝑁 ∑ 𝑋𝑋𝑋𝑋−∑ 𝑋𝑋 ∑ 𝑌𝑌 ∑ 𝑌𝑌2− ∑ 𝑌𝑌 2 • Here a is the X – intercept, indicates the minimum value of X for Y = 0 • b is the slope of the line, indicates the absolute increase in X for a unit increase in Y.
  • 15.
    Faculty of Pharmacy RegressionEquations Using Regression Coefficients (Using Actual Values) 10 6 • Regression Equation of Y on X 𝑌𝑌 − � 𝑌𝑌 = 𝑏𝑏𝑏𝑏𝑏𝑏(𝑋𝑋 − � 𝑋𝑋) • Regression Equation of X on Y 𝑋𝑋 − � 𝑋𝑋 = 𝑏𝑏𝑏𝑏𝑏𝑏(𝑌𝑌 − � 𝑌𝑌)
  • 16.
    Faculty of Pharmacy RegressionEquations Using Regression Coefficients (Using Deviations Actual Values) 10 7 • Regression Equation of Y on X 𝑌𝑌 − � 𝑌𝑌 = 𝑏𝑏𝑏𝑏𝑏𝑏(𝑋𝑋 − � 𝑋𝑋) 𝑏𝑏𝑦𝑦𝑦𝑦 = ∑ 𝑥𝑥𝑥𝑥 ∑ 𝑥𝑥2 • Regression Equation of X on Y 𝑋𝑋 − � 𝑋𝑋 = 𝑏𝑏𝑏𝑏𝑏𝑏 𝑌𝑌 − � 𝑌𝑌 𝑏𝑏𝑥𝑥𝑥𝑥 = ∑ 𝑥𝑥𝑥𝑥 ∑ 𝑦𝑦2
  • 17.
    Faculty of Pharmacy RegressionEquations Using Regression Coefficients (Using Deviations from Assumed Mean) 10 8 • Regression Equation of Y on X 𝑌𝑌 − � 𝑌𝑌 = 𝑏𝑏𝑏𝑏𝑏𝑏(𝑋𝑋 − � 𝑋𝑋) 𝑏𝑏𝑦𝑦𝑦𝑦 = 𝑁𝑁 ∑ 𝑑𝑑𝑑𝑑𝑑𝑑𝑑𝑑 − ∑ 𝑑𝑑𝑑𝑑 ∑ 𝑑𝑑𝑑𝑑 𝑁𝑁 ∑ 𝑑𝑑𝑑𝑑2 − ∑ 𝑑𝑑𝑑𝑑 2 • Regression Equation of X on Y 𝑋𝑋 − � 𝑋𝑋 = 𝑏𝑏𝑏𝑏𝑏𝑏 𝑌𝑌 − � 𝑌𝑌 𝑏𝑏𝑥𝑥𝑦𝑦 = 𝑁𝑁 ∑ 𝑑𝑑𝑑𝑑𝑑𝑑𝑑𝑑 − ∑ 𝑑𝑑𝑑𝑑 ∑ 𝑑𝑑𝑑𝑑 𝑁𝑁 ∑ 𝑑𝑑𝑦𝑦2 − ∑ 𝑑𝑑𝑦𝑦 2
  • 18.
    Faculty of Pharmacy RegressionEquations Using Regression Coefficients (Using Standard Deviations) 10 9 • Regression Equation of Y on X 𝑌𝑌 − � 𝑌𝑌 = 𝑏𝑏𝑏𝑏𝑏𝑏(𝑋𝑋 − � 𝑋𝑋) 𝑏𝑏𝑦𝑦𝑦𝑦 = 𝑟𝑟. 𝜎𝜎𝑦𝑦 𝜎𝜎𝑥𝑥 • Regression Equation of X on Y 𝑋𝑋 − � 𝑋𝑋 = 𝑏𝑏𝑏𝑏𝑏𝑏 𝑌𝑌 − � 𝑌𝑌 𝑏𝑏𝑥𝑥𝑦𝑦 = 𝑟𝑟. 𝜎𝜎𝑥𝑥 𝜎𝜎𝑦𝑦
  • 19.
    Faculty of Pharmacy Examples 11 0 •Example 1: From following data calculate the lines of regression. • Estimate value of Y when X= 25 • Estimate value of X when Y= 50 X 16 20 15 20 18 25 Y 50 60 35 50 50 60
  • 20.
    Faculty of Pharmacy Examples 11 1 XY dx= X-A dy= Y-B X*X Y*Y X*Y 16 50 256 2500 800 20 60 400 3600 1200 15 35 225 1225 525 20 50 400 2500 1000 18 50 324 2500 900 25 60 625 3600 1500 ƩX= 114 ƩY= 305 ƩX2=2230 ƩY2=15925 ƩXY=5925 Regression line Y on X: 𝑌𝑌 − � 𝑌𝑌 = 𝑏𝑏𝑦𝑦𝑦𝑦 𝑋𝑋 − � 𝑋𝑋 𝑏𝑏𝑦𝑦𝑦𝑦 = 𝑁𝑁 ∑ 𝑋𝑋𝑋𝑋 − ∑ 𝑋𝑋 ∑ 𝑌𝑌 𝑁𝑁 ∑ 𝑋𝑋2 − ∑ 𝑋𝑋 2 Byx= 6∗5925−114∗305 6∗2230−114∗114 = 0.792
  • 21.
    Faculty of Pharmacy Examples 11 2 XY dx= X-A dy= Y-B X*X Y*Y X*Y 16 50 256 2500 800 20 60 400 3600 1200 15 35 225 1225 525 20 50 400 2500 1000 18 50 324 2500 900 25 60 625 3600 1500 ƩX= 114 ƩY= 305 ƩX2=2230 ƩY2=15925 ƩXY=5925 Regression line Y on X: 𝑌𝑌 − � 𝑌𝑌 = 𝑏𝑏𝑦𝑦𝑦𝑦 𝑋𝑋 − � 𝑋𝑋 𝑌𝑌 − 50.8 = 0.792 𝑋𝑋 − 19 Y-50.8=0.792X - 15.048 -------------------------- (1) Byx= 0.792 Y – 50.8= 0.792*25-15.048 Y= 55.55
  • 22.
    Faculty of Pharmacy Examples 11 3 XY dx= X-A dy= Y-B X*X Y*Y X*Y 16 50 256 2500 800 20 60 400 3600 1200 15 35 225 1225 525 20 50 400 2500 1000 18 50 324 2500 900 25 60 625 3600 1500 ƩX= 114 ƩY= 305 ƩX2=2230 ƩY2=15925 ƩXY=5925 Regression line X on Y: 𝑋𝑋 − � 𝑋𝑋 = 𝑏𝑏𝑥𝑥𝑥𝑥 𝑌𝑌 − � 𝑌𝑌 𝑏𝑏𝑥𝑥𝑥𝑥 = 𝑁𝑁 ∑ 𝑋𝑋𝑋𝑋 − ∑ 𝑋𝑋 ∑ 𝑌𝑌 𝑁𝑁 ∑ 𝑦𝑦2 − ∑ 𝑦𝑦 2 Byx= 6∗5925−114∗305 6∗15925−305∗305 = 0.308
  • 23.
    Faculty of Pharmacy Examples 11 4 XY dx= X-A dy= Y- B X*X=dx2 Y*Y=dy2 X*Y=dxdy 16 50 1 15 256 2500 800 20 60 5 25 400 3600 1200 15 35 0 0 225 1225 525 20 50 5 15 400 2500 1000 18 50 3 15 324 2500 900 25 60 10 25 625 3600 1500 ƩX= 114 ƩY= 305 Ʃdx= Ʃdy= ƩX2=2230= ƩY2=15925 = ƩXY=5925= Regression line X on Y: 𝑋𝑋 − � 𝑋𝑋 = 𝑏𝑏𝑥𝑥𝑦𝑦 𝑌𝑌 − � 𝑌𝑌 X-19 = 0.308 (Y-50.8) X-19 =0.308Y – 15.64 -------------------------- (2) Bxy= 0.308 X-19 = 0.308*50-15.64 X= 18.76
  • 24.
    Faculty of Pharmacy Examples 11 5 •Example 2: from following data calculate the lines of regression. • Correlation coefficient value is 0.8= r • Estimate value of Y when X= 60 • Estimate value of X when Y= 80 Mean S.D X 50 5 Y 20 4
  • 25.
    Faculty of Pharmacy Examples 11 6 •We have • � 𝑋𝑋 = 50 • � 𝑌𝑌 = 20 • σX = 5 • σY = 4 • 𝑏𝑏𝑦𝑦𝑦𝑦 = 𝑟𝑟 𝜎𝜎𝑦𝑦 𝜎𝜎𝑥𝑥 = 0.8 ∗ 4 5 = 0.64 • 𝑏𝑏𝑥𝑥𝑥𝑥 = 𝑟𝑟 𝜎𝜎𝑥𝑥 𝜎𝜎𝑦𝑦 = 0.8 ∗ 5 4 = 1
  • 26.
    Faculty of Pharmacy Examples 11 7 •We have • � 𝑋𝑋 = 50 • � 𝑌𝑌 = 20 • σX = 5 • σY = 4 • 𝑏𝑏𝑦𝑦𝑦𝑦 = 𝑟𝑟 𝜎𝜎𝑦𝑦 𝜎𝜎𝑥𝑥 = 0.8 ∗ 4 5 = 0.64 • 𝑏𝑏𝑥𝑥𝑥𝑥 = 𝑟𝑟 𝜎𝜎𝑥𝑥 𝜎𝜎𝑦𝑦 = 0.8 ∗ 5 4 = 1