Download as PDF, PPTX


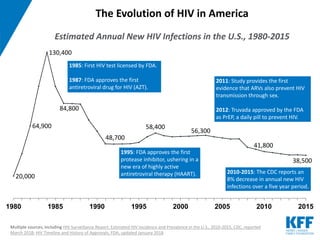
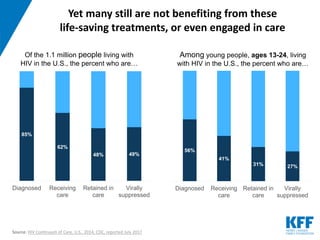
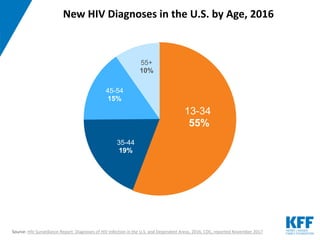


The document presents an overview of significant milestones in HIV/AIDS treatment and prevention, including FDA approvals of key medications from 1985 to 2012. It highlights the ongoing challenges faced by individuals living with HIV, particularly among the millennial generation aged 13-24, in terms of diagnosis, care retention, and viral suppression. Despite advancements, many are not fully benefiting from available treatments and resources.


