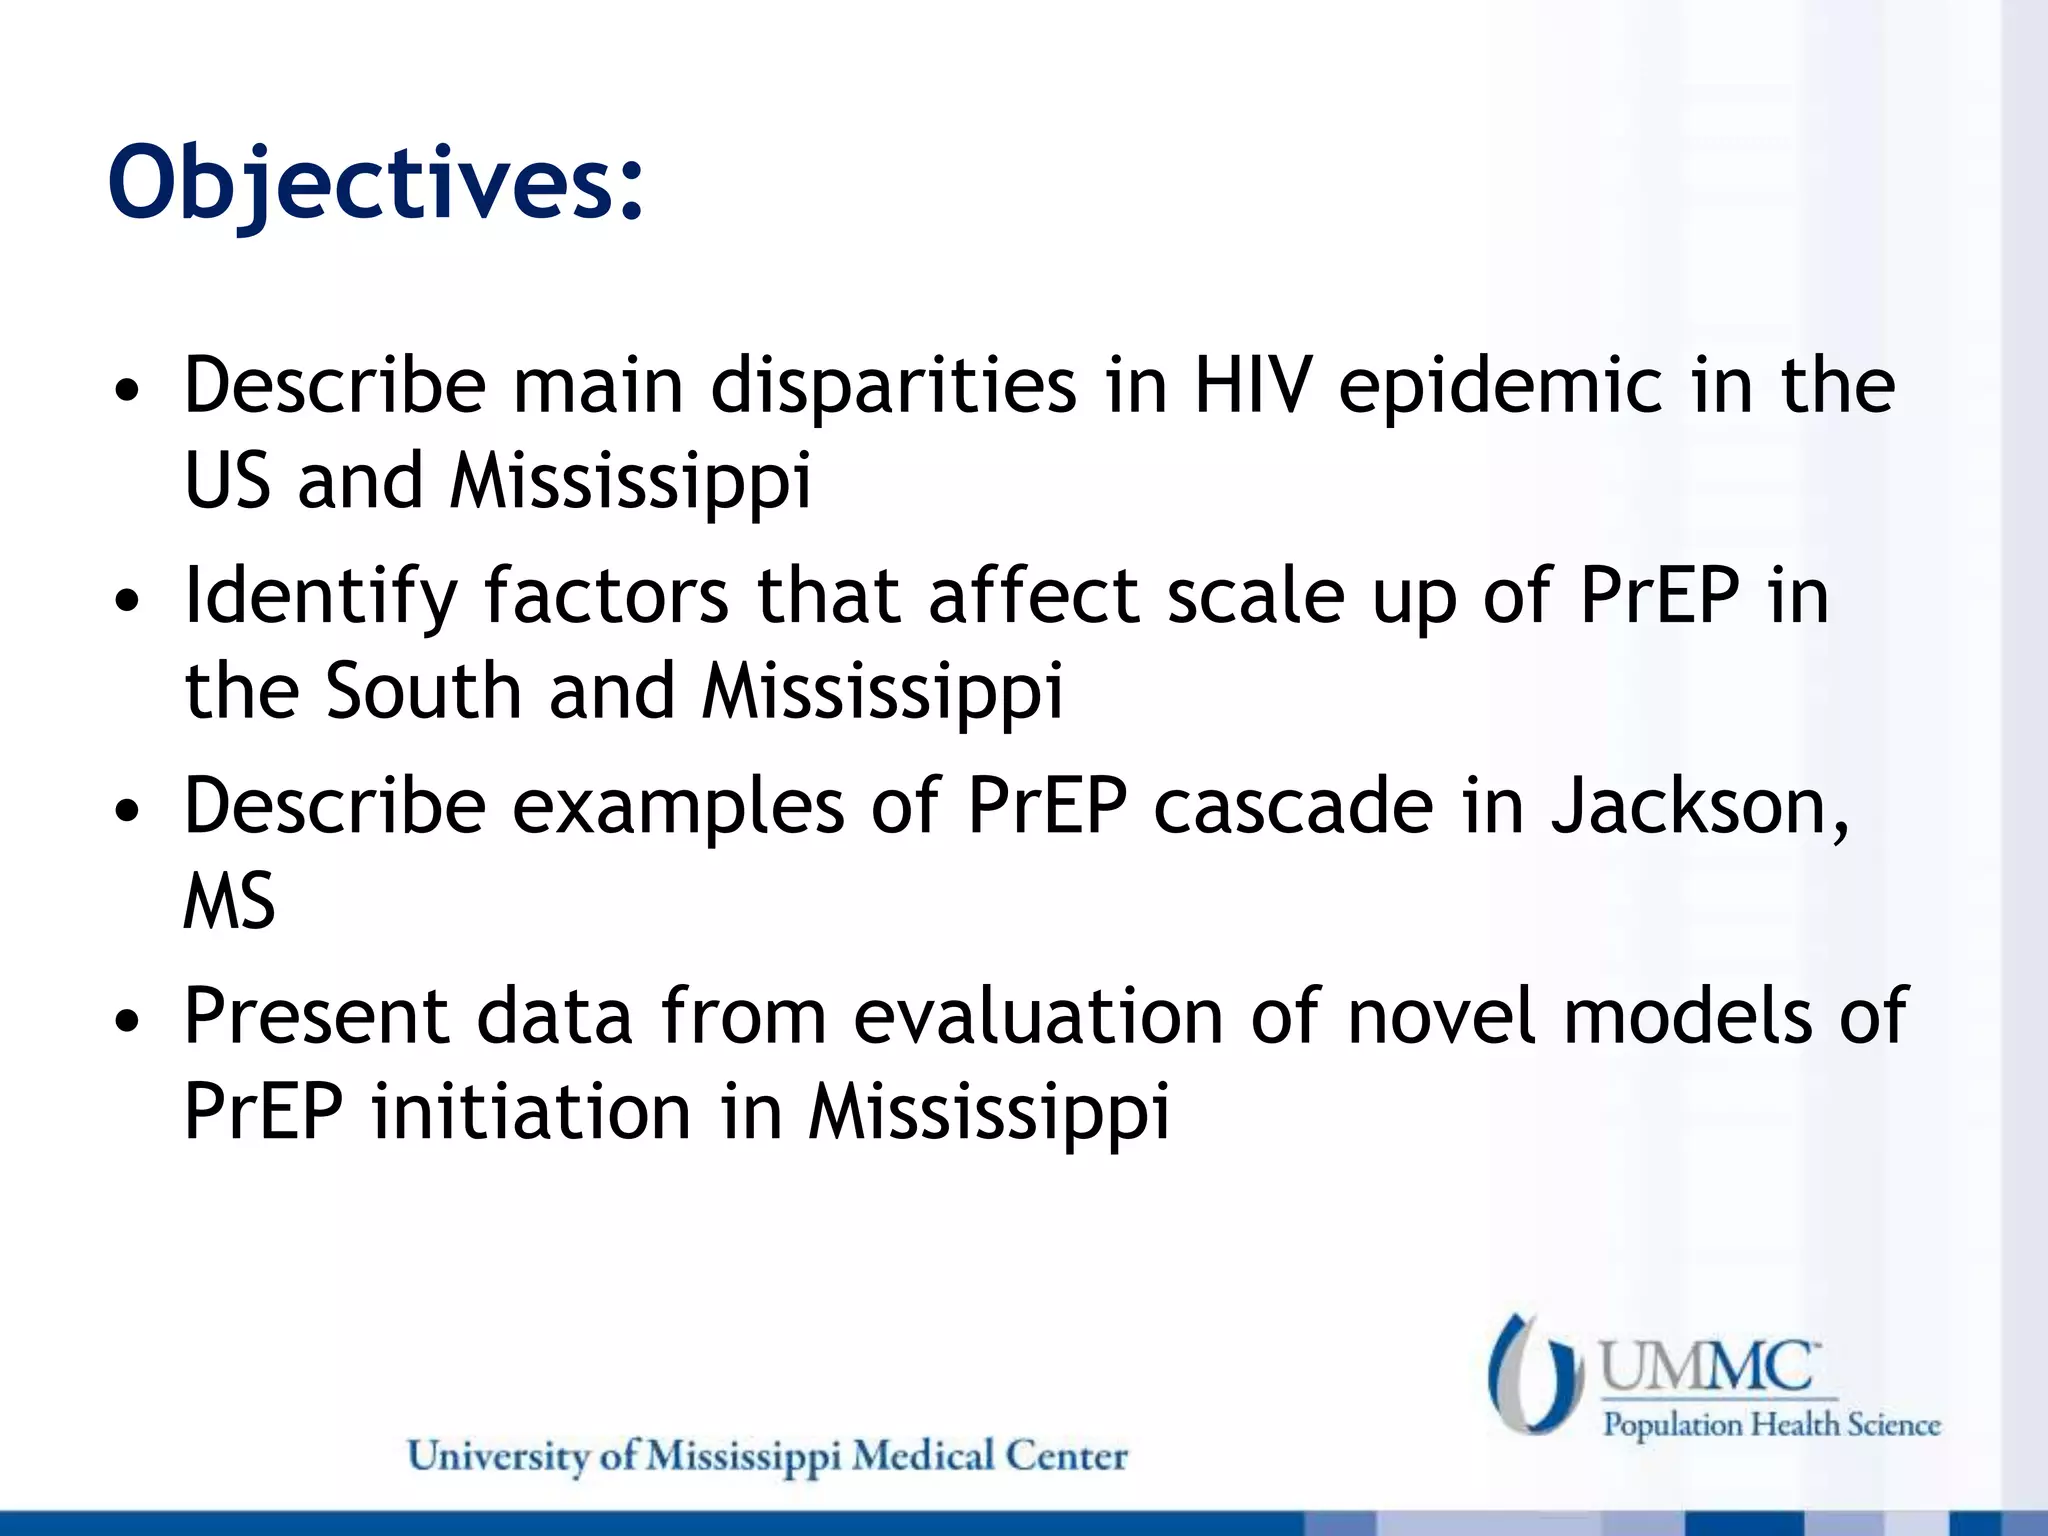
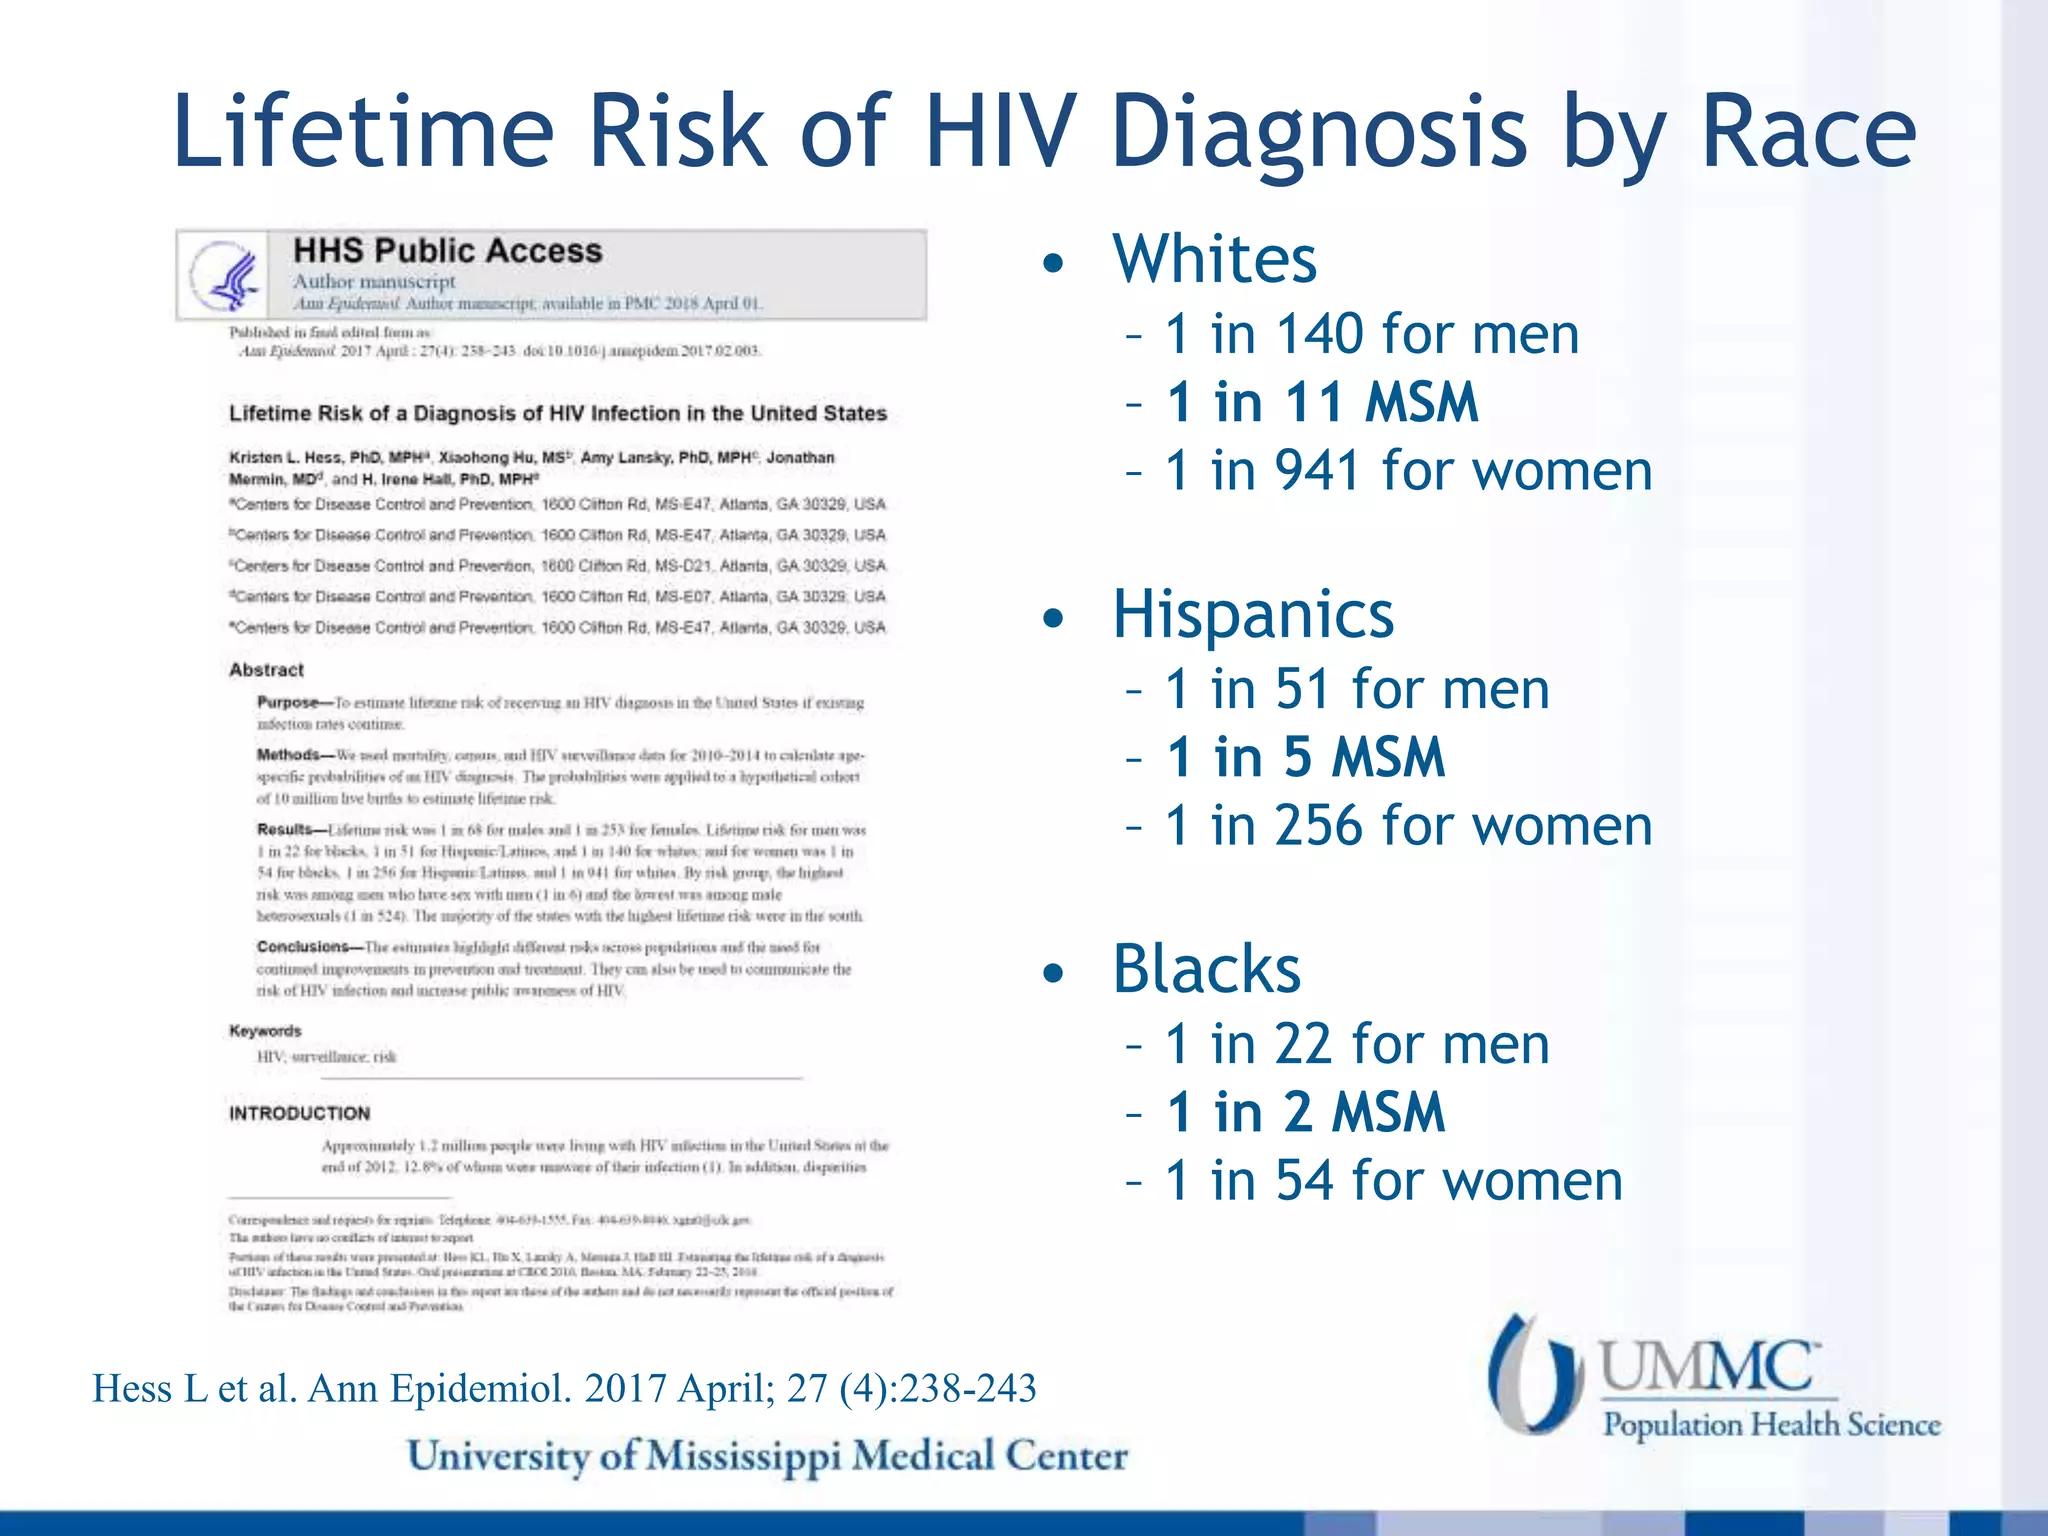
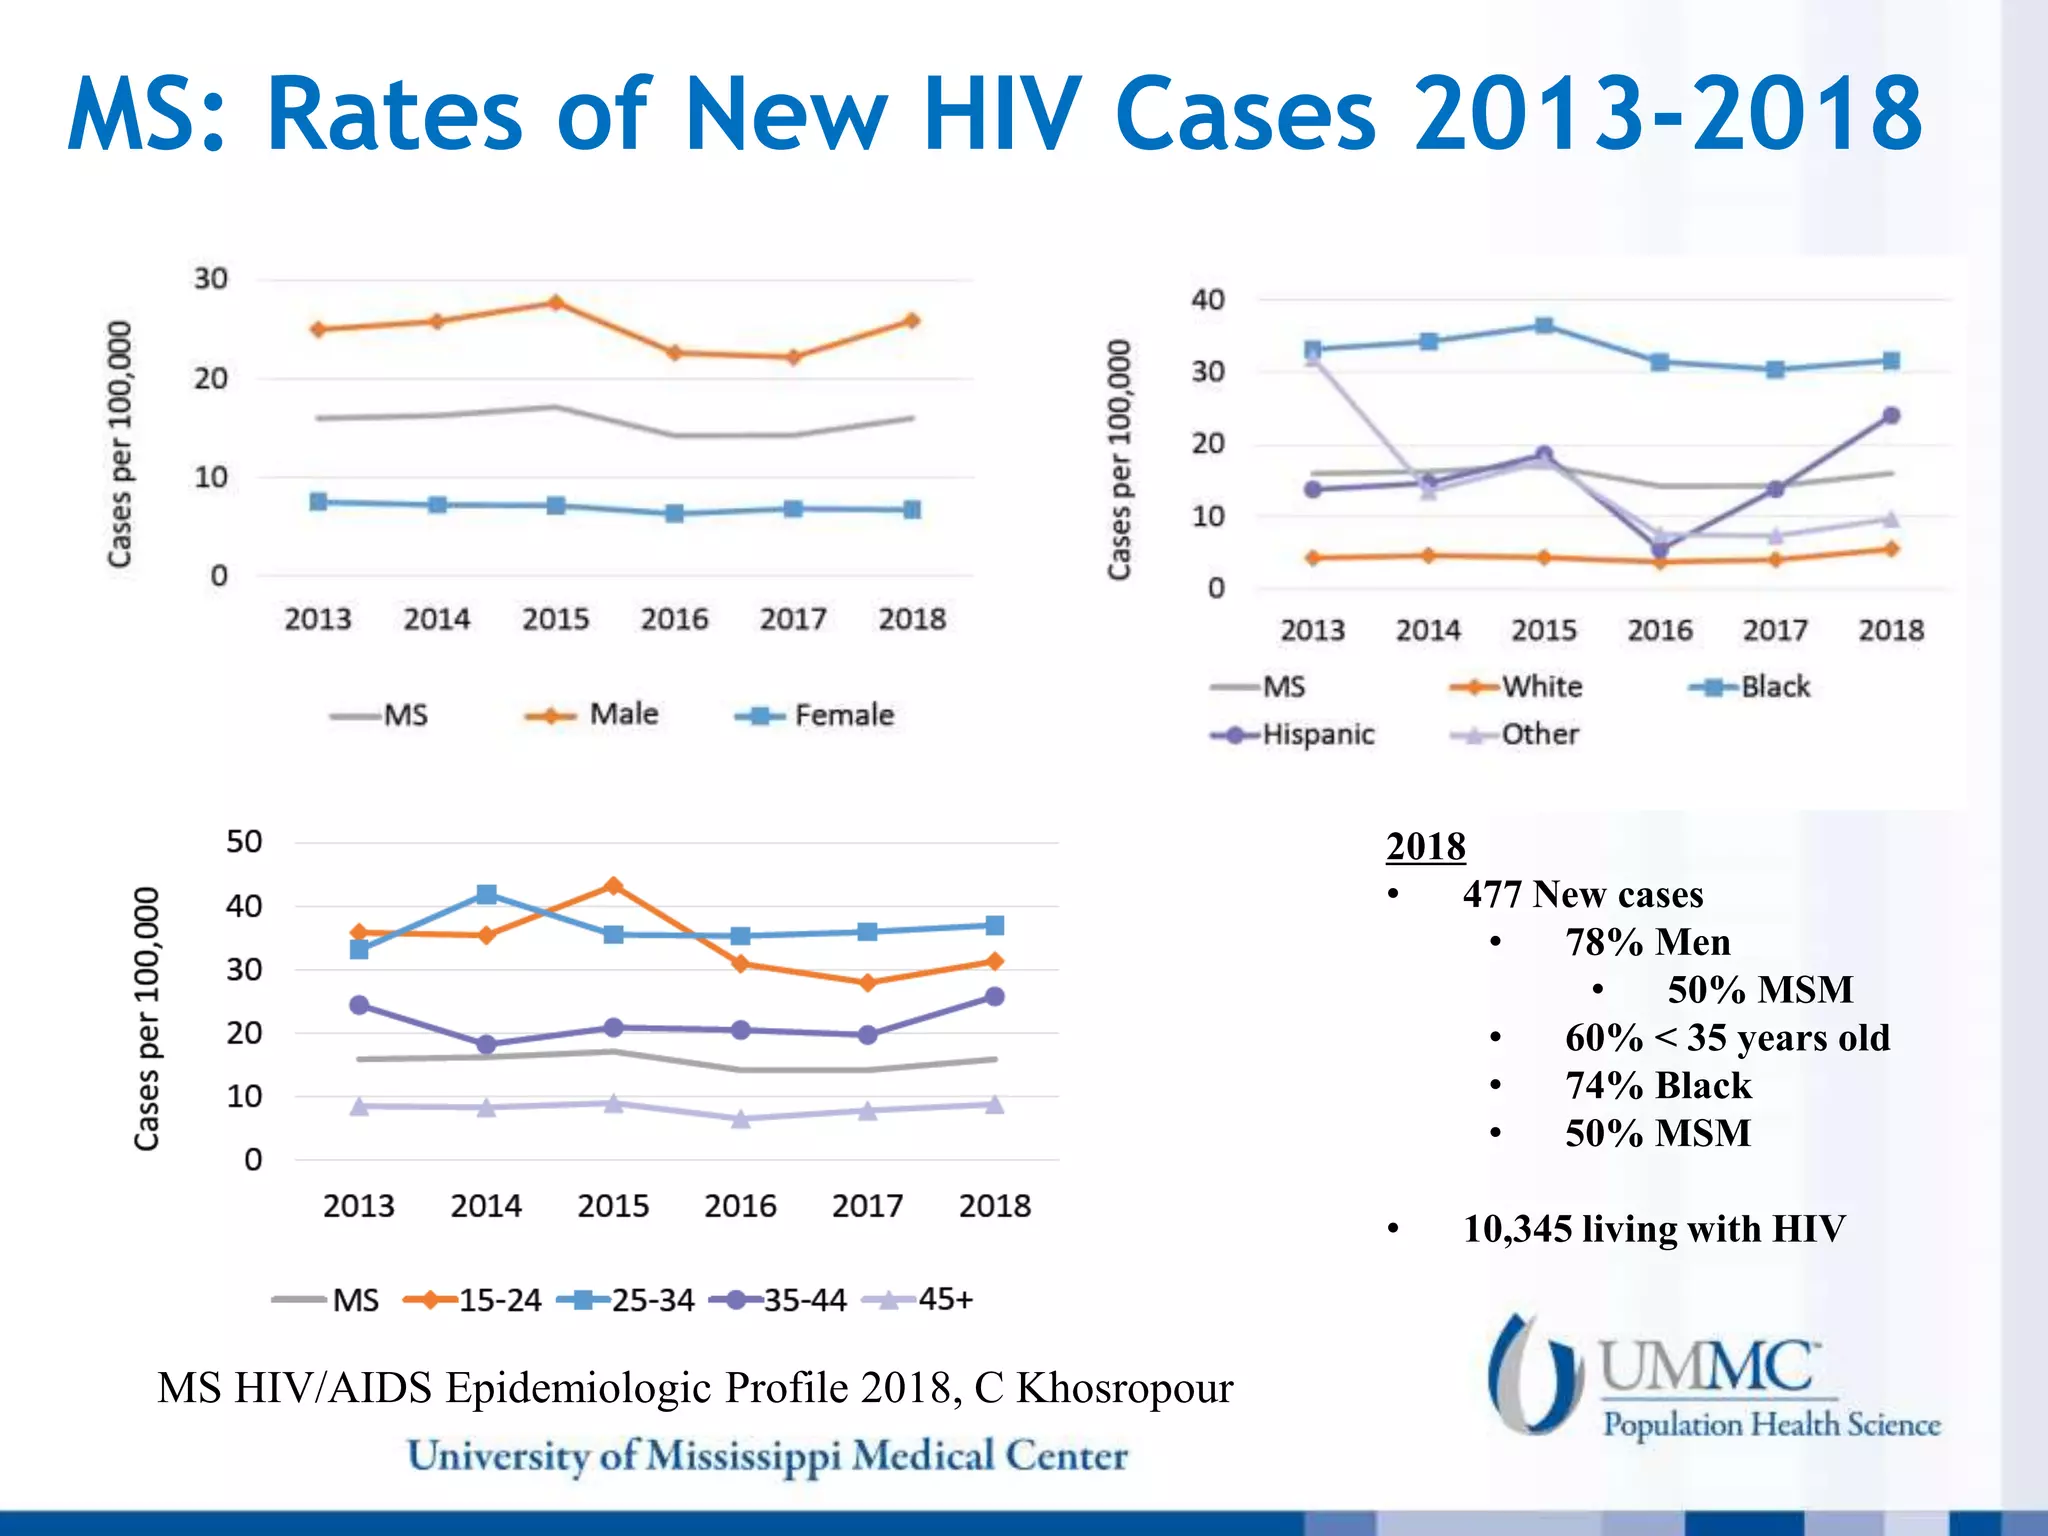
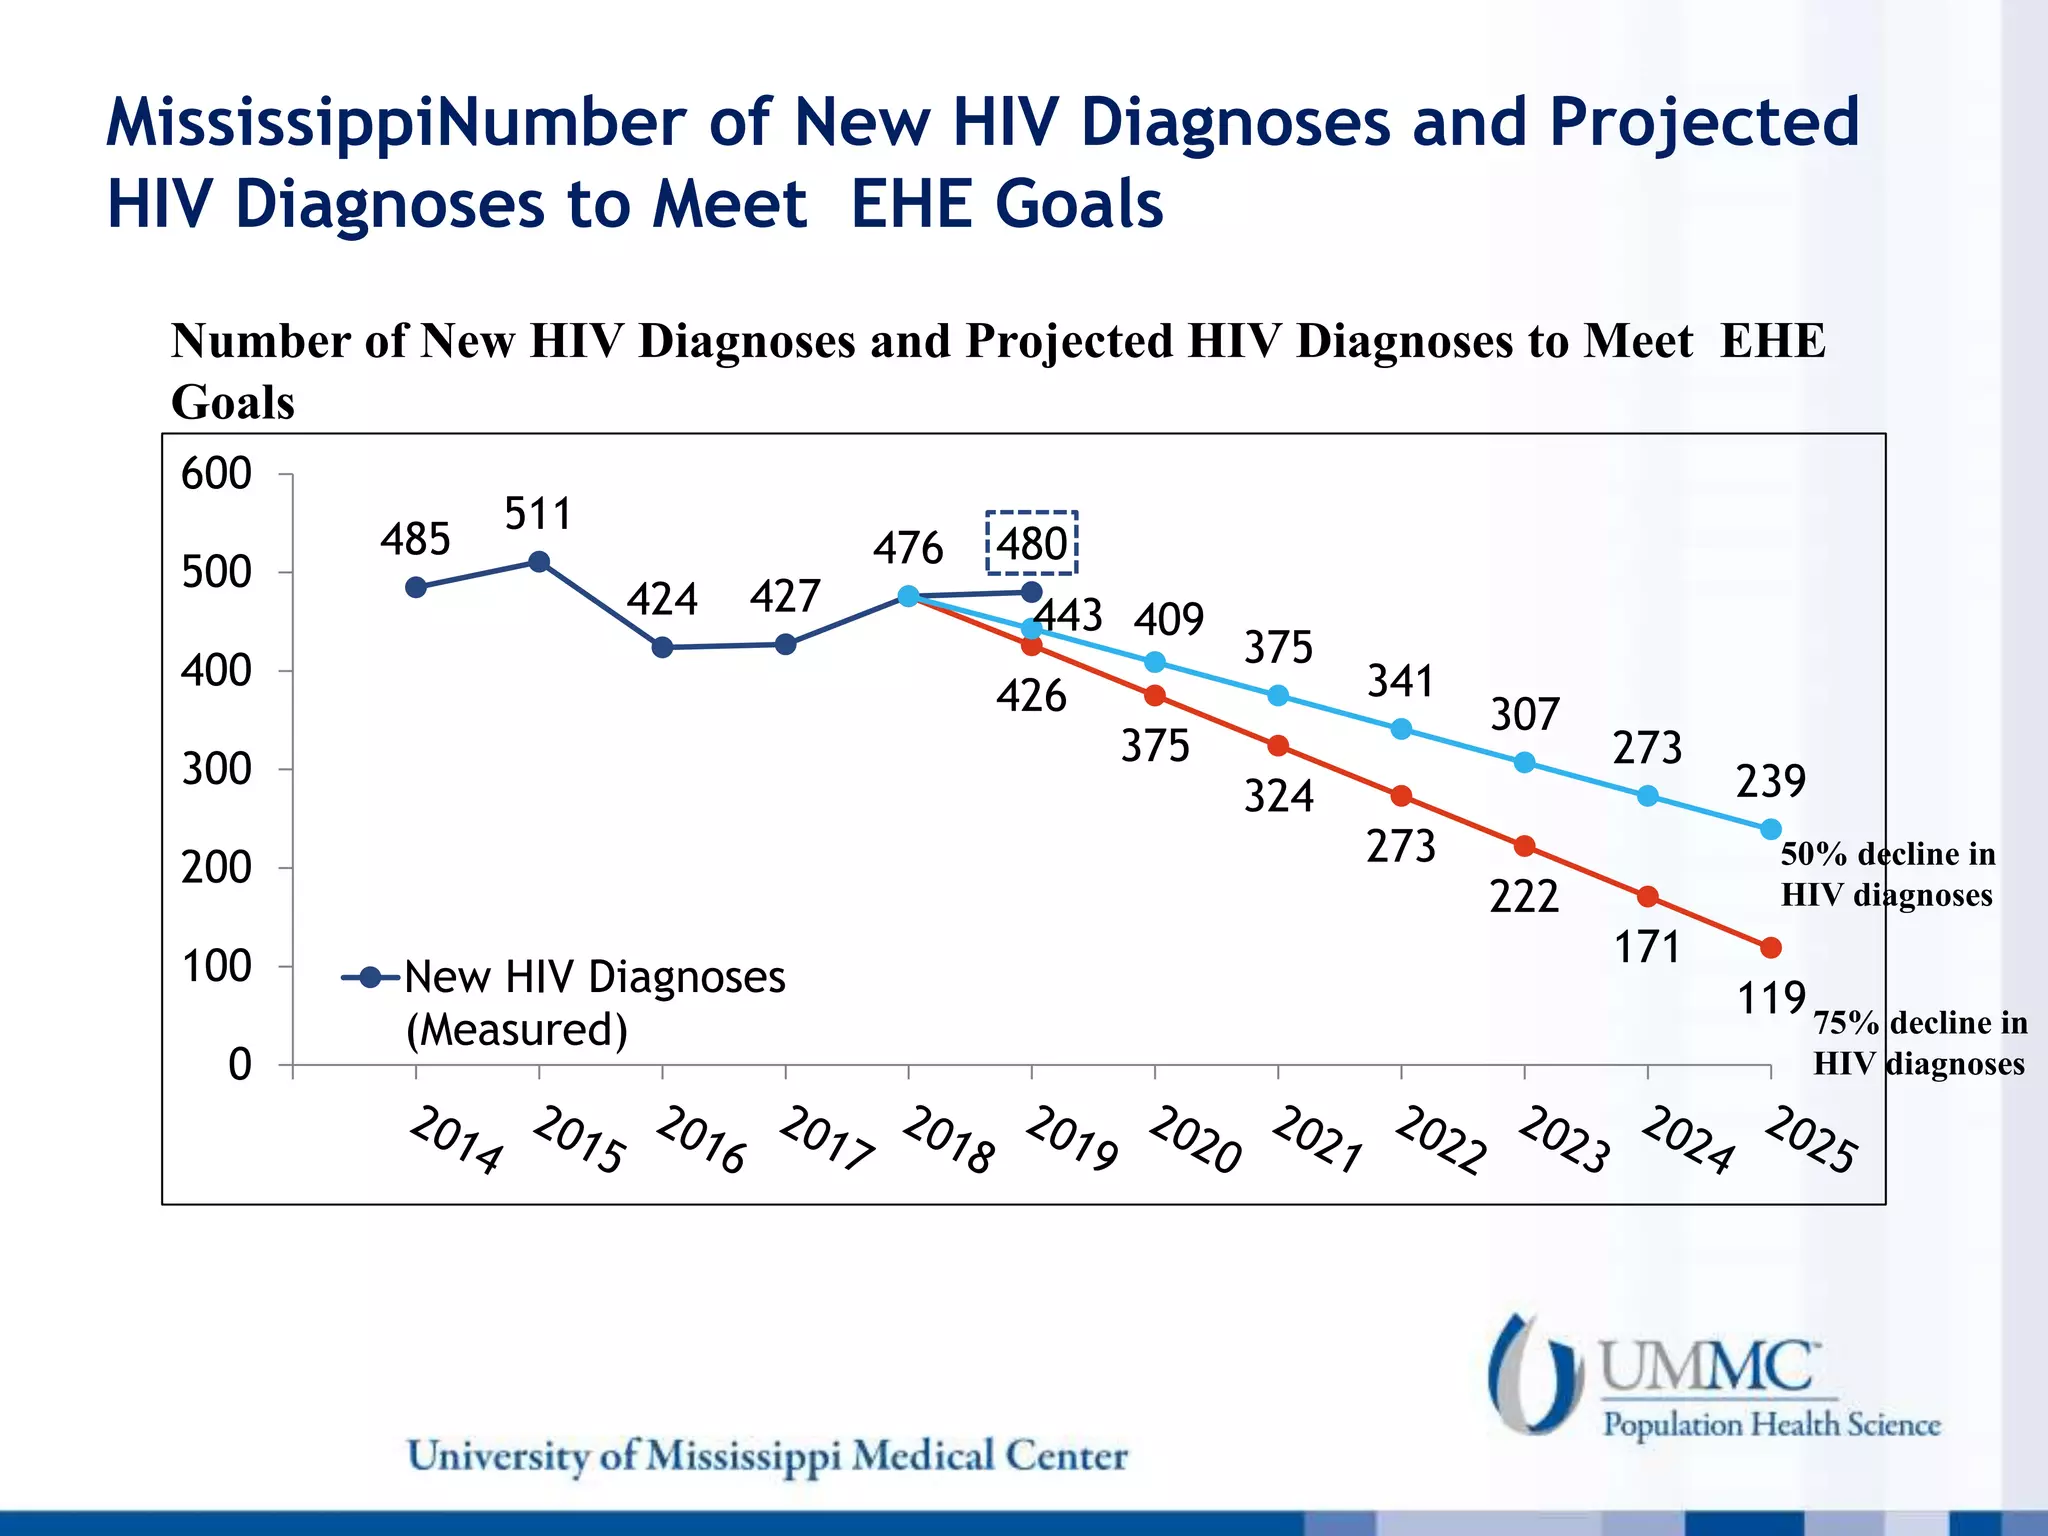
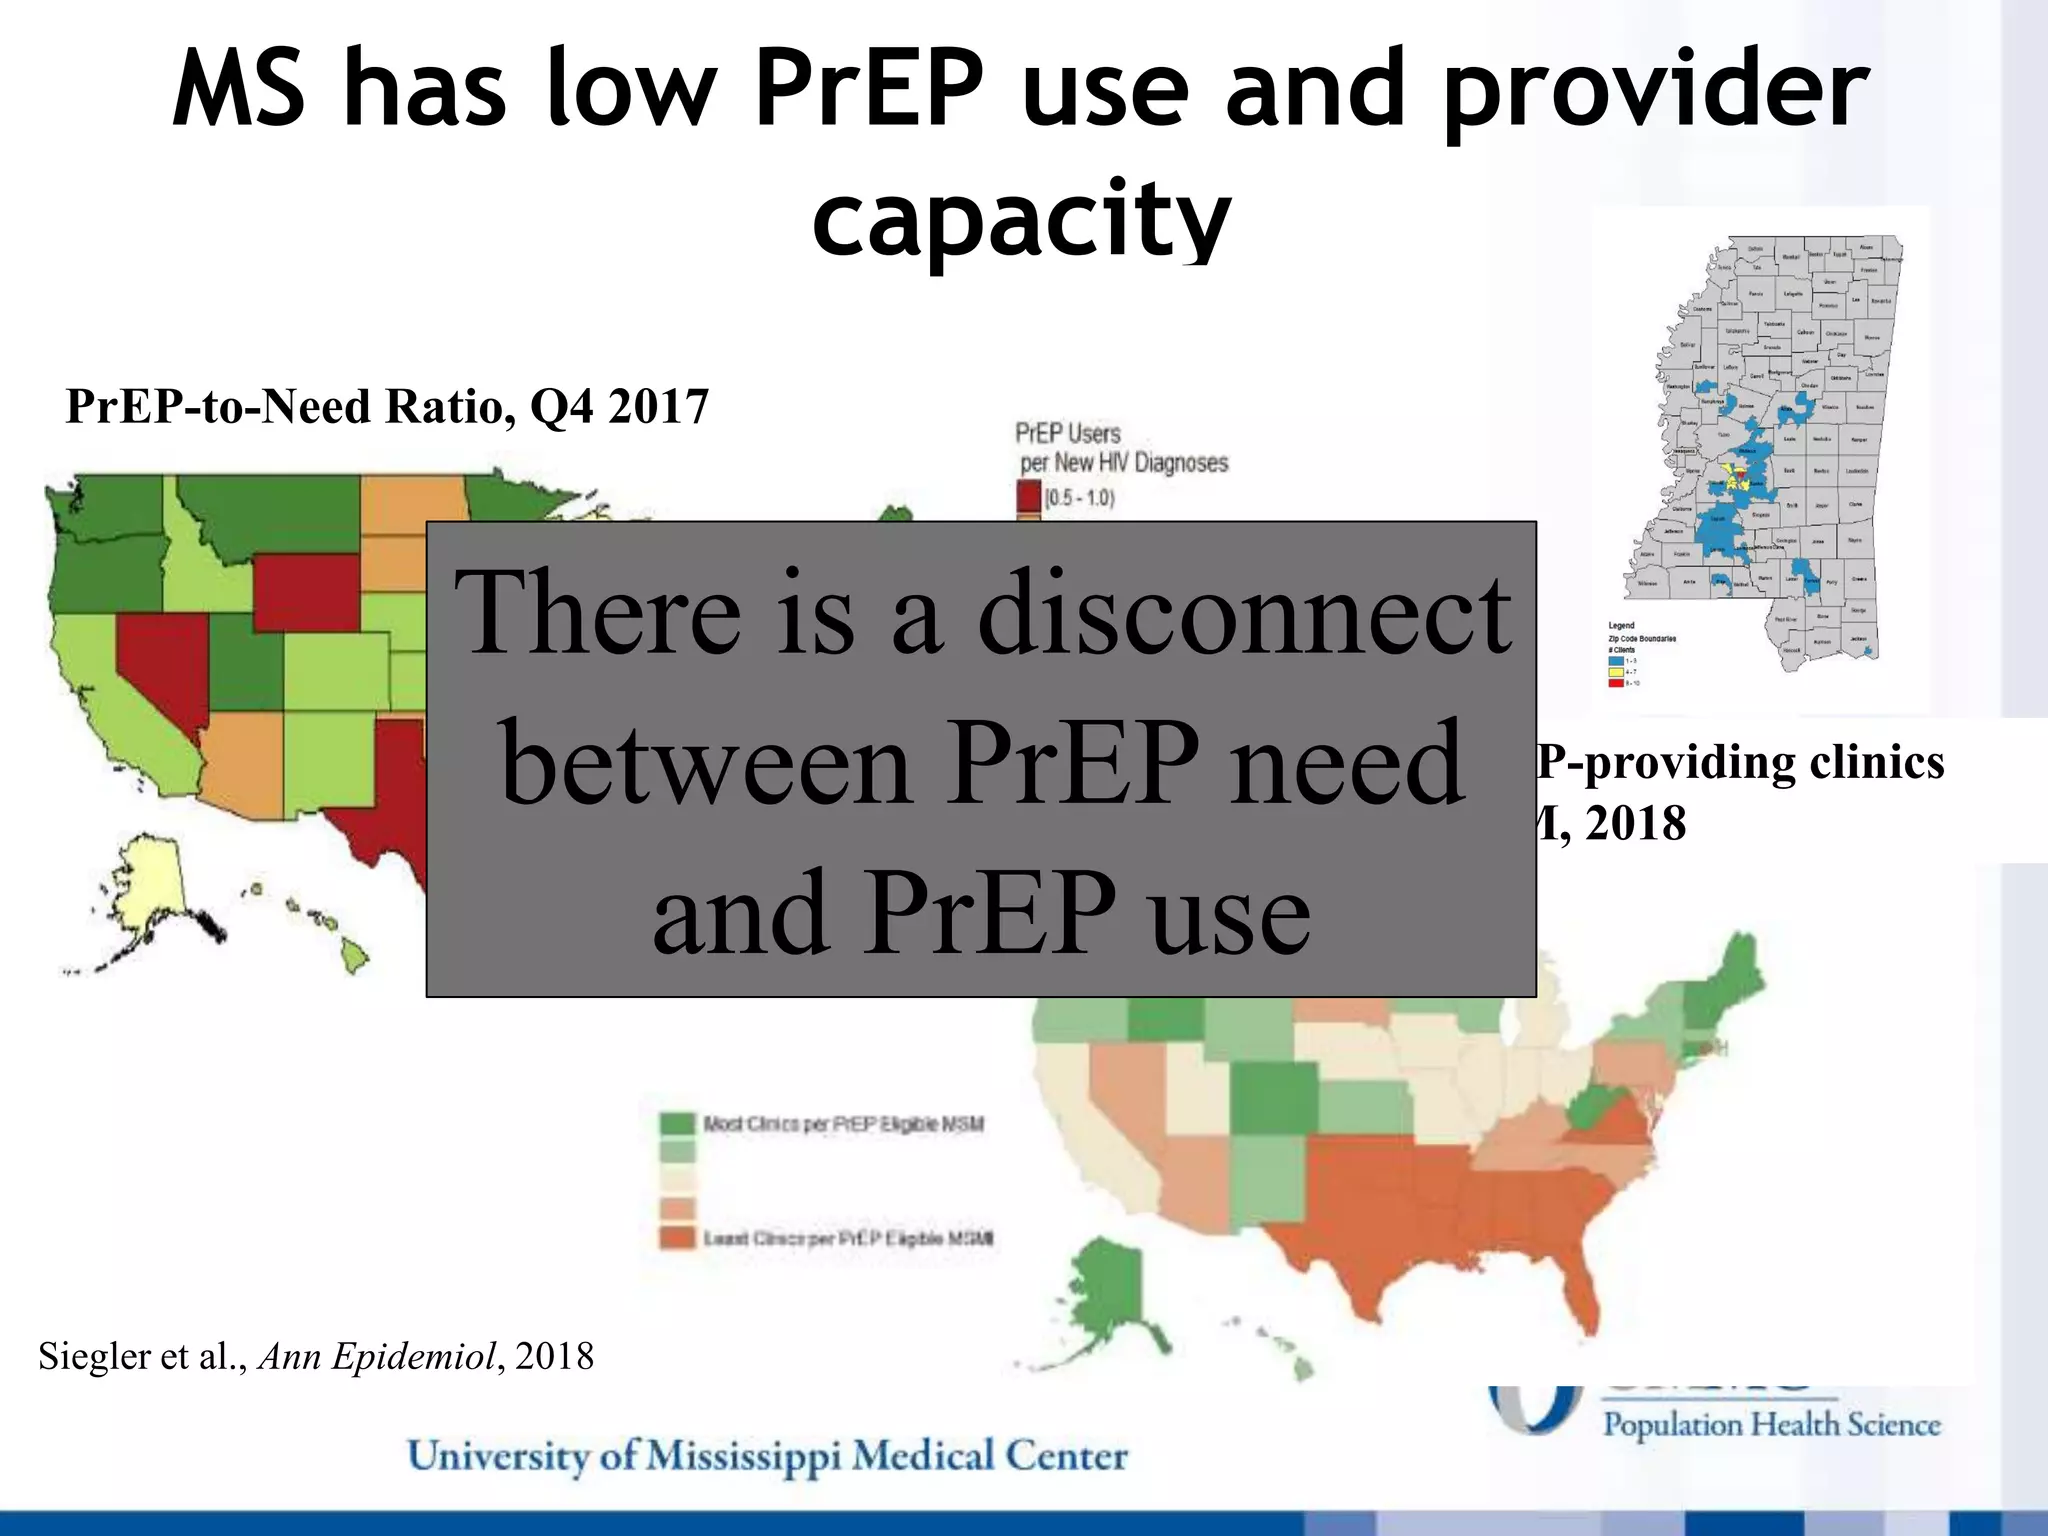
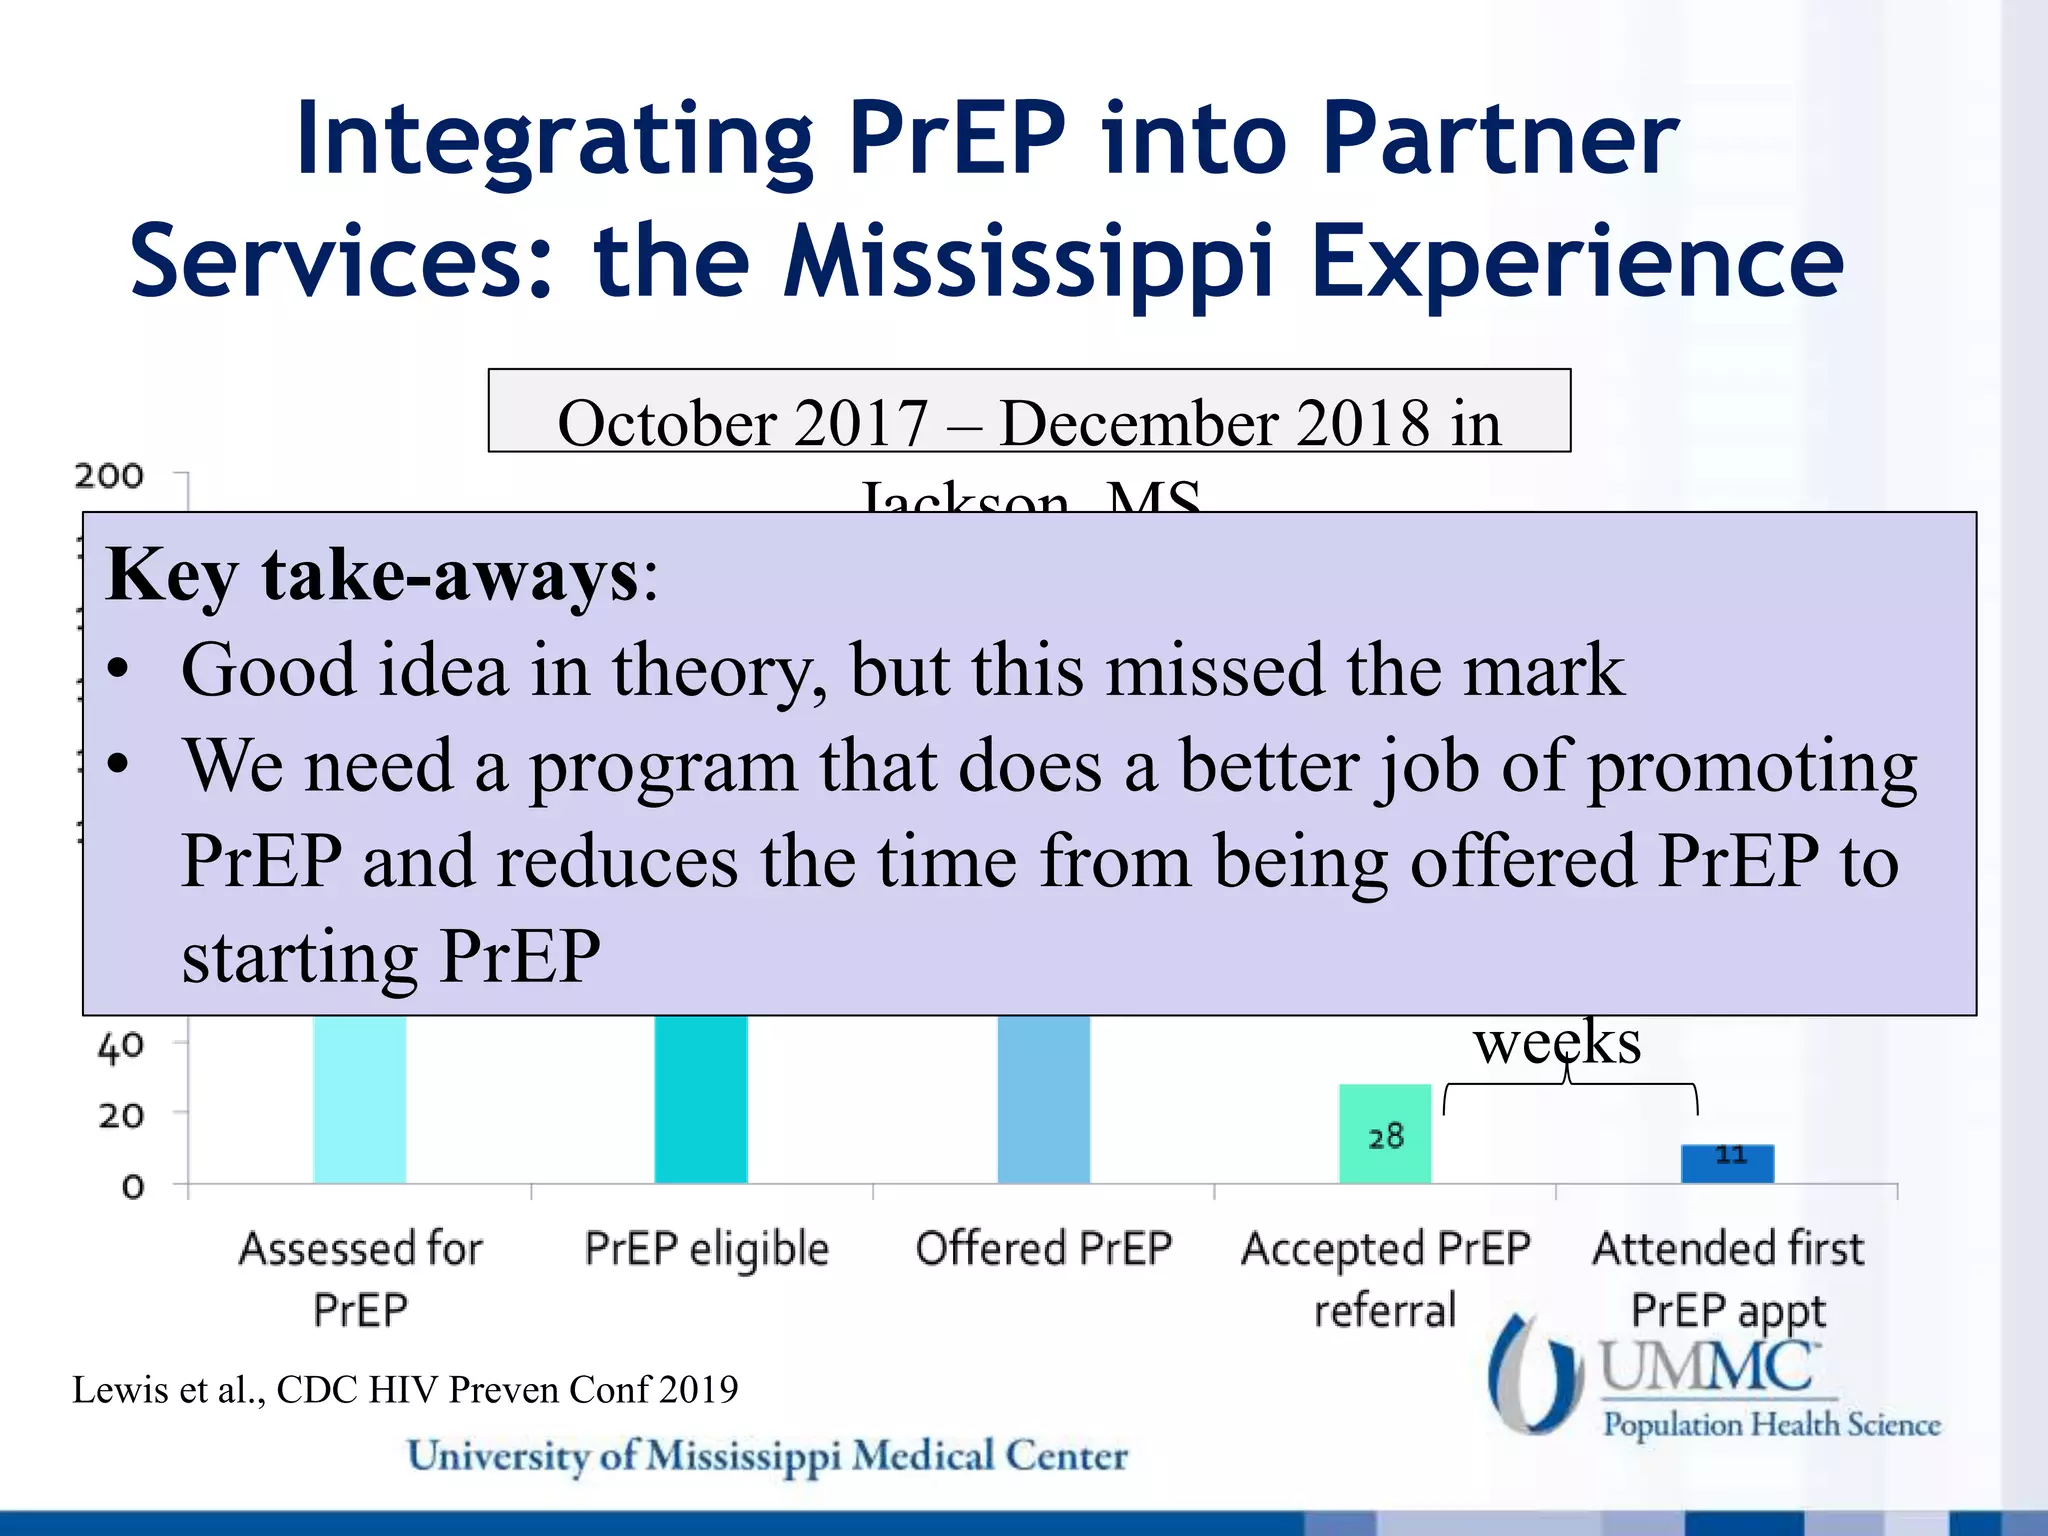
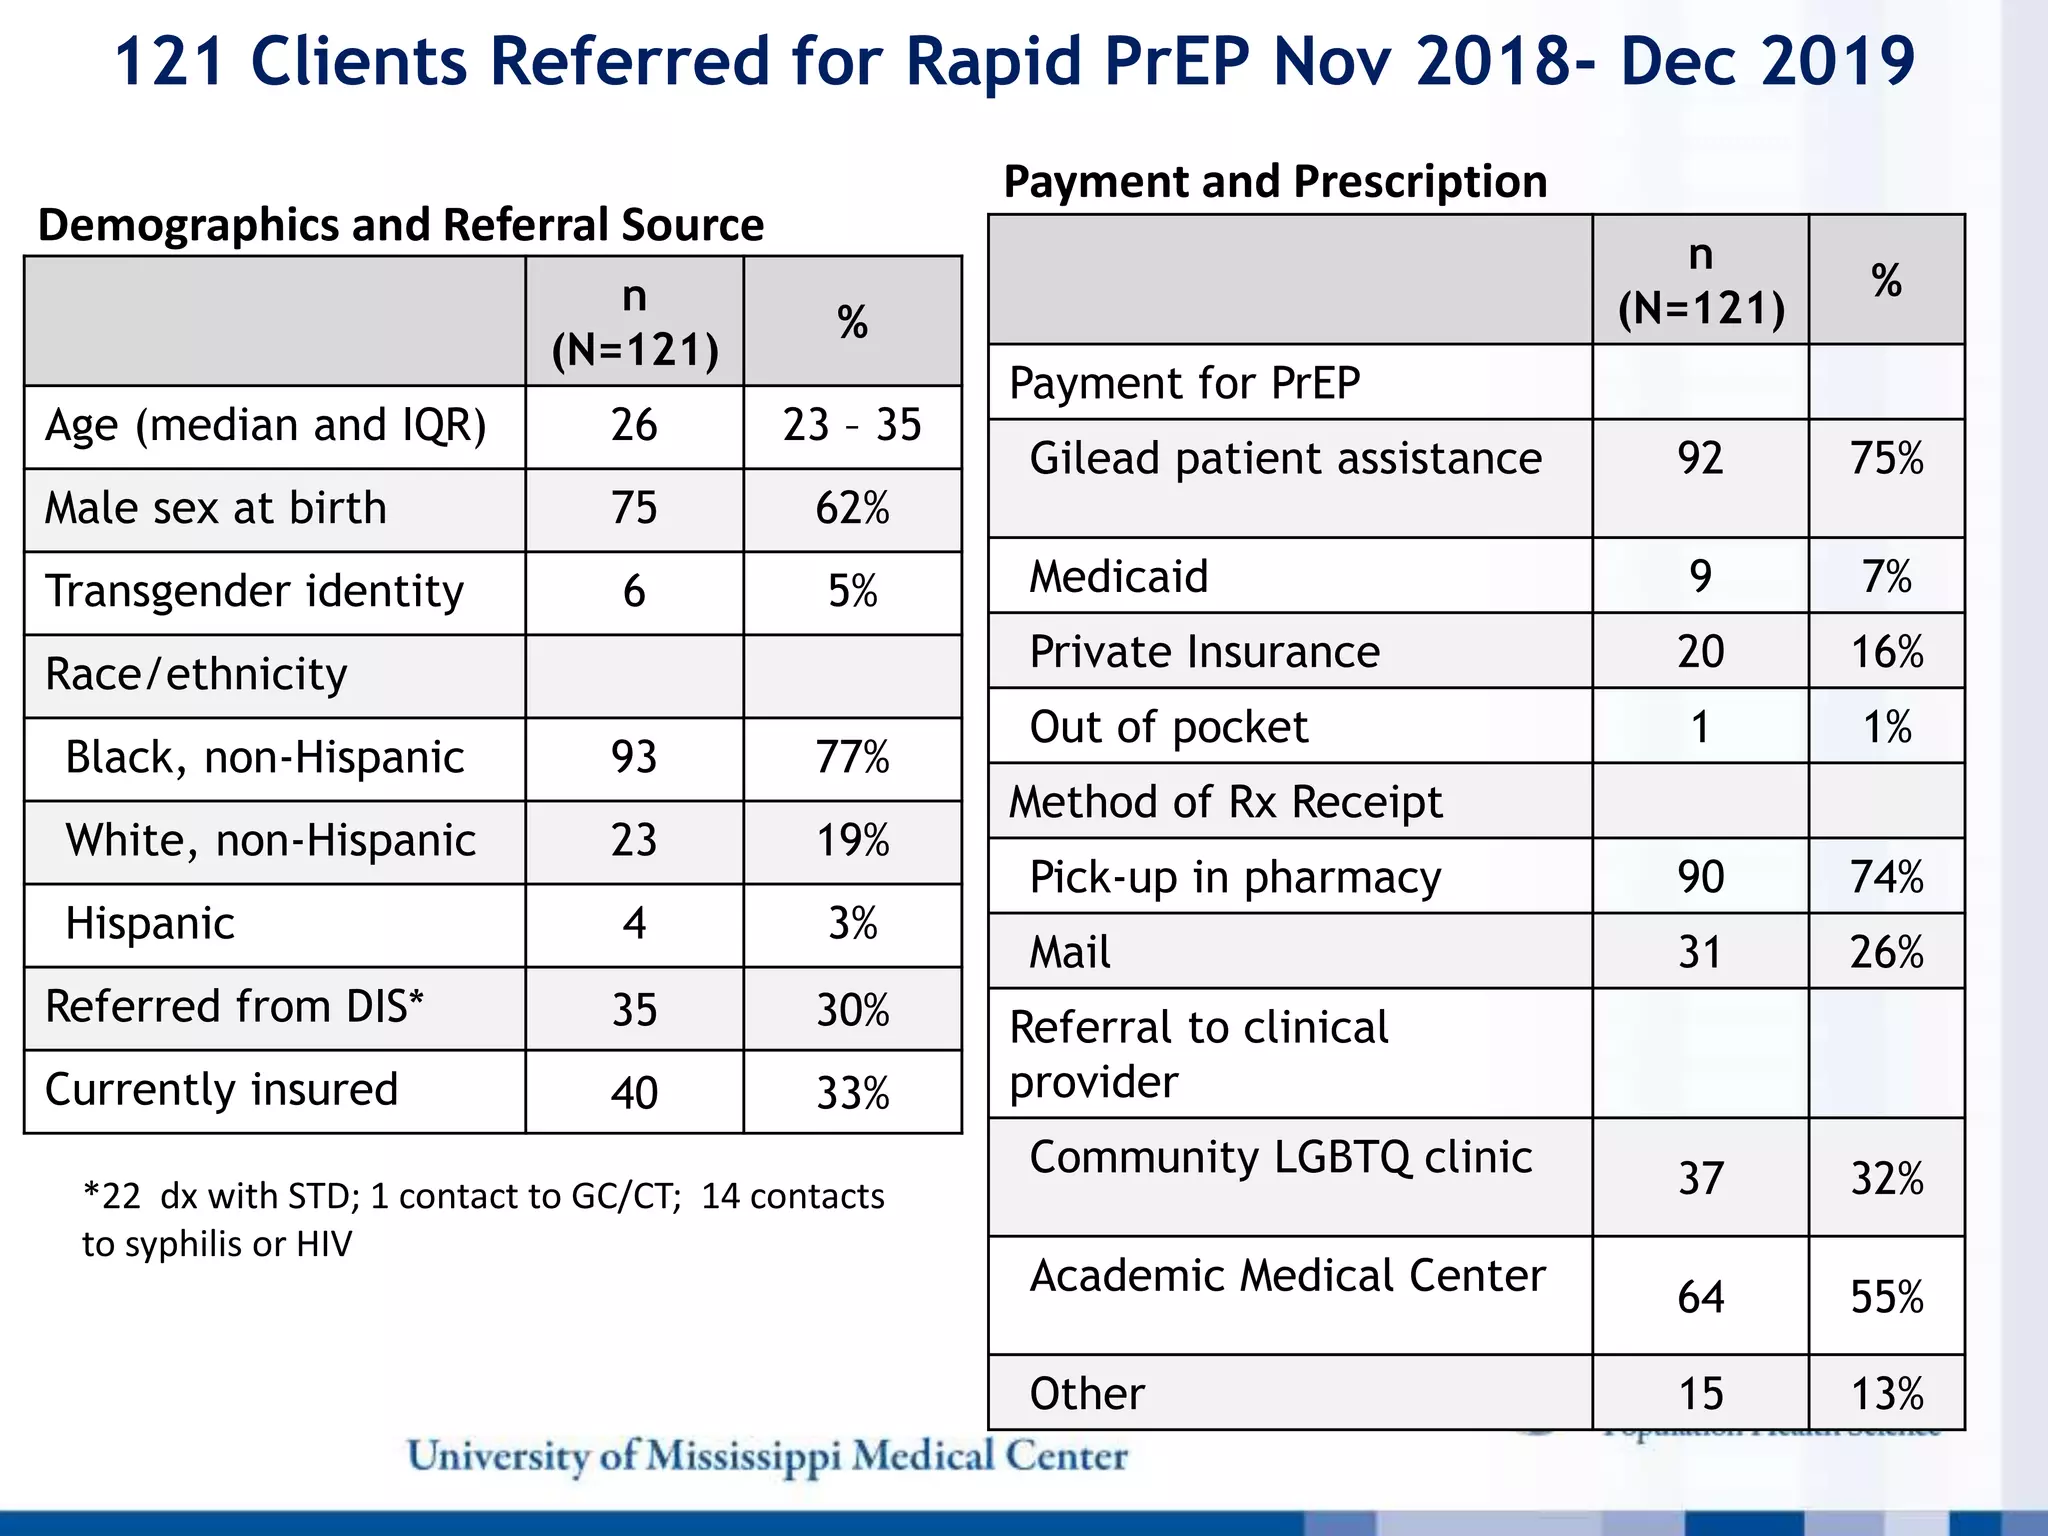
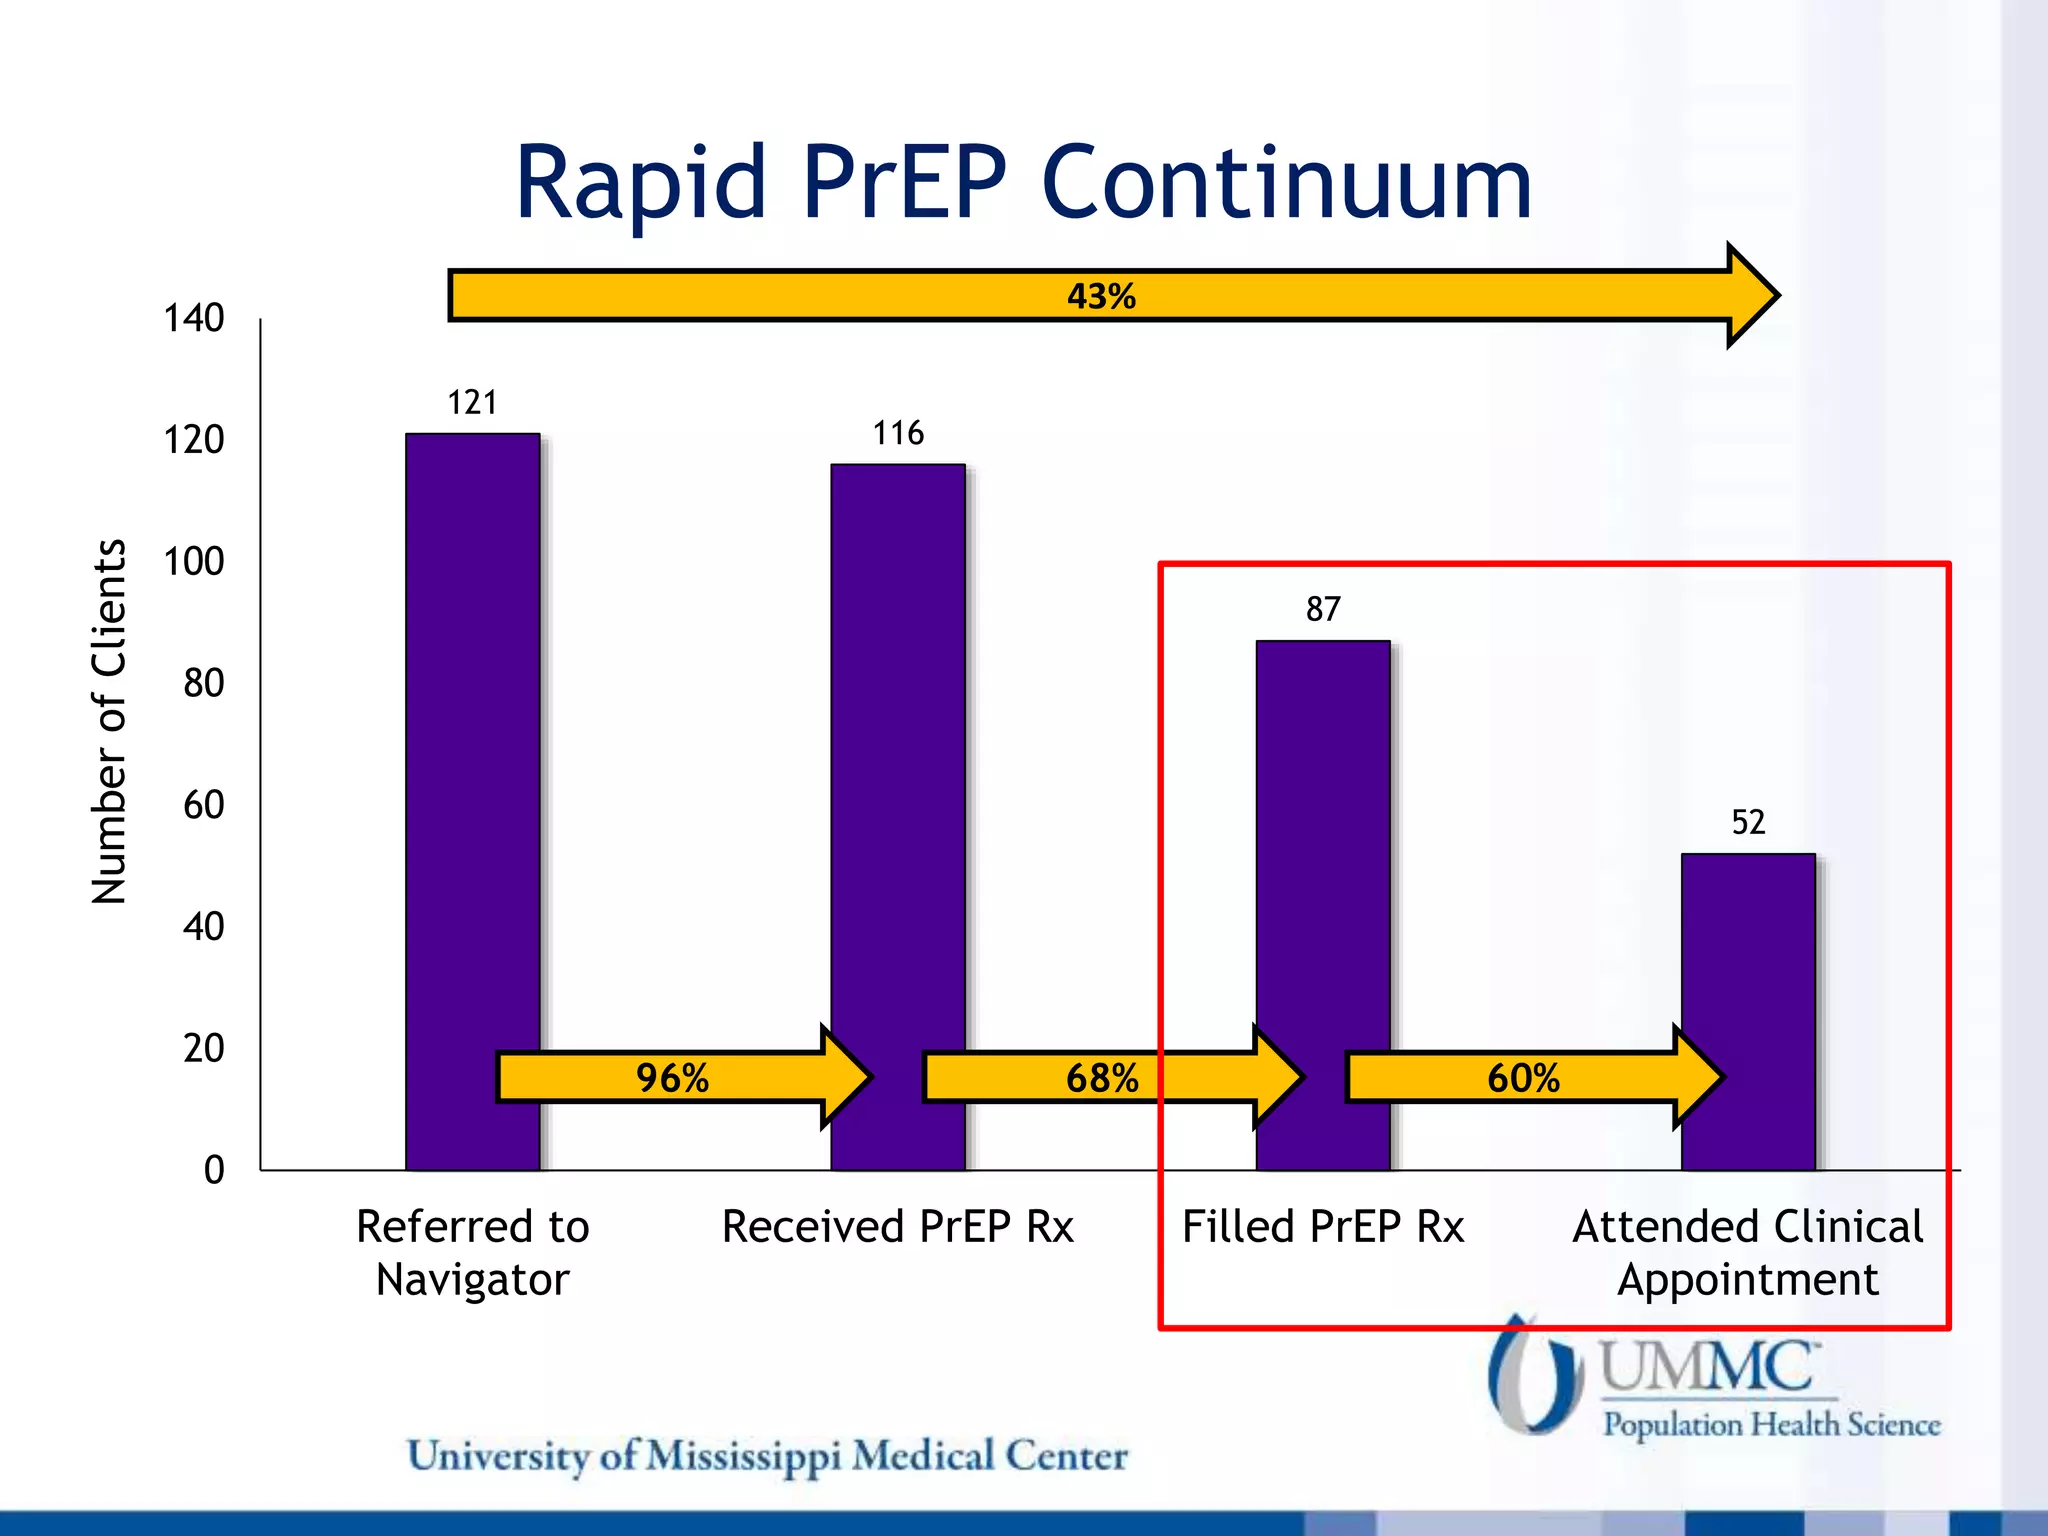
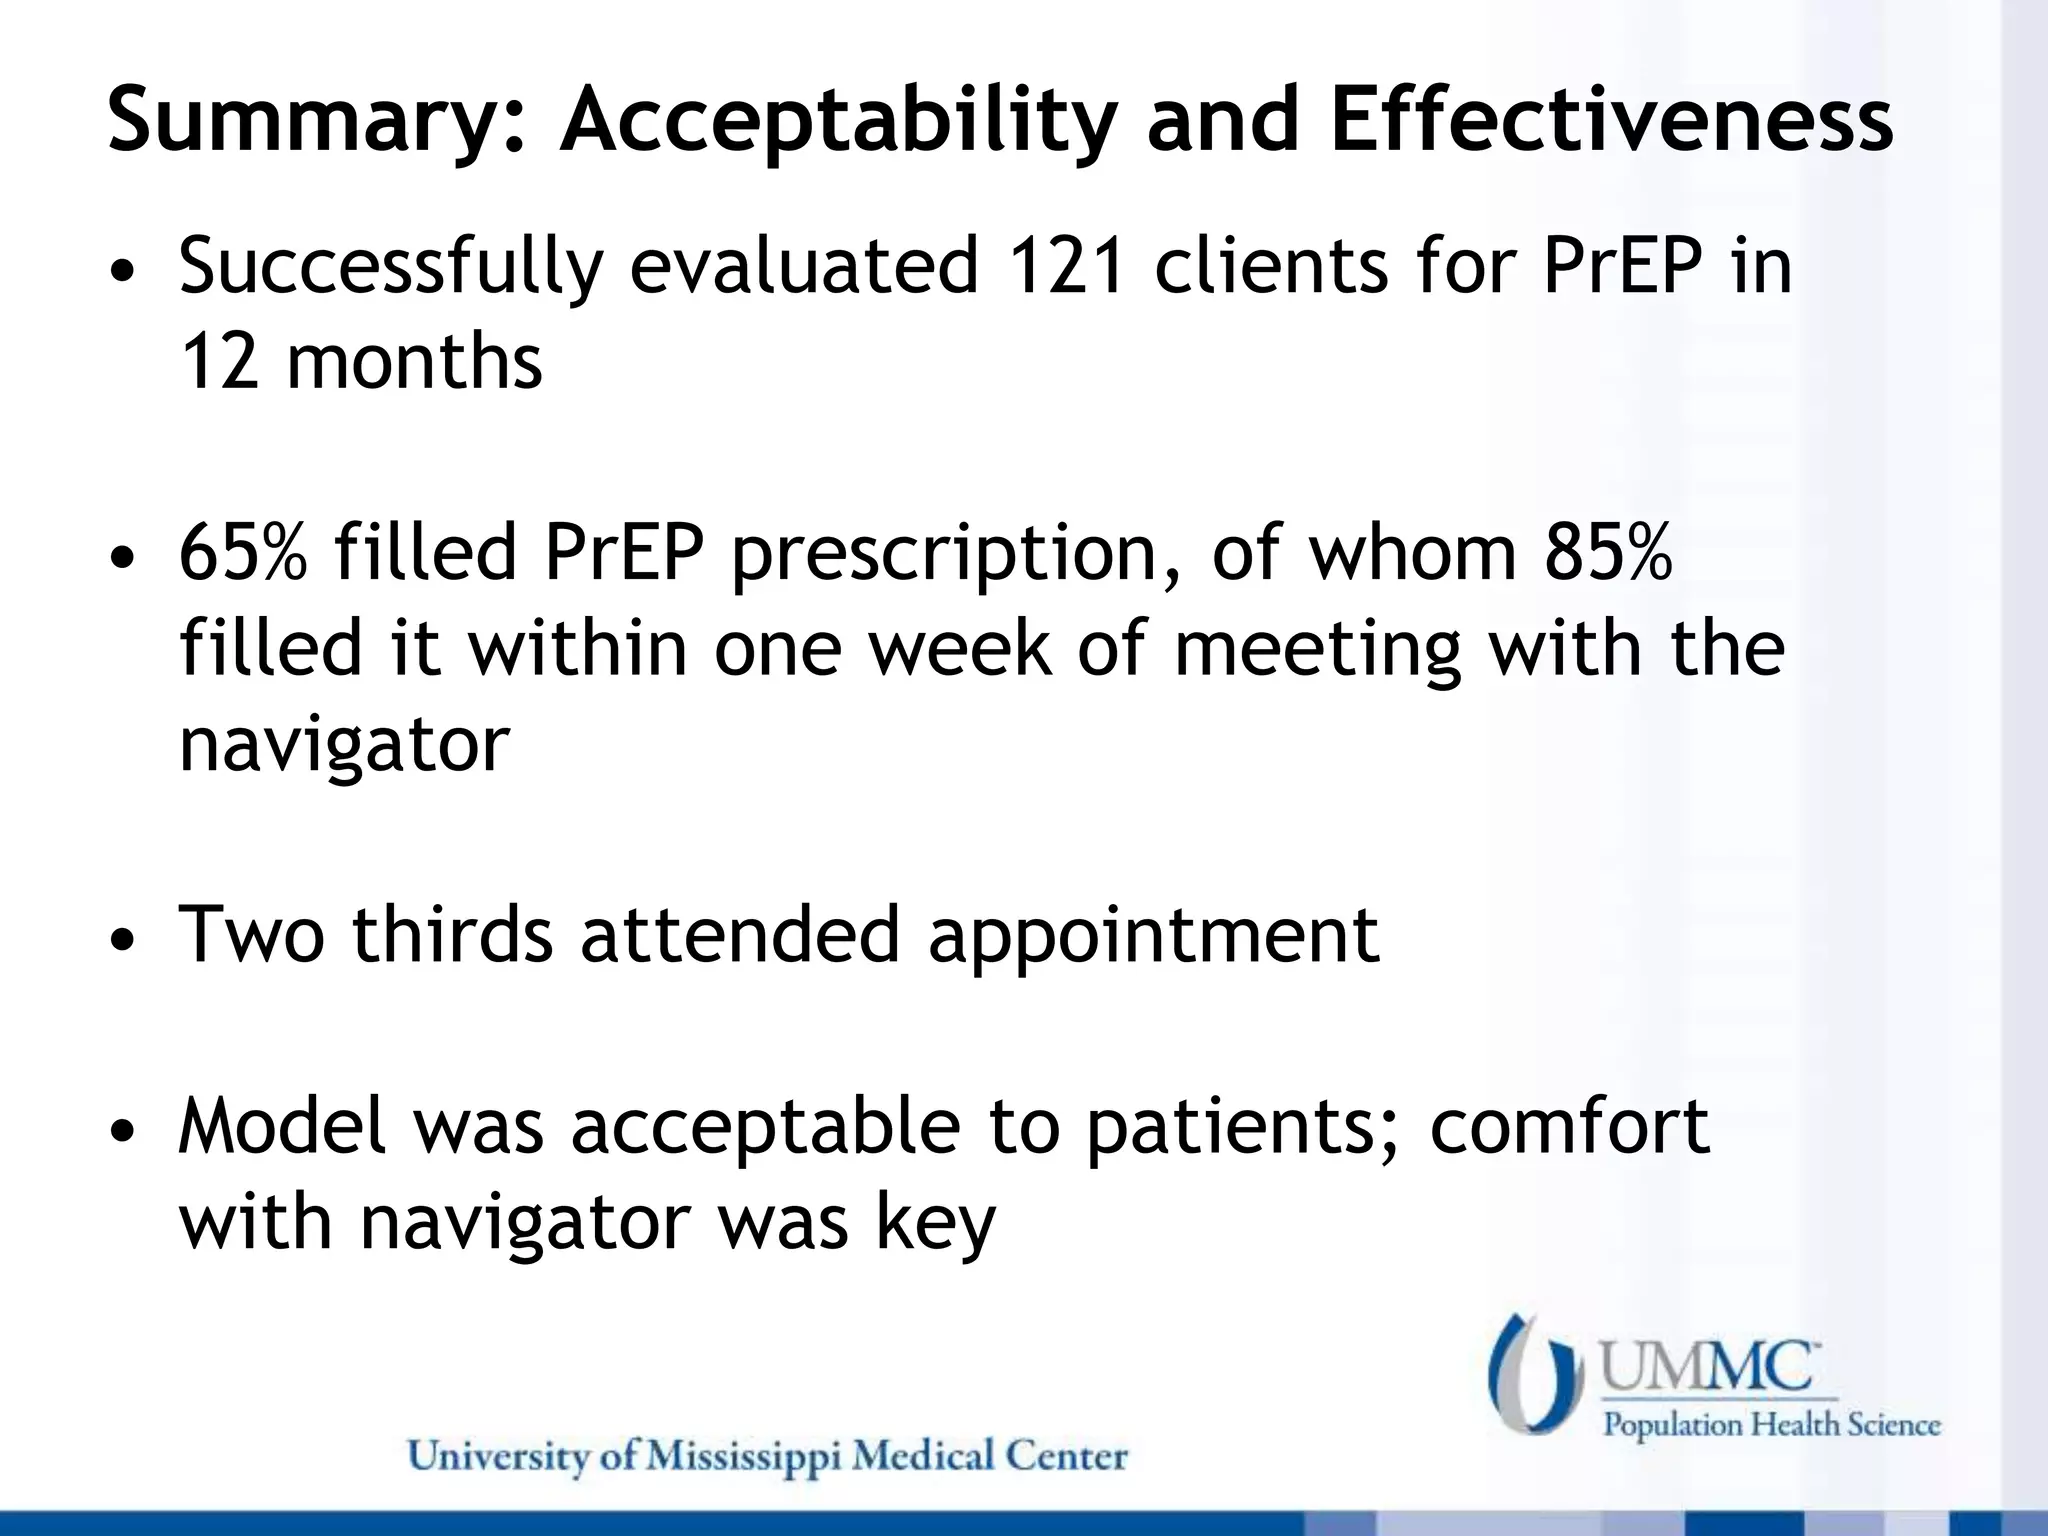
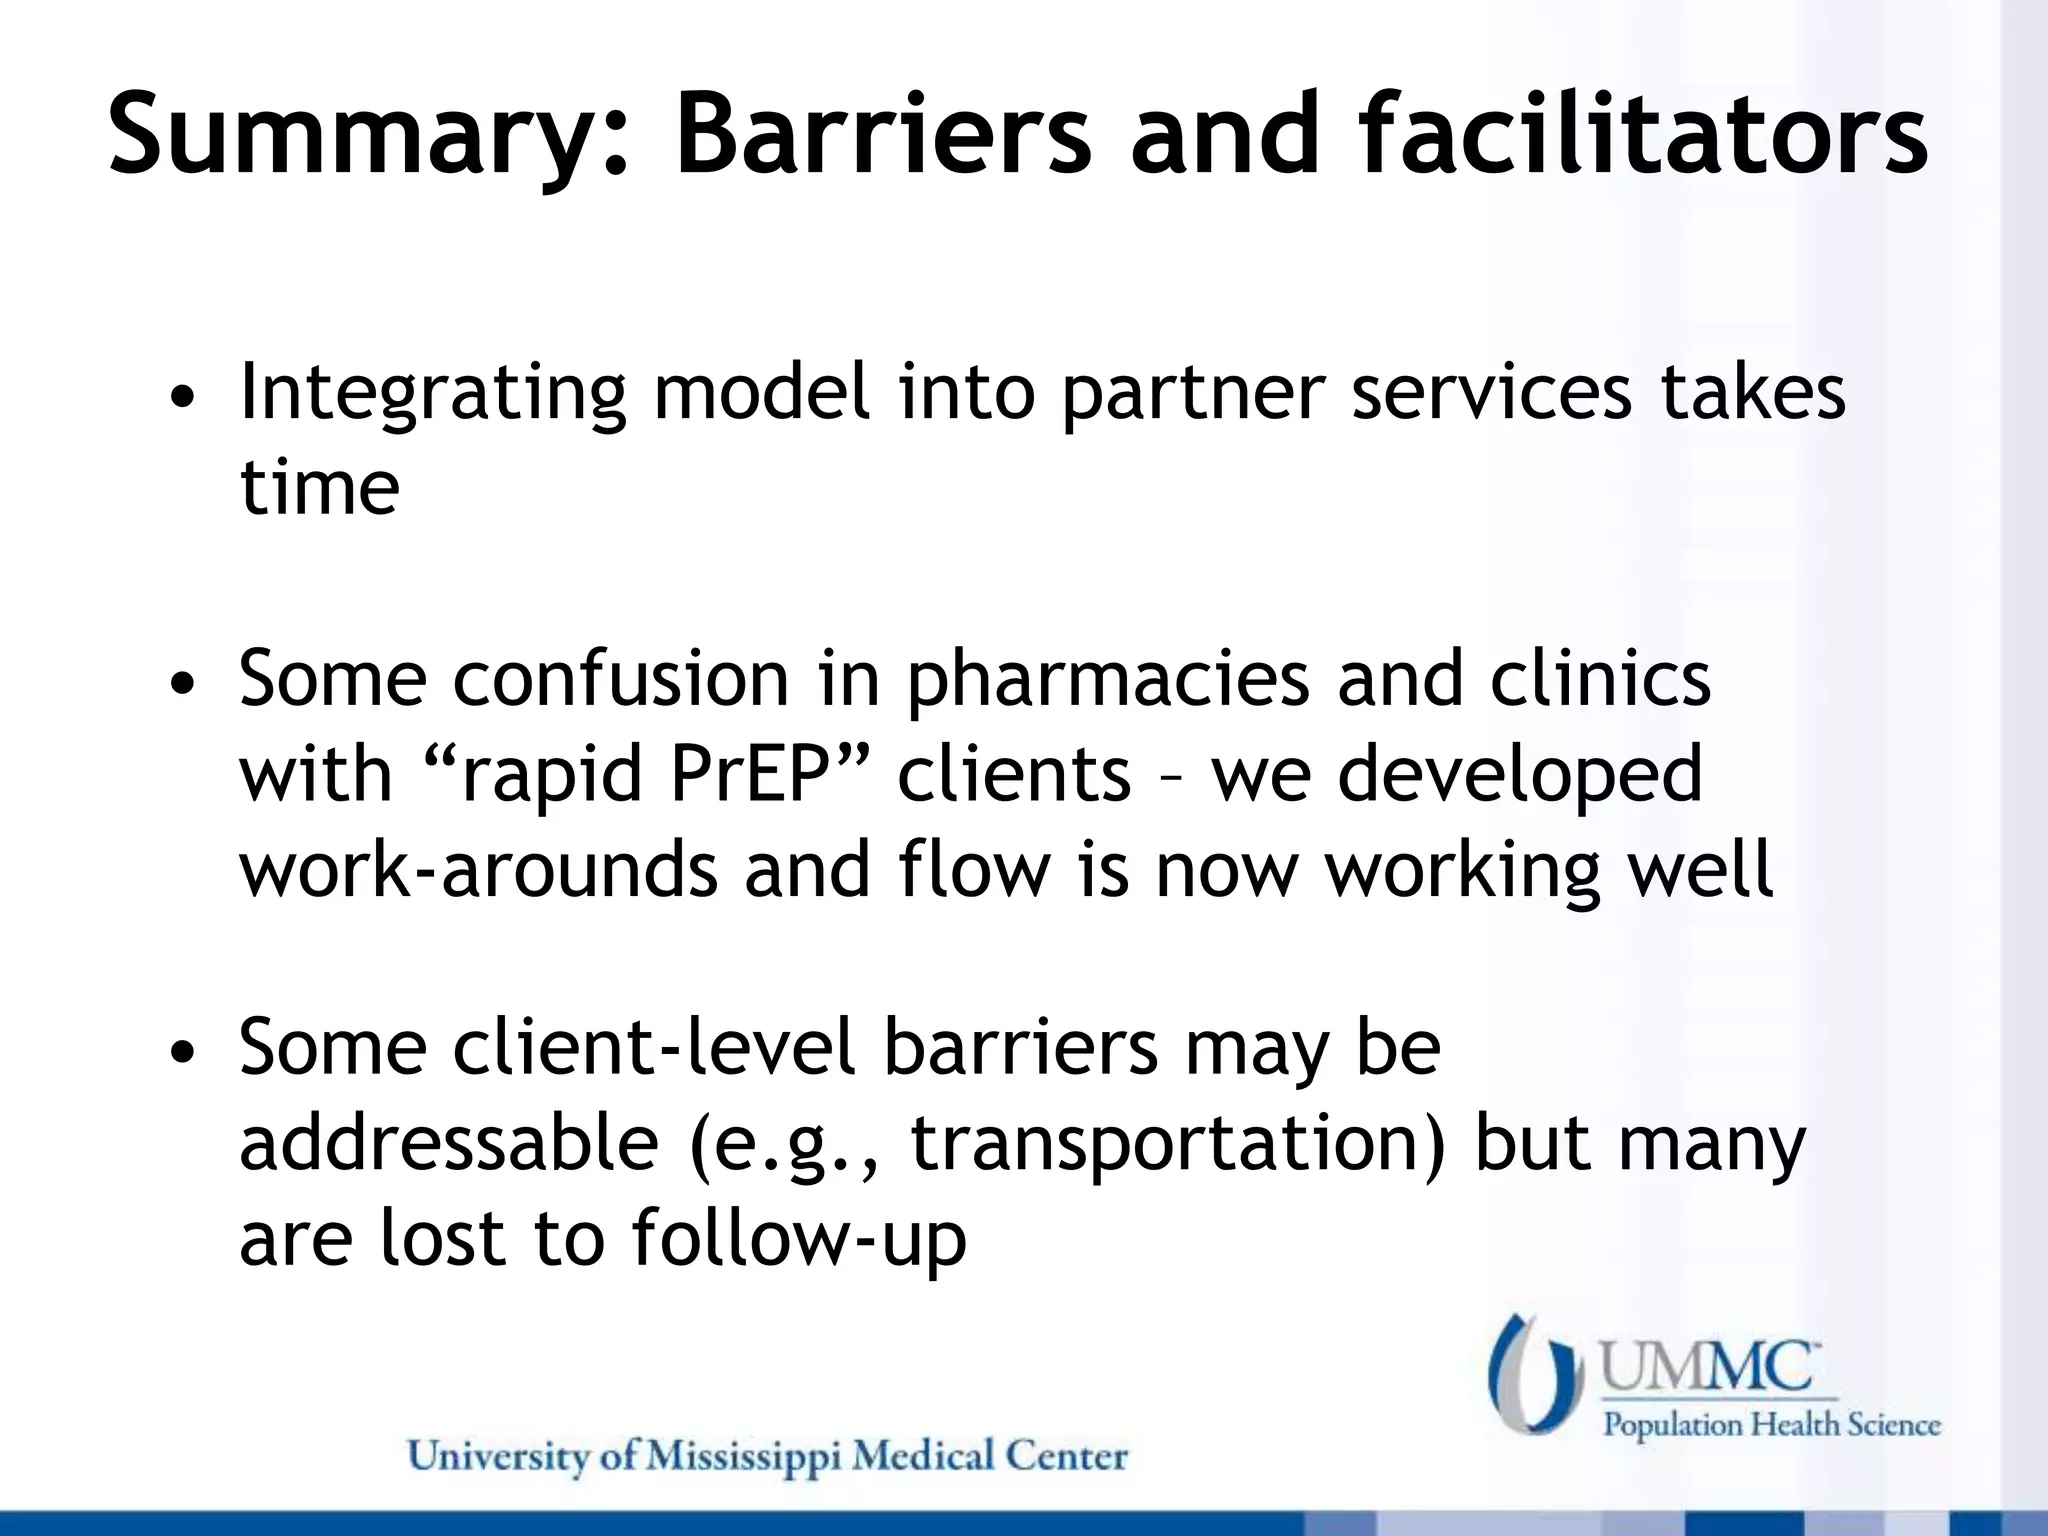
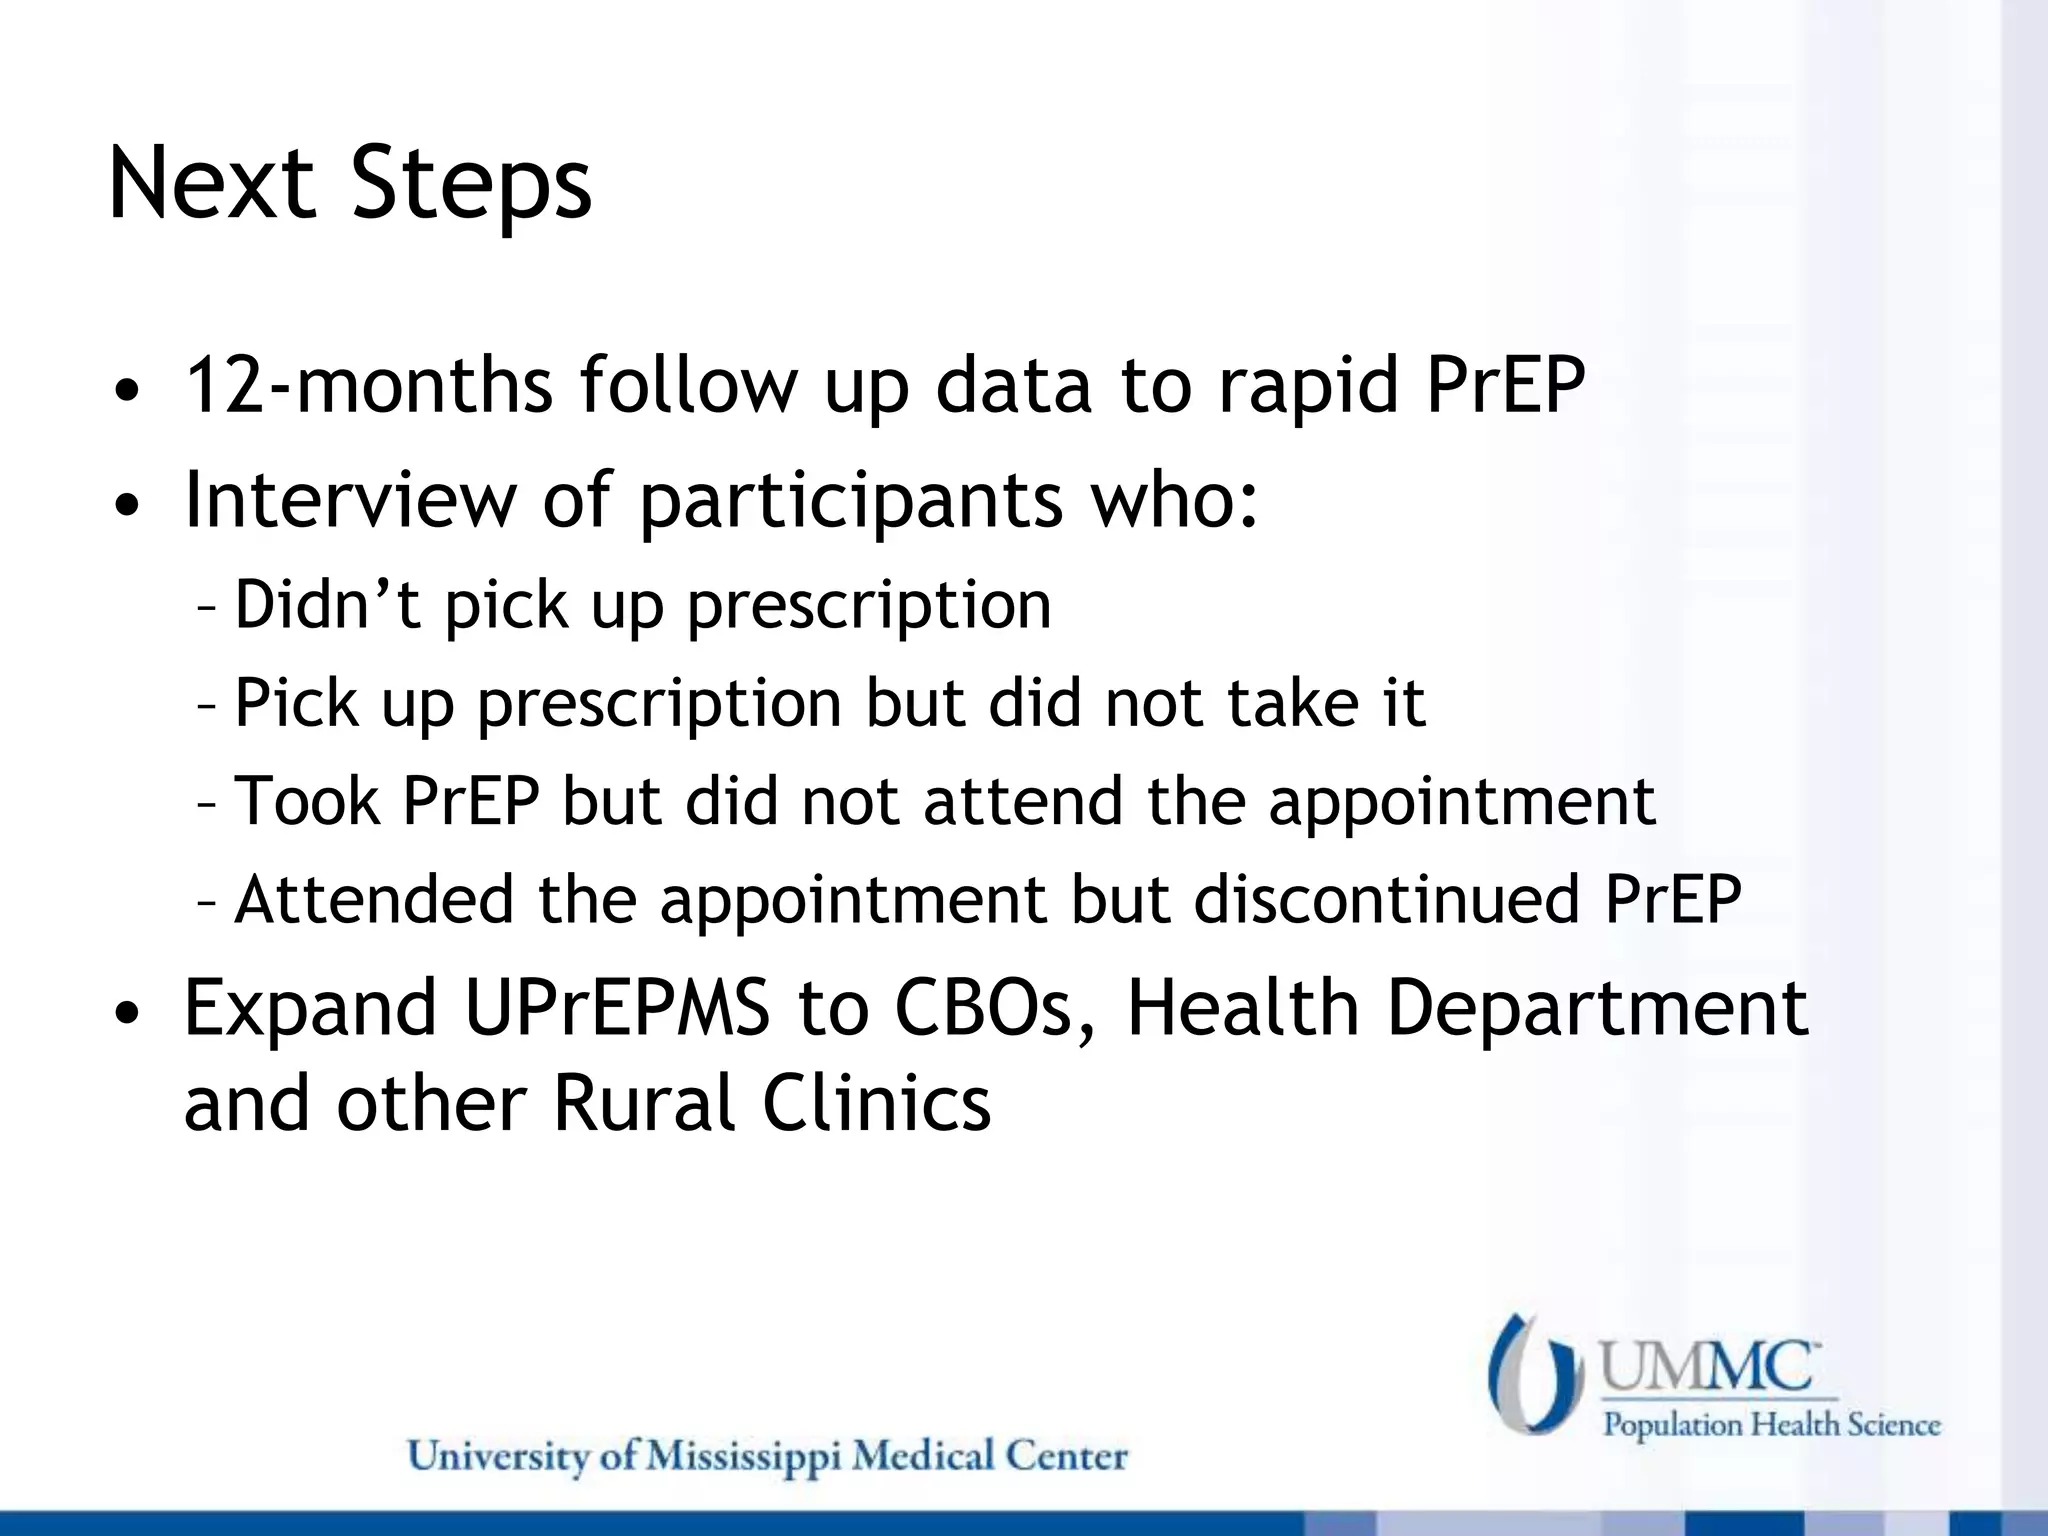
HIV & Global Health Rounds
The UC San Diego AntiViral Research Center sponsors weekly
presentations by infectious disease and global public health clinicians,
physicians, and researchers. The goal of these presentations is to
provide the most current research, clinical practices, and trends in HIV,
HBV, HCV, TB, and other infectious diseases of global significance.
The slides from the HIV & Global Health Rounds presentation that you
are about to view are intended for the educational purposes of our
audience. They may not be used for other purposes without the
presenter’s express permission.
Not the Same Old Blues: Trails
of the Efforts to Improve PrEP
Uptake in Mississippi
Leandro Mena, M.D., M.P.H.
Chair and Professor of Population Health Science
Professor of Medicine, Infectious Diseases
I have the following relevant financial
relationships to Disclose:
• Consultant for Gilead Sciences, ViiV Healthcare, Roche, and Merck
• Received Research Grants from Gilead Sciences, ViiV
Healthcare/GSK, Janssen, Binx Health (Atlas Genetics), Becton
Dickinson and Company, Rheonix, Click Diagnostics, Roche, Evofem,
Westat, and Lupin
These potential conflicts of interest have been resolved through peer-review of slides
and my presentation will adhere to the following criteria:
• My recommendations will be based on data and findings from peer-reviewed sources
OR in the absence of adequate peer-reviewed material, my recommendations will
rely on the best available evidence-based medicine.
• Content will be fair and balanced, and if any product, specific drugs, or devices are
discussed, alternate drugs or devices will also be discussed when appropriate
Objectives:
• Describe main disparities in HIV epidemic in the
US and Mississippi
• Identify factors that affect scale up of PrEP in
the South and Mississippi
• Describe examples of PrEP cascade in Jackson,
MS
• Present data from evaluation of novel models of
PrEP initiation in Mississippi
Rates of Diagnoses of HIV Infection among Adults and Adolescents
2018—United States and 6 Dependent Areas
N = 37,741Total Rate = 13.6
Note. Data for the year 2018 are considered preliminary and based on 6 months reporting delay.
• More people living
with HIV reside in
the South than
any other region of
the country (42%)
• 51% of all HIV
diagnosis in the U.S.
in 2018 were in the
South
The US HIV Epidemic Is Centered in the South
HIV Disproportionally Impact MSM in the south, especially
MSM of Color
Lifetime Risk of HIV Diagnosis by Race
• Whites
– 1 in 140 for men
– 1 in 11 MSM
– 1 in 941 for women
• Hispanics
– 1 in 51 for men
– 1 in 5 MSM
– 1 in 256 for women
• Blacks
– 1 in 22 for men
– 1 in 2 MSM
– 1 in 54 for women
Hess L et al. Ann Epidemiol. 2017 April; 27 (4):238-243
Prevalence rates* of HIV among MSM by race
and ethnicity in Southern States (2013)
(Rosenberg ES, et al. Rates of prevalent and new HIV diagnosis by race and ethnicity
among men who have sex with men, U.S. states, 2013-2014. Annals of Epidemiology
2018)
* Rate per 100
Snap Shot of Mississippi
• Mississippi’s population - 2,987 million (2018)
• 55% of population reside in rural areas1
– Geographic barriers to care as many PLWHA live far from
nearest treatment location
• Highest percentage of residents living in poverty2
(19% vs 12% nationwide)
• High rate of uninsured PLWHA (39%) or Medicaid
only (14%)3
• Among highest rates of syphilis gonorrhea and
chlamydia4
1. US Department of Agriculture Economic Research Service (2011). State Fact Sheets: Mississippi. Retrieved from
http://www.ers.usda.gov/StateFacts/ms.HTM
2. Source: U.S. Census Bureau, Current Population Survey, 2016 to 2019 Annual Social and Economic Supplements.
3. MSDH - Single site sample of patients in-care MS Careware Data
4. CDC. STD Surveillance 2017. Atlanta:
HIV/AIDS in Mississippi
https://aidsvu.org/local-data/united-states/south/mississippi/
• Rate of new HIV diagnosis is 16 per
100,000 Mississippians
– 6th highest in the US
– 12% increase from 2017
• Among people living with HIV (10,325),
64% received medical care and 44%
were virally suppressed
• 18% of people diagnosed with HIV in
Mississippi were Black men who have
sex with men (MSM) less than 25 years
old, who represented <1% of the
population
• 37% of women diagnosed with HIV
were diagnosed with AIDS within one
year of their HIV diagnosis
MS: Rates of New HIV Cases 2013-2018
2018
• 477 New cases
• 78% Men
• 50% MSM
• 60% < 35 years old
• 74% Black
• 50% MSM
• 10,345 living with HIV
MS HIV/AIDS Epidemiologic Profile 2018, C Khosropour
Hotspot Cluster Map for HIV in Mississippi,
2008-2014
HIV rates per 100,000
African Americans in
Mississippi
Case counts
among MSM in
Mississippi
HIV rates per 100,000
population
HIV Clustering in Mississippi: Spatial Epidemiological Study to Inform Implementation Science in the Deep
South. Stopka T. et al. JMIR Public Health Surveill 2018
Number of New HIV Diagnoses and Projected HIV Diagnoses to Meet EHE
Goals
75% decline in
HIV diagnoses
50% decline in
HIV diagnoses
485
511
424 427
476 480
426
375
324
273
222
171
119
443 409
375
341
307
273
239
0
100
200
300
400
500
600
New HIV Diagnoses
(Measured)
MississippiNumber of New HIV Diagnoses and Projected
HIV Diagnoses to Meet EHE Goals
PrEP: A revolutionary innovation,
but a difficult implementation
PrEP Care Continuum
Nunn et al. AIDS 2017, 31:731–734
CHALLENGES TO SCALE UP PrEP IN THE
PREVENTION IN THE SOUTH
• RURALITY: large distances & shortage of PrEP providers
• RACE: Increased proportions ofAfrican Americans & racial
disparities in health care, unfair criminal justice system
• POVERTY
• POOR HEALTH INFRASTRUCTURE
• POOR IT INFRASTRUCTURE
• DISTRUST IN HEALTH CARE SYSTEM
• INADEQUATE STATE & FEDERAL FUNDING
• LACK OF EDUCATION
• UNDERESTIMATION OF PERSONAL RISK FACTORS
• ANTI-IMMIGRANT POLICIES & HEALTH-RELATED
IMMIGRANT BILLS
• HIV STIGMA &“AGGRESSIVE HOMOPHOBIA”
Adapted From Southern AIDS Coalition. Southern States Manifesto HIV/AIDS in the South: A call to action!
(2016 Update)
MS has low PrEP use and provider
capacity
Siegler et al., Ann Epidemiol, 2018
PrEP-to-Need Ratio, Q4 2017
The proportion of PrEP-providing clinics
per PrEP-eligible MSM, 2018
There is a disconnect
between PrEP need
and PrEP use
Open Arms Healthcare Center,
Jackson, MS
LGBTQ
Community
Mississippi State
Department of Health
UMMC
Division of
Infectious
Diseases
My Brother’s Keeper Inc.
PrEP Patient’s Characteristics at Initiation
Patient’s
Characteristics
%
Mean Age (range) 29 (17-71)
Male
MSM
90
87
African American/Black 70
Some College or higher 59
Income < $12,000/mo. 49
Uninsured 50
Serodiscordant 25
N=475
PrEP
Referrals
STD Clinic -
DIS
Outpatient
Doctors
&
Community
Partners
Self/Friends
Research
Studies
PEP Programs
PrEP Clinic Referral Network
20%
10%
3%
32%
8%
100% (108)
PrEP Education and Counseling
72%(78)
Willing to start PrEP
71%(77)
Scheduled Appointment
20%(22)
Made Appointment
15% (16)
Picked Up Rx
9%(10)
Attended 3
month FU
• Mean age 22.7 yr (18-29)
• High risk (100%)
• 66% non-exclusive sex
partner
• Insurance (45%)
PrEP Uptake Among YBMSM in Jackson STD Clinic
Arnold T, 2017
Integrating PrEP into Partner
Services: the Mississippi Experience
October 2017 – December 2018 in
Jackson, MS
~3-4
weeks
Lewis et al., CDC HIV Preven Conf 2019
10%
Key take-aways:
• Good idea in theory, but this missed the mark
• We need a program that does a better job of promoting
PrEP and reduces the time from being offered PrEP to
starting PrEP
Need to change the PrEP referral model for STD clinics and
DIS providing partner services in Jackson, MS
• Limited client knowledge about PrEP (e.g., health
benefits, availability, cost)
• STD clinic staff and DIS do not have capacity for in-
depth PrEP education and ongoing follow-up with
clients
• Long delay between referral and appointment may
result in low appointment attendance
• Small proportion of those with PrEP indication
attended PrEP initiation appointment
Arnold et al., PLoS One. 2017 Feb 21;12(2):e0172354
Peyton et al., CDC STD Preven Conf 2018
• Informed by IMB
• Targeted social support, stigma and
communication with provider
• Intervention was composed of free,
publically available links to interactive
websites and YouTube videos
• AA men received texted material over
four weeks
• AA men ≥21 years who received the
intervention were:
• more likely to be taking PrEP at
12 weeks after intervention (55%
vs. 18%, p=0.02)
• More likely to have picked up a
PrEP prescription over the 24-
week study period (50.5 vs. 17%,
p =0.04)
PrEP Mobile*
*A Mobile Intervention to Improve Uptake of PrEP for Southern Black MSM,
1R34MH111342-01A1, Whiteley L, Mena L
Whiteley L, et al., AIDS Behav 2021 Jun;25(6):1884-1889
Rapid PrEP Initiation Pilot Study
Pilot Study Objectives
Overall goal: Develop an optimized rapid PrEP
initiation model
Objectives:
1. Evaluate the acceptability and effectiveness
of the rapid PrEP model
2. Identify barriers and facilitators to
implementing the rapid PrEP model
STD clinic
Staff/DIS
PrEP
Navigator
Same-day PrEP
Rx to local
pharmacy
Appointment
with clinical
provider
•PrEP Education
•Assess for acute HIV
•Medical and meds hx
•Insurance paperwork
•Standard STD/HIV screening
and risk assessment
•Standard partner services
interview
•Rapid HIV test
Within 12 weeks
•Creatinine
•Hep B testing
Rapid PrEP model
If HIV-neg
Navigator is a
clinical pharmacist!
Provide a prescription the same day as
a referral:
•In absence of clinician
•Without completion of baseline
creatinine and Hep B labs (completed
after PrEP initiation)
Khosropour C et al., AIDS Patient Care STDs 2020
121 Clients Referred for Rapid PrEP Nov 2018- Dec 2019
n
(N=121)
%
Age (median and IQR) 26 23 – 35
Male sex at birth 75 62%
Transgender identity 6 5%
Race/ethnicity
Black, non-Hispanic 93 77%
White, non-Hispanic 23 19%
Hispanic 4 3%
Referred from DIS* 35 30%
Currently insured 40 33%
*22 dx with STD; 1 contact to GC/CT; 14 contacts
to syphilis or HIV
n
(N=121)
%
Payment for PrEP
Gilead patient assistance 92 75%
Medicaid 9 7%
Private Insurance 20 16%
Out of pocket 1 1%
Method of Rx Receipt
Pick-up in pharmacy 90 74%
Mail 31 26%
Referral to clinical
provider
Community LGBTQ clinic 37 32%
Academic Medical Center 64 55%
Other 15 13%
Demographics and Referral Source
Payment and Prescription
Rapid PrEP Continuum
121
116
87
52
0
20
40
60
80
100
120
140
Referred to
Navigator
Received PrEP Rx Filled PrEP Rx Attended Clinical
Appointment
Number
of
Clients
96% 68% 60%
43%
Clients are receiving PrEP the same day
121 116
87
52
0
20
40
60
80
100
120
140
Referred to
Navigator
Received PrEP Rx Filled PrEP Rx Attended Clinical
Appointment
Number
of
Clients
100% had visit with
navigator with-in 2
business days of the
rapid HIV test 96% received rx within 5 days
72% filled rx within 7 days
*51% attended
appt w/in 8 weeks
Top reasons for not attending appointment
(n=48)
7 (24 %) of 29 clients who did not pick up their prescription, later on
contacted the navigator to re-initiate process of getting on PrEP
• 25% no longer want to take PrEP
• 10% lack of transportation
• 6% forgot about appointment*
• 10% Never started PrEP
• 17% Other reasons
• 31% Lost to follow up
* All rescheduled appointment
Rapid PrEP is acceptable to clients
N or median % or IQR
Overall satisfaction with program – median and IQR 99.5 93 – 100
Confident in navigator’s knowledge – median and IQR 99.5 87-100
Wanted to see doctor or nurse instead 3 12%
Confidence in your ability to attend follow-up
appointments – median and IQR
100 93-100
Results from patient satisfaction survey *(N=36)
Clients felt comfortable & liked the ease of rapid PrEP
What did you like about receiving PrEP from this program?
Clients felt comfortable
• “I didn't feel judged or embarrassed she was talked and
explain it to where I would understand and ask me
questions to make sure I did”
• “Kandis made me feel incredibly welcomed and
comfortable throughout the process.”
Clients liked the ease of the program
• “I like how easy and informative this program has been”
• “that they are making a way for people to stay HIV free
and be able to obtain the medication without insurance”
Advantages of having a pharmacist as
navigator
• Expert in medication, insurance and health
services navigation, and patient assistance
• In MS – collaborative practice agreement with
physician allows prescription to be sent by
pharmacist under physician’s name
– Physicians are able to prescribe medications for
patients that they have not seen yet
Summary: Acceptability and Effectiveness
• Successfully evaluated 121 clients for PrEP in
12 months
• 65% filled PrEP prescription, of whom 85%
filled it within one week of meeting with the
navigator
• Two thirds attended appointment
• Model was acceptable to patients; comfort
with navigator was key
Summary: Barriers and facilitators
• Integrating model into partner services takes
time
• Some confusion in pharmacies and clinics
with “rapid PrEP” clients – we developed
work-arounds and flow is now working well
• Some client-level barriers may be
addressable (e.g., transportation) but many
are lost to follow-up
Key Lessons Learned
• Integration into health department partner
services may require dedicated staff
• People may not be ready to start PrEP even if
they fill the prescription
• Pharmacist is key but sustainability is
questionable
• Clients appreciated non-judgmental approach
• People will re-connect when they are ready
to start PrEP; we need to facilitate that “re-
connection”
Can this model be implemented in
other settings?
• Works well in areas with low PrEP provider
capacity
• Need strong clinical partnerships for program
oversight and to accept patients who have
already started PrEP
• Need dedicated staff for ongoing check-ins and
follow-up
UPrEPMS
HRSA Telehealth Center of Excellence
(U66RH31459)
UPrEPMS
151
•Clients seen by PrEP
navigator
144
(95.4%)
•Clients given a PrEP
prescription*
136
(94.4%)
•Clients who picked
up their initial
prescription
Cumulative Summary
Characteristic Results
Age Median: 28 years
(range: 17-67 years)
Birth Sex Male: 120 (80%)
Female: 30 (20%)
Transgender 4 transgender clients (2.7%)
Race/Ethnicity Black: 109 (73.2%)
White: 29 (19.5%)
Other race: 4 (2.7%)
Hispanic: 7 (4.7%)
Insurance 65 (46.1%) clients were
Client Demographics
Cumulative Summary
151
110
(72.8%)
20
(18.2%)
Clients had an initial
PrEP evaluation
Clients attended a
follow-up
appointment
41 clients
with no
initial
clinical
evaluation
documented
Clients had an initial
clinical evaluation
Next Steps
• 12-months follow up data to rapid PrEP
• Interview of participants who:
– Didn’t pick up prescription
– Pick up prescription but did not take it
– Took PrEP but did not attend the appointment
– Attended the appointment but discontinued PrEP
• Expand UPrEPMS to CBOs, Health Department
and other Rural Clinics
Acknowledgements
University of Washington
• Christine Khosropour, PhD, MPH
• Arianna Rubin Means, PhD, MPH
• Monisha Sharma, PhD
Open Arms Healthcare Center
• Sandra Melvin DrPh
• Teayaka Jones
Brown University
• Laura Whitely, MD
• Larry Brown, MD
Mississippi State Department of
Health
• Melverta Bender, MLS, MPH
• Christie Lewis, MPH
• LaPrince Evans
• DIS Supervisors and Team V
• Five Points Clinic Staff
University of Mississippi Medical Center
• Kandis Backus, PharmD, MS, AAHIVP
• Kendra Johnson, MPH
• Courtney Gomillia, MS-PHS
• Nicholas Chamberlain, MD
• Jennifer Brumfield, RN
• Mariah Prather
• James B. Brock, MD
• Laura Beauchamps, MD
• EPH and ASCC staff
Funding:
CFAR Administrative Supplement
(NIHAI027757)
HRSA Telehealth Center of Excellence
(U66RH31459)
NIMH
(5R34MH104068-02)

05.07.21 | Not the Same Old Blues: Trails of the Efforts to Improve PrEP Uptake in Mississippi

  • 1.
    HIV & GlobalHealth Rounds The UC San Diego AntiViral Research Center sponsors weekly presentations by infectious disease and global public health clinicians, physicians, and researchers. The goal of these presentations is to provide the most current research, clinical practices, and trends in HIV, HBV, HCV, TB, and other infectious diseases of global significance. The slides from the HIV & Global Health Rounds presentation that you are about to view are intended for the educational purposes of our audience. They may not be used for other purposes without the presenter’s express permission.
  • 2.
    Not the SameOld Blues: Trails of the Efforts to Improve PrEP Uptake in Mississippi Leandro Mena, M.D., M.P.H. Chair and Professor of Population Health Science Professor of Medicine, Infectious Diseases
  • 3.
    I have thefollowing relevant financial relationships to Disclose: • Consultant for Gilead Sciences, ViiV Healthcare, Roche, and Merck • Received Research Grants from Gilead Sciences, ViiV Healthcare/GSK, Janssen, Binx Health (Atlas Genetics), Becton Dickinson and Company, Rheonix, Click Diagnostics, Roche, Evofem, Westat, and Lupin These potential conflicts of interest have been resolved through peer-review of slides and my presentation will adhere to the following criteria: • My recommendations will be based on data and findings from peer-reviewed sources OR in the absence of adequate peer-reviewed material, my recommendations will rely on the best available evidence-based medicine. • Content will be fair and balanced, and if any product, specific drugs, or devices are discussed, alternate drugs or devices will also be discussed when appropriate
  • 4.
    Objectives: • Describe maindisparities in HIV epidemic in the US and Mississippi • Identify factors that affect scale up of PrEP in the South and Mississippi • Describe examples of PrEP cascade in Jackson, MS • Present data from evaluation of novel models of PrEP initiation in Mississippi
  • 5.
    Rates of Diagnosesof HIV Infection among Adults and Adolescents 2018—United States and 6 Dependent Areas N = 37,741Total Rate = 13.6 Note. Data for the year 2018 are considered preliminary and based on 6 months reporting delay. • More people living with HIV reside in the South than any other region of the country (42%) • 51% of all HIV diagnosis in the U.S. in 2018 were in the South The US HIV Epidemic Is Centered in the South
  • 6.
    HIV Disproportionally ImpactMSM in the south, especially MSM of Color
  • 7.
    Lifetime Risk ofHIV Diagnosis by Race • Whites – 1 in 140 for men – 1 in 11 MSM – 1 in 941 for women • Hispanics – 1 in 51 for men – 1 in 5 MSM – 1 in 256 for women • Blacks – 1 in 22 for men – 1 in 2 MSM – 1 in 54 for women Hess L et al. Ann Epidemiol. 2017 April; 27 (4):238-243
  • 8.
    Prevalence rates* ofHIV among MSM by race and ethnicity in Southern States (2013) (Rosenberg ES, et al. Rates of prevalent and new HIV diagnosis by race and ethnicity among men who have sex with men, U.S. states, 2013-2014. Annals of Epidemiology 2018) * Rate per 100
  • 9.
    Snap Shot ofMississippi • Mississippi’s population - 2,987 million (2018) • 55% of population reside in rural areas1 – Geographic barriers to care as many PLWHA live far from nearest treatment location • Highest percentage of residents living in poverty2 (19% vs 12% nationwide) • High rate of uninsured PLWHA (39%) or Medicaid only (14%)3 • Among highest rates of syphilis gonorrhea and chlamydia4 1. US Department of Agriculture Economic Research Service (2011). State Fact Sheets: Mississippi. Retrieved from http://www.ers.usda.gov/StateFacts/ms.HTM 2. Source: U.S. Census Bureau, Current Population Survey, 2016 to 2019 Annual Social and Economic Supplements. 3. MSDH - Single site sample of patients in-care MS Careware Data 4. CDC. STD Surveillance 2017. Atlanta:
  • 10.
    HIV/AIDS in Mississippi https://aidsvu.org/local-data/united-states/south/mississippi/ •Rate of new HIV diagnosis is 16 per 100,000 Mississippians – 6th highest in the US – 12% increase from 2017 • Among people living with HIV (10,325), 64% received medical care and 44% were virally suppressed • 18% of people diagnosed with HIV in Mississippi were Black men who have sex with men (MSM) less than 25 years old, who represented <1% of the population • 37% of women diagnosed with HIV were diagnosed with AIDS within one year of their HIV diagnosis
  • 11.
    MS: Rates ofNew HIV Cases 2013-2018 2018 • 477 New cases • 78% Men • 50% MSM • 60% < 35 years old • 74% Black • 50% MSM • 10,345 living with HIV MS HIV/AIDS Epidemiologic Profile 2018, C Khosropour
  • 12.
    Hotspot Cluster Mapfor HIV in Mississippi, 2008-2014 HIV rates per 100,000 African Americans in Mississippi Case counts among MSM in Mississippi HIV rates per 100,000 population HIV Clustering in Mississippi: Spatial Epidemiological Study to Inform Implementation Science in the Deep South. Stopka T. et al. JMIR Public Health Surveill 2018
  • 13.
    Number of NewHIV Diagnoses and Projected HIV Diagnoses to Meet EHE Goals 75% decline in HIV diagnoses 50% decline in HIV diagnoses 485 511 424 427 476 480 426 375 324 273 222 171 119 443 409 375 341 307 273 239 0 100 200 300 400 500 600 New HIV Diagnoses (Measured) MississippiNumber of New HIV Diagnoses and Projected HIV Diagnoses to Meet EHE Goals
  • 14.
    PrEP: A revolutionaryinnovation, but a difficult implementation
  • 15.
    PrEP Care Continuum Nunnet al. AIDS 2017, 31:731–734
  • 16.
    CHALLENGES TO SCALEUP PrEP IN THE PREVENTION IN THE SOUTH • RURALITY: large distances & shortage of PrEP providers • RACE: Increased proportions ofAfrican Americans & racial disparities in health care, unfair criminal justice system • POVERTY • POOR HEALTH INFRASTRUCTURE • POOR IT INFRASTRUCTURE • DISTRUST IN HEALTH CARE SYSTEM • INADEQUATE STATE & FEDERAL FUNDING • LACK OF EDUCATION • UNDERESTIMATION OF PERSONAL RISK FACTORS • ANTI-IMMIGRANT POLICIES & HEALTH-RELATED IMMIGRANT BILLS • HIV STIGMA &“AGGRESSIVE HOMOPHOBIA” Adapted From Southern AIDS Coalition. Southern States Manifesto HIV/AIDS in the South: A call to action! (2016 Update)
  • 18.
    MS has lowPrEP use and provider capacity Siegler et al., Ann Epidemiol, 2018 PrEP-to-Need Ratio, Q4 2017 The proportion of PrEP-providing clinics per PrEP-eligible MSM, 2018 There is a disconnect between PrEP need and PrEP use
  • 19.
    Open Arms HealthcareCenter, Jackson, MS LGBTQ Community Mississippi State Department of Health UMMC Division of Infectious Diseases My Brother’s Keeper Inc.
  • 20.
    PrEP Patient’s Characteristicsat Initiation Patient’s Characteristics % Mean Age (range) 29 (17-71) Male MSM 90 87 African American/Black 70 Some College or higher 59 Income < $12,000/mo. 49 Uninsured 50 Serodiscordant 25 N=475
  • 21.
  • 22.
    100% (108) PrEP Educationand Counseling 72%(78) Willing to start PrEP 71%(77) Scheduled Appointment 20%(22) Made Appointment 15% (16) Picked Up Rx 9%(10) Attended 3 month FU • Mean age 22.7 yr (18-29) • High risk (100%) • 66% non-exclusive sex partner • Insurance (45%) PrEP Uptake Among YBMSM in Jackson STD Clinic Arnold T, 2017
  • 23.
    Integrating PrEP intoPartner Services: the Mississippi Experience October 2017 – December 2018 in Jackson, MS ~3-4 weeks Lewis et al., CDC HIV Preven Conf 2019 10% Key take-aways: • Good idea in theory, but this missed the mark • We need a program that does a better job of promoting PrEP and reduces the time from being offered PrEP to starting PrEP
  • 24.
    Need to changethe PrEP referral model for STD clinics and DIS providing partner services in Jackson, MS • Limited client knowledge about PrEP (e.g., health benefits, availability, cost) • STD clinic staff and DIS do not have capacity for in- depth PrEP education and ongoing follow-up with clients • Long delay between referral and appointment may result in low appointment attendance • Small proportion of those with PrEP indication attended PrEP initiation appointment Arnold et al., PLoS One. 2017 Feb 21;12(2):e0172354 Peyton et al., CDC STD Preven Conf 2018
  • 25.
    • Informed byIMB • Targeted social support, stigma and communication with provider • Intervention was composed of free, publically available links to interactive websites and YouTube videos • AA men received texted material over four weeks • AA men ≥21 years who received the intervention were: • more likely to be taking PrEP at 12 weeks after intervention (55% vs. 18%, p=0.02) • More likely to have picked up a PrEP prescription over the 24- week study period (50.5 vs. 17%, p =0.04) PrEP Mobile* *A Mobile Intervention to Improve Uptake of PrEP for Southern Black MSM, 1R34MH111342-01A1, Whiteley L, Mena L Whiteley L, et al., AIDS Behav 2021 Jun;25(6):1884-1889
  • 26.
  • 27.
    Pilot Study Objectives Overallgoal: Develop an optimized rapid PrEP initiation model Objectives: 1. Evaluate the acceptability and effectiveness of the rapid PrEP model 2. Identify barriers and facilitators to implementing the rapid PrEP model
  • 28.
    STD clinic Staff/DIS PrEP Navigator Same-day PrEP Rxto local pharmacy Appointment with clinical provider •PrEP Education •Assess for acute HIV •Medical and meds hx •Insurance paperwork •Standard STD/HIV screening and risk assessment •Standard partner services interview •Rapid HIV test Within 12 weeks •Creatinine •Hep B testing Rapid PrEP model If HIV-neg Navigator is a clinical pharmacist! Provide a prescription the same day as a referral: •In absence of clinician •Without completion of baseline creatinine and Hep B labs (completed after PrEP initiation) Khosropour C et al., AIDS Patient Care STDs 2020
  • 29.
    121 Clients Referredfor Rapid PrEP Nov 2018- Dec 2019 n (N=121) % Age (median and IQR) 26 23 – 35 Male sex at birth 75 62% Transgender identity 6 5% Race/ethnicity Black, non-Hispanic 93 77% White, non-Hispanic 23 19% Hispanic 4 3% Referred from DIS* 35 30% Currently insured 40 33% *22 dx with STD; 1 contact to GC/CT; 14 contacts to syphilis or HIV n (N=121) % Payment for PrEP Gilead patient assistance 92 75% Medicaid 9 7% Private Insurance 20 16% Out of pocket 1 1% Method of Rx Receipt Pick-up in pharmacy 90 74% Mail 31 26% Referral to clinical provider Community LGBTQ clinic 37 32% Academic Medical Center 64 55% Other 15 13% Demographics and Referral Source Payment and Prescription
  • 30.
    Rapid PrEP Continuum 121 116 87 52 0 20 40 60 80 100 120 140 Referredto Navigator Received PrEP Rx Filled PrEP Rx Attended Clinical Appointment Number of Clients 96% 68% 60% 43%
  • 31.
    Clients are receivingPrEP the same day 121 116 87 52 0 20 40 60 80 100 120 140 Referred to Navigator Received PrEP Rx Filled PrEP Rx Attended Clinical Appointment Number of Clients 100% had visit with navigator with-in 2 business days of the rapid HIV test 96% received rx within 5 days 72% filled rx within 7 days *51% attended appt w/in 8 weeks
  • 32.
    Top reasons fornot attending appointment (n=48) 7 (24 %) of 29 clients who did not pick up their prescription, later on contacted the navigator to re-initiate process of getting on PrEP • 25% no longer want to take PrEP • 10% lack of transportation • 6% forgot about appointment* • 10% Never started PrEP • 17% Other reasons • 31% Lost to follow up * All rescheduled appointment
  • 33.
    Rapid PrEP isacceptable to clients N or median % or IQR Overall satisfaction with program – median and IQR 99.5 93 – 100 Confident in navigator’s knowledge – median and IQR 99.5 87-100 Wanted to see doctor or nurse instead 3 12% Confidence in your ability to attend follow-up appointments – median and IQR 100 93-100 Results from patient satisfaction survey *(N=36)
  • 34.
    Clients felt comfortable& liked the ease of rapid PrEP What did you like about receiving PrEP from this program? Clients felt comfortable • “I didn't feel judged or embarrassed she was talked and explain it to where I would understand and ask me questions to make sure I did” • “Kandis made me feel incredibly welcomed and comfortable throughout the process.” Clients liked the ease of the program • “I like how easy and informative this program has been” • “that they are making a way for people to stay HIV free and be able to obtain the medication without insurance”
  • 35.
    Advantages of havinga pharmacist as navigator • Expert in medication, insurance and health services navigation, and patient assistance • In MS – collaborative practice agreement with physician allows prescription to be sent by pharmacist under physician’s name – Physicians are able to prescribe medications for patients that they have not seen yet
  • 36.
    Summary: Acceptability andEffectiveness • Successfully evaluated 121 clients for PrEP in 12 months • 65% filled PrEP prescription, of whom 85% filled it within one week of meeting with the navigator • Two thirds attended appointment • Model was acceptable to patients; comfort with navigator was key
  • 37.
    Summary: Barriers andfacilitators • Integrating model into partner services takes time • Some confusion in pharmacies and clinics with “rapid PrEP” clients – we developed work-arounds and flow is now working well • Some client-level barriers may be addressable (e.g., transportation) but many are lost to follow-up
  • 38.
    Key Lessons Learned •Integration into health department partner services may require dedicated staff • People may not be ready to start PrEP even if they fill the prescription • Pharmacist is key but sustainability is questionable • Clients appreciated non-judgmental approach • People will re-connect when they are ready to start PrEP; we need to facilitate that “re- connection”
  • 39.
    Can this modelbe implemented in other settings? • Works well in areas with low PrEP provider capacity • Need strong clinical partnerships for program oversight and to accept patients who have already started PrEP • Need dedicated staff for ongoing check-ins and follow-up
  • 40.
    UPrEPMS HRSA Telehealth Centerof Excellence (U66RH31459)
  • 41.
    UPrEPMS 151 •Clients seen byPrEP navigator 144 (95.4%) •Clients given a PrEP prescription* 136 (94.4%) •Clients who picked up their initial prescription Cumulative Summary Characteristic Results Age Median: 28 years (range: 17-67 years) Birth Sex Male: 120 (80%) Female: 30 (20%) Transgender 4 transgender clients (2.7%) Race/Ethnicity Black: 109 (73.2%) White: 29 (19.5%) Other race: 4 (2.7%) Hispanic: 7 (4.7%) Insurance 65 (46.1%) clients were Client Demographics Cumulative Summary 151 110 (72.8%) 20 (18.2%) Clients had an initial PrEP evaluation Clients attended a follow-up appointment 41 clients with no initial clinical evaluation documented Clients had an initial clinical evaluation
  • 42.
    Next Steps • 12-monthsfollow up data to rapid PrEP • Interview of participants who: – Didn’t pick up prescription – Pick up prescription but did not take it – Took PrEP but did not attend the appointment – Attended the appointment but discontinued PrEP • Expand UPrEPMS to CBOs, Health Department and other Rural Clinics
  • 43.
    Acknowledgements University of Washington •Christine Khosropour, PhD, MPH • Arianna Rubin Means, PhD, MPH • Monisha Sharma, PhD Open Arms Healthcare Center • Sandra Melvin DrPh • Teayaka Jones Brown University • Laura Whitely, MD • Larry Brown, MD Mississippi State Department of Health • Melverta Bender, MLS, MPH • Christie Lewis, MPH • LaPrince Evans • DIS Supervisors and Team V • Five Points Clinic Staff University of Mississippi Medical Center • Kandis Backus, PharmD, MS, AAHIVP • Kendra Johnson, MPH • Courtney Gomillia, MS-PHS • Nicholas Chamberlain, MD • Jennifer Brumfield, RN • Mariah Prather • James B. Brock, MD • Laura Beauchamps, MD • EPH and ASCC staff Funding: CFAR Administrative Supplement (NIHAI027757) HRSA Telehealth Center of Excellence (U66RH31459) NIMH (5R34MH104068-02)

Editor's Notes

  • #6 In 2018, in the United States and 6 dependent areas, the rate of diagnoses of HIV infection among adults and adolescents was 13.6 per 100,000 population. The rate of diagnoses of HIV infection for adults and adolescents ranged from 0.0 per 100,000 in American Samoa and the Republic of Palau to 34.6 per 100,000 in the District of Columbia.   The District of Columbia (i.e., Washington, DC) is a city; use caution when comparing the HIV diagnosis rate in DC with the rates in states.   Data for the year 2018 are considered preliminary and based on 6 months reporting delay.
  • #7 This slide presents the number of diagnoses of HIV infection in 2018 among men who have sex with men (MSM) by race/ethnicity and the region of the United States where they were living at the time of diagnosis. Diagnoses of HIV infection among MSM in the 6 U.S. dependent areas are also shown by race/ethnicity.   The South had more diagnoses of HIV infection among MSM — 12,664 diagnoses in 2018 — than any other region. The largest group of MSM with diagnosed HIV infection in the South were blacks/African Americans, followed by Hispanics/Latinos, whites, males of multiple races, Asians, American Indians/Alaska Natives, and Native Hawaiians/other Pacific Islanders. In the West, the number of diagnoses of HIV infection among MSM was 5,374. The racial/ethnic group with the largest number of diagnoses were Hispanics/Latinos, followed by whites, blacks/African Americans, Asians, males of multiple races, American Indians/Alaska Natives, and Native Hawaiians/other Pacific Islanders.   In the Northeast the number of diagnoses of HIV infection among MSM was 3,323. The racial/ethnic group with the largest number of diagnoses were Hispanics/Latinos, followed by blacks/African Americans, whites, Asians, males of multiple races, American Indians/Alaska Natives, and Native Hawaiians/other Pacific Islanders.   In the Midwest, the number of diagnoses of HIV infection among MSM was 3,289. The racial/ethnic group with the largest number of diagnoses were blacks/African Americans, followed by whites, Hispanics/Latinos, males of multiple races, Asians, American Indians/Alaska Natives, and Native Hawaiians/other Pacific Islanders.   In the dependent areas, 95% of diagnoses of HIV infection among MSM in 2018 were in Hispanics/Latinos. Inter-region comparisons of numbers of diagnosed HIV infections should be made cautiously because the four regions and the dependent areas vary by number of jurisdictions and by population size.   Regions of residence are defined as follows: Northeast—Connecticut, Maine, Massachusetts, New Hampshire, New Jersey, New York, Pennsylvania, Rhode Island, and Vermont; Midwest—Illinois, Indiana, Iowa, Kansas, Michigan, Minnesota, Missouri, Nebraska, North Dakota, Ohio, South Dakota, and Wisconsin; South—Alabama, Arkansas, Delaware, District of Columbia, Florida, Georgia, Kentucky, Louisiana, Maryland, Mississippi, North Carolina, Oklahoma, South Carolina, Tennessee, Texas, Virginia, and West Virginia; West—Alaska, Arizona, California, Colorado, Hawaii, Idaho, Montana, Nevada, New Mexico, Oregon, Utah, Washington, and Wyoming. The 6 U.S. dependent areas include American Samoa, Guam, the Northern Mariana Islands, Puerto Rico, the Republic of Palau, and the U.S. Virgin Islands.   Data for the year 2018 are preliminary and based on 6 months reporting delay. Data have been statistically adjusted to account for missing transmission category. Data on men who have sex with men do not include men with HIV infection attributed to male-to-male sexual contact and injection drug use.   Hispanics/Latinos can be of any race.
  • #8 These disparities are not more start than when they are presented as the lifetime risk f HIV diagnosis. Which since since previous estimates based on 2004-2005 data has decreased among both men and women by 21% and 44% respectively. Risk of MSM is 88 times higher than heterosexual men As you can see significant disparities exist particularly in the lifetime risk of MSM of all races that should be given careful consideration and to the very least drive our sense of urgency to act now in addressing them. As they represent estimates of a probability, I will show you in the following slides how they become reality and add to trends that may be very challenging to turn around unless we act now.
  • #9 How well do you think treatment is currently working for prevention?
  • #12 Rate of HIV diagnosis in men increased by 17% between 2017 and 2018 among men. It has declined by 11% among women since 2013. 96% of Hispanic cases are among MSM
  • #13 Objective: The goal of this study was to identify and characterize HIV clusters in Mississippi through analysis of state-level HIV surveillance data. Methods: We used a combination of spatial epidemiology and statistical modeling to identify and characterize HIV hotspots in Mississippi census tracts (n=658) from 2008 to 2014. We conducted spatial analyses of all HIV infections among men who have sex with men (MSM), and infections among African Americans. Multivariable logistic regression analyses identified community-level sociodemographic factors associated with HIV hotspots considering all cases. Results: There were HIV hotspots for the entire population, MSM, and African American MSM identified in the Mississippi Delta region, Southern Mississippi, and in greater Jackson, including surrounding rural counties (P<.05). In multivariable models for all HIV cases, HIV hotspots were significantly more likely to include urban census tracts (adjusted odds ratio [AOR] 2.01, 95% CI 1.20-3.37) and census tracts that had a higher proportion of African Americans (AOR 3.85, 95% CI 2.23-6.65). The HIV hotspots were less likely to include census tracts with residents who had less than a high school education (AOR 0.95, 95% CI 0.92-0.98), census tracts with residents belonging to two or more racial/ethnic groups (AOR 0.46, 95% CI 0.30-0.70), and census tracts that had a higher percentage of the population living below the poverty level (AOR 0.51, 95% CI 0.28-0.92). Conclusions: We used spatial epidemiology and statistical modeling to identify and characterize HIV hotspots for the general population, MSM, and African Americans. HIV clusters concentrated in Jackson and the Mississippi Delta. African American race and urban location were positively associated with clusters, whereas having less than a high school education and having a higher percentage of the population living below the poverty level were negatively associated with clusters. These kind of analysis may help to use more effectively limited resources for improved HIV testing and tailored preexposure prophylaxis to address HIV disparities Keep in mind too that the Social Determinants of Health in these communities are important to address. Some are not modifiable: race; others are modiafiable: poverty, education. Implies that multi-sectoral engagement should be part of health policy and would improve HIV and other chronic diseases in this population (Obesity, HTN, DM) .
  • #14 Progress toward reducing new HIV infections has stalled out in recent years. New federal initiative hopes to catalyze that. Focus of EHE is 48 counties plus DC + PR and 7 status with a substantial burden of HIV in rural areas. Four pillars to EHE. Goal is to reduce number of new infections by 75% in 5 years. Remember, the total number of new infections increased by 7% between 2017 and 207% in the last 5 years. We need to make 10x more progress!
  • #15 Progress toward reducing new HIV infections has stalled out in recent years. New federal initiative hopes to catalyze that. Focus of EHE is 48 counties plus DC + PR and 7 status with a substantial burden of HIV in rural areas. Four pillars to EHE. Goal is to reduce number of new infections by 75% in 5 years. Remember, the total number of new infections decreased by 7% in the last 5 years. We need to make 10x more progress!
  • #17 Because PrEP is intended to reduce HIV acquisition rather than treat disease, PrEP-related outcomes differ from the HIV treatment continuum . Nunn proposed that the PrEP care continuum should include the following steps: (1) Identifying individuals at highest risk for contracting HIV (2) Increasing HIV risk awareness among those individuals (3) Enhancing PrEP awareness (4) Facilitating PrEP access (5) Linking to PrEP care (6) Prescribing PrEP (7) Initiating PrEP (8) Adhering to PrEP (9) Retaining individuals in PrEP care (see Fig. 1). The first three steps in the PrEP care continuum focus on PrEP awareness. Steps 4 to 7 are related to PrEP uptake, and steps 8 and 9 focus on adherence and retention in PrEP care.
  • #18 The Southern AIDS Coalition notes a number of challenges to HIV prevention and care in this region Rurality: results in large distances to health care providers and lack of public transportation. ((Also a shortage of health care providers in general; fewer with expertise in HIV treatment)) Increased proportions of African Americans with attendant racial disparities in health care Poor health infrastructure – eg, limited STD treatment services Distrust of health care system due to past – and ongoing – inequities Stigma: small towns where everyone knows everyone else, increased risk of inadvertent confidentiality breeches. “Aggressive homophobia” Inadequate federal funding Lack of education ((with underestimation of personal risk)) Anti-immigrant policies and health-related immigrant bills that restrict access to health care of the regions’ many Latino immigrants.
  • #20 PrEP was FDA approved in 2012. This is from the end of 2017. But we also know PrEP isn’t getting ot the people who need it the most –why? An algorithm to identify TDF/FTC for PrEP was applied to a national prescription database. PrEP prevalence, active prescription per population, was assessed. HIV diagnoses from 2016 were used as an epidemiological proxy for PrEP need. The ration of PrEP prescription per new HIV diagnosis (PrEP-to-ned ratio) was used to describe the distribution of prescriptions relative to epidemic need. This study presents people actively engaged in PrEP within a quarter National quarterly estimate was 61,000 (lower than the 120,000 cumulative PrEP starts) The South had the lowest PrEP to need ratio and the NE had the highest By State-level need ratio was higher among states that had adopeted Medicaid expansion than states without expansion States in the higher quartiles of proportion of residents living in poverty had lower active prescription prevalence and PrEP-to-need ration than states in the lowest quartile States in the highest quartiles of African Americans residents concentration had higher active prescription prevalence but lower PrEP-to-need ratios than states in the lowest quartiles Females had lower active PrEP prescription prevalence and lower PrEP-to-need rations than males across all region and age groups Active prescription prevalence and PrEP-to-need rations were lower among persons aged < 25 and > 55
  • #21 Open Arms is an example of an structural intervention: Community driven – space designed by the community including name, what services to prioritize (food pantry, mental health, HIV prevention) Staff trained in LGBT cultural competency, sex positive, affirming
  • #22 11 Cisgender Women 4 trasnsgender women social, structural, behavioral and clinic level factors affect uptake, persistance and adherence to PrEP Interventions are needed to help these men overcome barriers
  • #25 Reasons for not accepting referral: 60% not interested or did not perceive themselves to be at risk. Lack of interest; transportation; poor medication adherence
  • #27 PrEP Mobile is an intervention that we develop and tested in Jackson, Mississippi to improve PrEP uptake among young Black men who have sex with men. <pause> The intervention was guided by the IMB model and<pause> targeted social support, stigma, and communication with providers. <pause> This intervention was composed of free, <pause> publicly available links to interactive websites and YouTube videos that provided factual information and motivational materials about PrEP. <pause> Intervention material was chosen based on the barriers and facilitators elicited in focus groups with young Black MSM. <pause> and was texted to men enrolled in the study over four weeks, two links texted per week. <pause> We found that Black men 21 years or older who received the PrEP mHealth Intervention were significantly more likely to be taking PrEP at 12 weeks after the intervention. <pause> These men were also significantly more likely to have picked up a PrEP prescription by pharmacy records over the 24-week study period. <pause> The intervention was also associated with an improvement in knowledge about PrEP and a decrease in internalized homonegativity.
  • #29 Include overall goal; CFAR supplement objectives
  • #30 4th generation antigen/antibody test
  • #31 MSM median age=25 (23-28); 70% black Women median age=29 (25-36); 75% black EPH 81% DIS 18%
  • #32 6 clients attended the appointment but didn’t fill Rx (if we include that it’s 39%)
  • #33 *102 have had their appointment date past already 52 have attended their appointment. ~90% of patients don’t attend their clinical appointment they walk in at a later date.
  • #34 19/33
  • #35 * Not all participants were sent a survey link. This was completed until we reached saturation with the responses. Funding also was limited as participants were paid for their participation.
  • #36 16 people provided written comments
  • #37 In MS, Pharmacists don’t have independent prescriptive authority. Rx sent under Kandis’ name but billed under a physician’s name MDs are able to prescribe medications for patients they don’t see per the MS Board of Medical Licensure.
  • #38 40% of those evaluated were Black MSM
  • #39 40% of those evaluated were Black MSM
  • #40 Model works well to get people on PrEP fast but adherence to clinical appts is subopitmal
  • #42 24 Spot - 0 8 ASC – 8 on PrEP